

Market Data

January 3, 2018
Key Market Indicators Positive for First Quarter
Written by Peter Wright
Key market indicators bode well for business conditions in the first quarter of 2018. Steel Market Update’s view of the present situation based on our examination of data released in December shows that 47.2 percent of the 36 indicators are historically positive with only 19 percent negative. The balance is within the historically normal band. The total of positive and normal has not changed in six months. However, there have been frequent changes in the detail. Trends improved with 80.6 percent of the indicators heading in a positive direction, up from 61.1 percent in October and from 72.2 percent in November. Trends lead the present situation by about four months.
See the end of this piece for an explanation of the Key Indicators concept. It explains the difference between our view of the present situation, which is subjective, and our analysis of trends, which is based on the latest facts available. The total number of indicators considered in this analysis is 36.
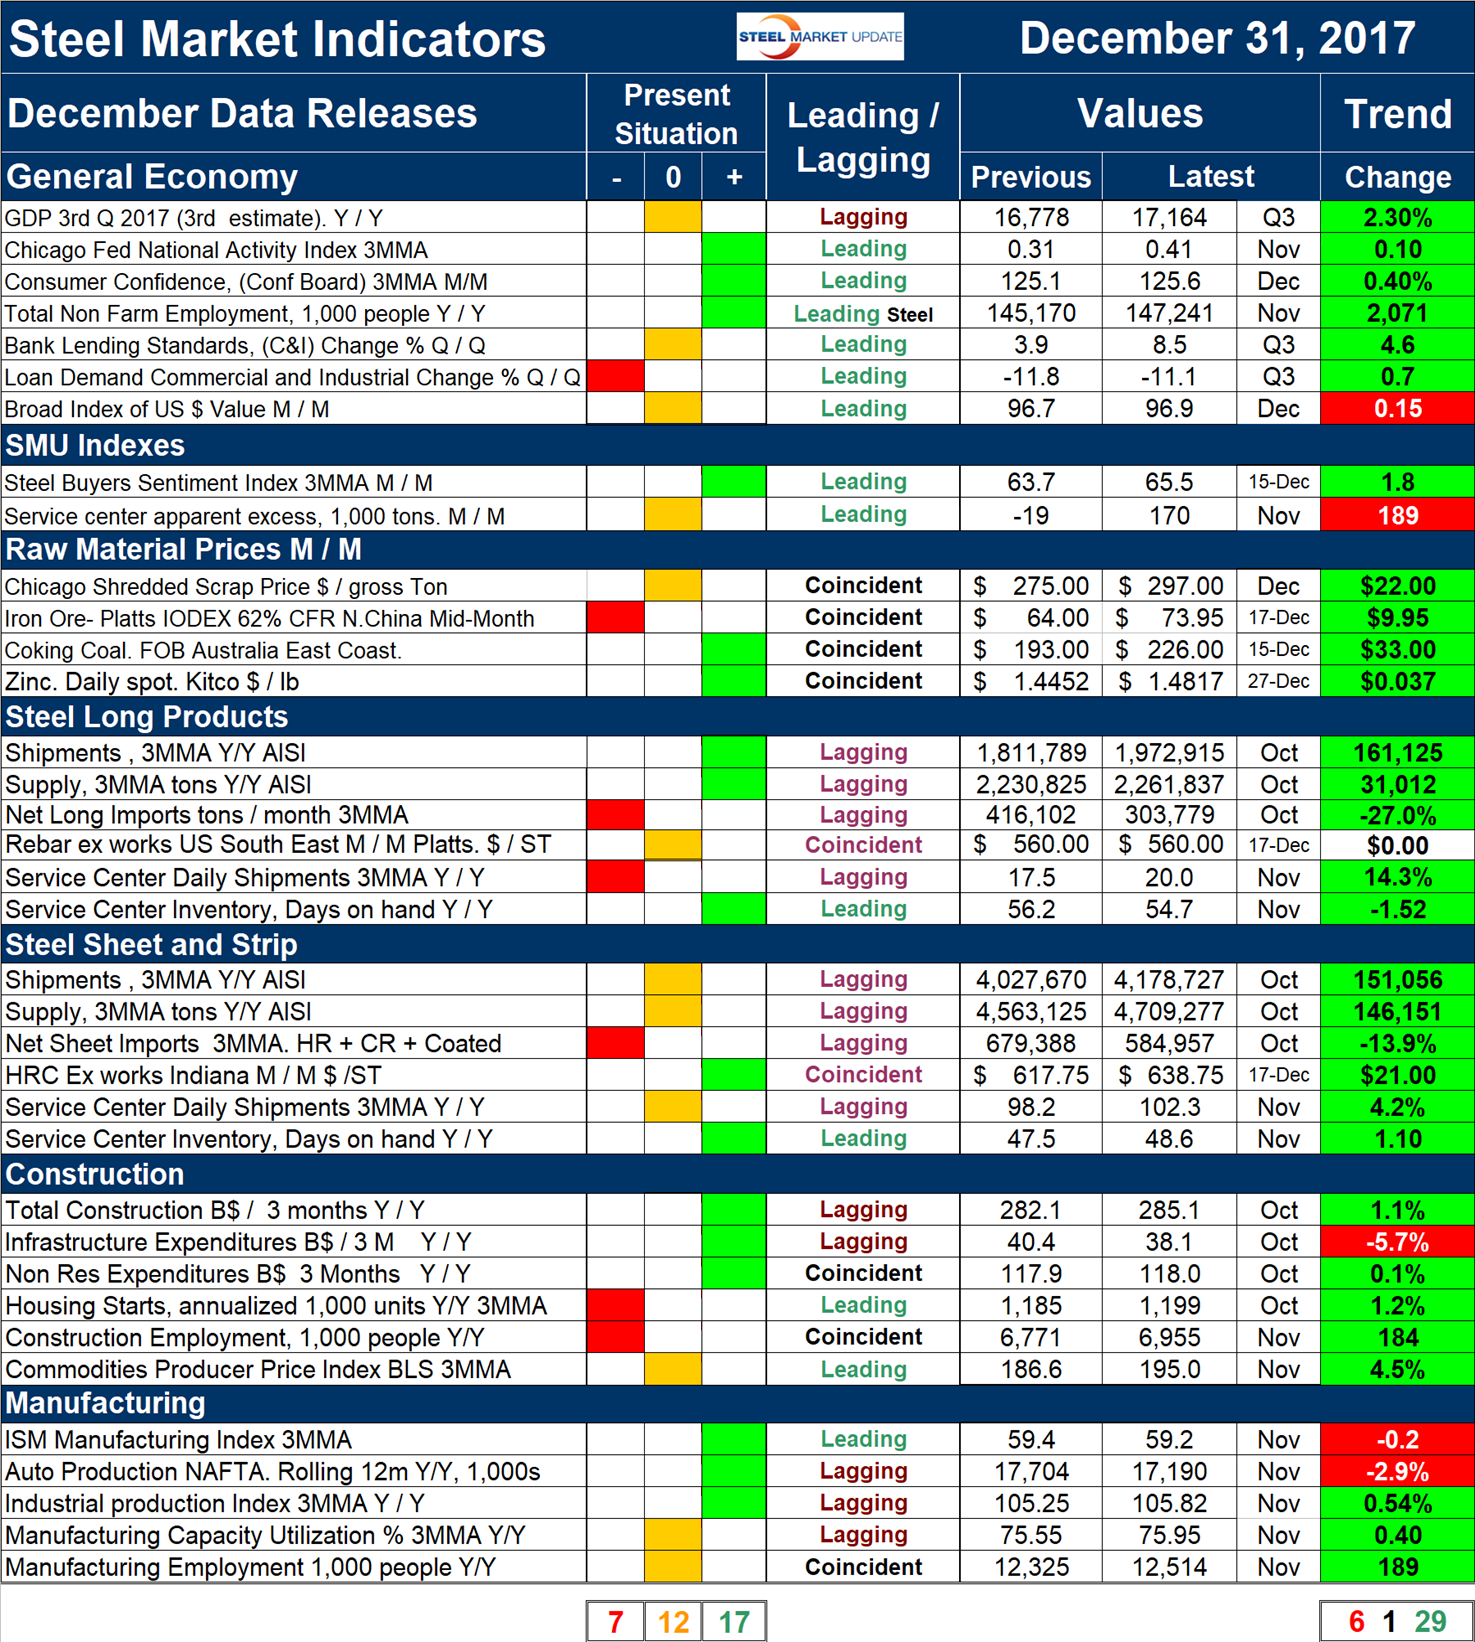
Please refer to Table 1 for our view of the present situation and the quantitative measure of trends. Readers should regard the color codes in the present situation column as a visual summary of the current market condition. The “Trend” columns of Table 1 are also color coded to give a quick visual appreciation of the direction in which the market is headed. All data included in this table was released in December. The month or specific date to which the data refers is shown in the second column from the far right, and all results are the latest available as of Dec. 31, 2017.
Present Situation
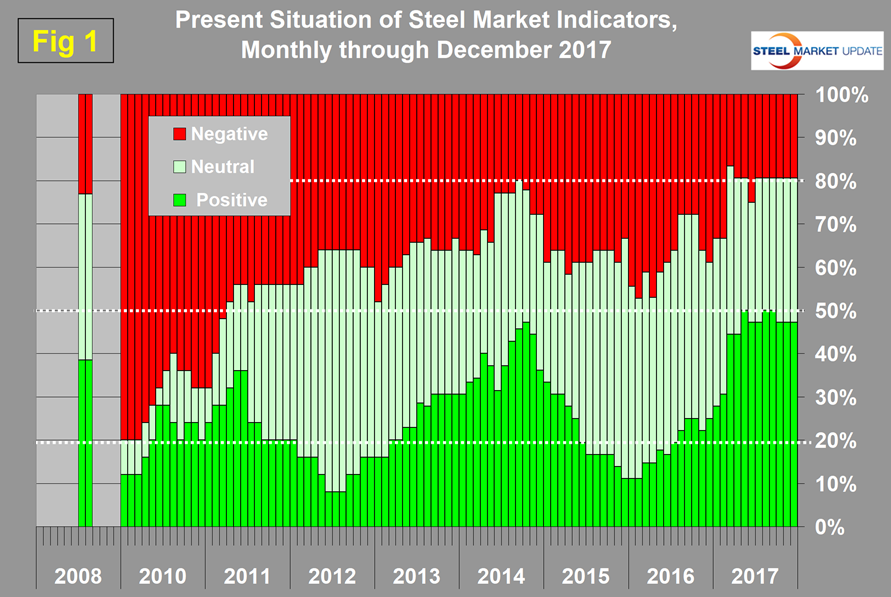
There was no change in our perception of the balance of indicators in December between negative, neutral and positive, though there were changes in the detail. We currently view 17 of the 36 indicators as positive, 12 as neutral and 7 as negative. Our intent in using the word neutral is to say that this indicator is in the mid-range of historical data. There were two changes in December: the price of coking coal and the supply of long products were both re-classified from neutral to positive. In the sheet steel section, both mill shipments and service center shipments were re-classified from positive to neutral. Figure 1 shows our monthly assessment of the present situation since January 2010 on a percentage basis. The indicator classification has been remarkably consistent for the last 10 months with the combination of positive and neutral indicators being above 80 percent for nine of those months. This is the best string of results since we began this analysis in January 2010.
Trends
Most values in the trends columns are three- month moving averages (3MMA) to smooth out what can be very erratic monthly data. Trend changes in the individual sectors since the end of November data are described below, with some general comments. (Please note that in most cases this is not December data, but data that was released in December for previous months.)
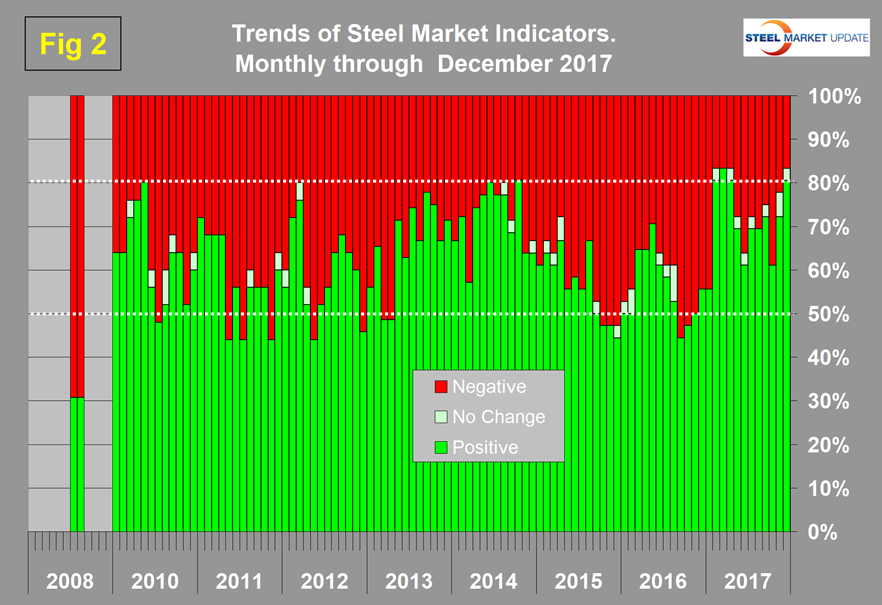
In the four months December 2016 through January 2017, there was a steady improvement in trends. There was a positive surge in February that was sustained in March and April. In the seven months through November, trends were erratic but never fell below 61 percent positive. Trends in December returned to 80.6 percent positive. Figure 2 shows the trend of the trends and the pre-recession situation at the far left of the chart.
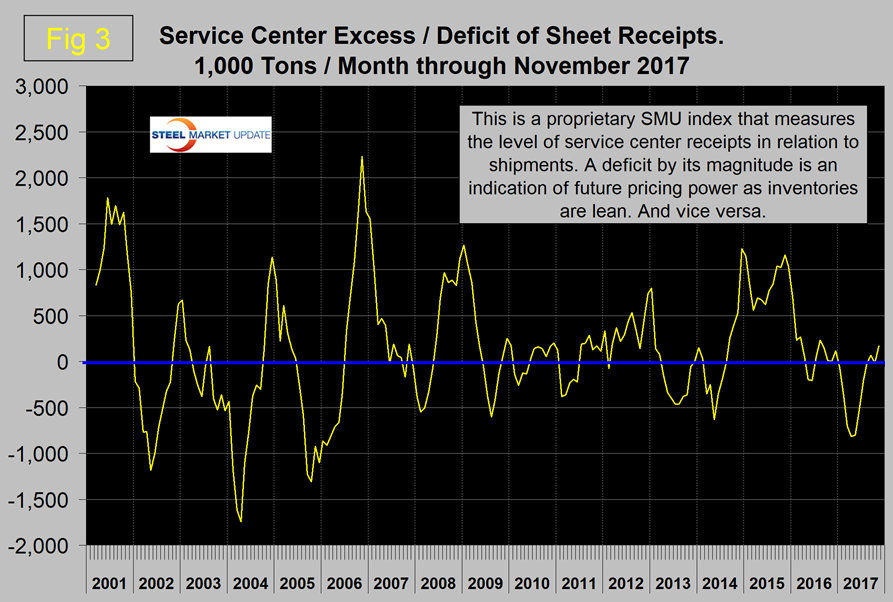
Our observations about trends in the December data are as follows: In the General Economy section of Table 1, there were no tend reversals. All indicators except the value of the U.S. dollar trended positive in December. The dollar strengthened, which we regard as negative because of the effect on the trade balance. Both the SMU proprietary indexes reversed direction. Service center excess of sheet products became increasingly negative through April this year when it reached negative 816,000 tons. Since then, the deficit declined and became positive 170,000 tons in the November data. This is a proprietary SMU calculation. We regard an inventory deficit to be positive in terms of pricing power, therefore we are presently in a situation of negotiation neutrality (Figure 3).
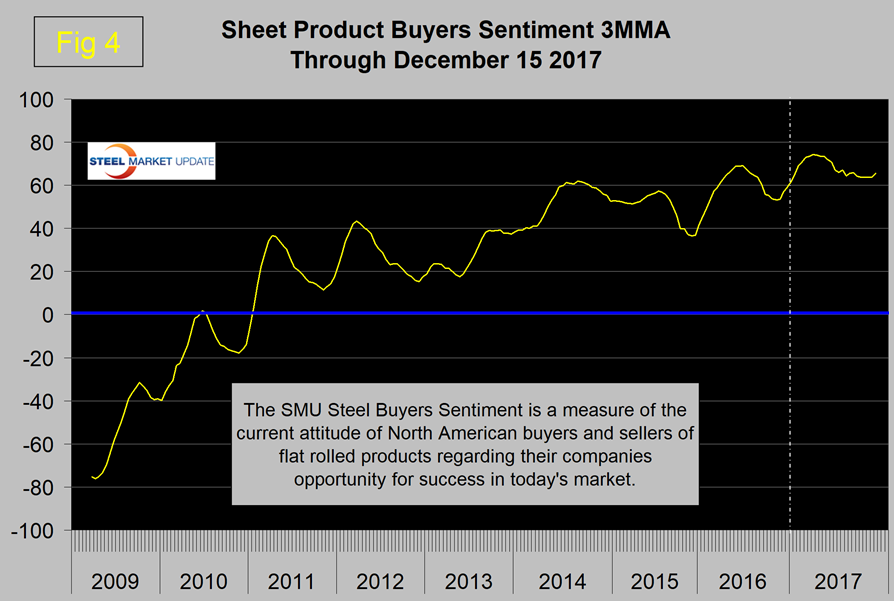
The steel buyer’s sentiment reversed direction in December, trended positive and maintained its historically very high level (Figure 4). There was a positive shift in raw materials prices when Chicago shredded and zinc both reversed direction and trended positive in December. We regard rising raw materials prices as positive and indicative of a strengthening market.
In December, the prices of all four raw materials that SMU tracks increased. In the long steel products sector, there was a positive reversal in apparent supply (which is a proxy for demand). The price of rebar ex works U.S. South East was unchanged after declining in October. In the sheet products sector, all trends are flashing green. This was an improvement of one since our November report in which the price of HRC, ex works Indiana, had decreased. In the construction sector, non-residential building expenditures reversed direction and trended positive. Five of the six construction indicators are now trending positive. In the manufacturing sector, there was also one trend reversal when the ISM manufacturing index declined slightly, albeit from a very high level. Three of the five manufacturing indicators were trending positive in the November data.
We believe a continued examination of both the present situation and direction is a valuable tool for corporate business planning.
Explanation: The point of this analysis is to give both a quick visual appreciation of the market situation and a detailed description for those who want to dig deeper. It describes where we are now and the direction in which the market is headed, and is designed to describe the situation on a specific date. The chart is stacked vertically to separate the primary indicators of the general economy, of proprietary Steel Market Update indices, of raw material prices, of both sheet and long product market indicators, and of construction and manufacturing indicators. The indicators are classified as leading, coincident or lagging as shown in the third column.
Columns in the chart are designed to differentiate between where the market is today and the direction in which it is headed. Our evaluation of the present situation is subjectively based on our opinion of the historical value of each indicator. There is nothing subjective about the trends section, which provides the latest facts available on the date of publication. It is quite possible for the present situation to be predominantly red and trends to be predominantly green or vice versa depending on the overall situation and direction of the market. The present situation is subdivided into: below the historical norm (-), (OK), and above the historical norm (+). The “Values” section of the chart is a quantitative definition of the market’s direction. In most cases, values are three-month moving averages to eliminate noise. In cases where seasonality is an issue, the evaluation of market direction is made on a year-over-year comparison to eliminate this effect. Where seasonality is not an issue, concurrent periods are compared. The date of the latest data is identified in the third values column. Values will always be current as of the date of publication. Finally, the far-right column quantifies the trend as a percentage or numerical change with color code classification to indicate positive or negative direction.


