

Prices

March 9, 2018
SIMA: Steel Imports on the Decline Through February
Written by Peter Wright
Total rolled steel imports declined by 14.8 percent, and sheet products by 13.6 percent, in the three months through February compared to the prior three-month period, according to Steel Market Update’s analysis of federal Steel Import Monitoring and Analysis (SIMA) data.
This is the second edition of our new and expanded import report that now includes all major steel sectors: sheet, plate, longs and tubulars, with a total of 18 subsectors. In the next week, we will publish our first import market share analysis for the same 18 steel product groups. Together, this import report plus the import share report should give an accurate view of the effect of the Section 232 trade legislation. See the end of this piece for an explanation of the methodology. All volumes in this analysis are reported in short tons. We use three-month moving averages rather than single-month results to smooth out the variability.
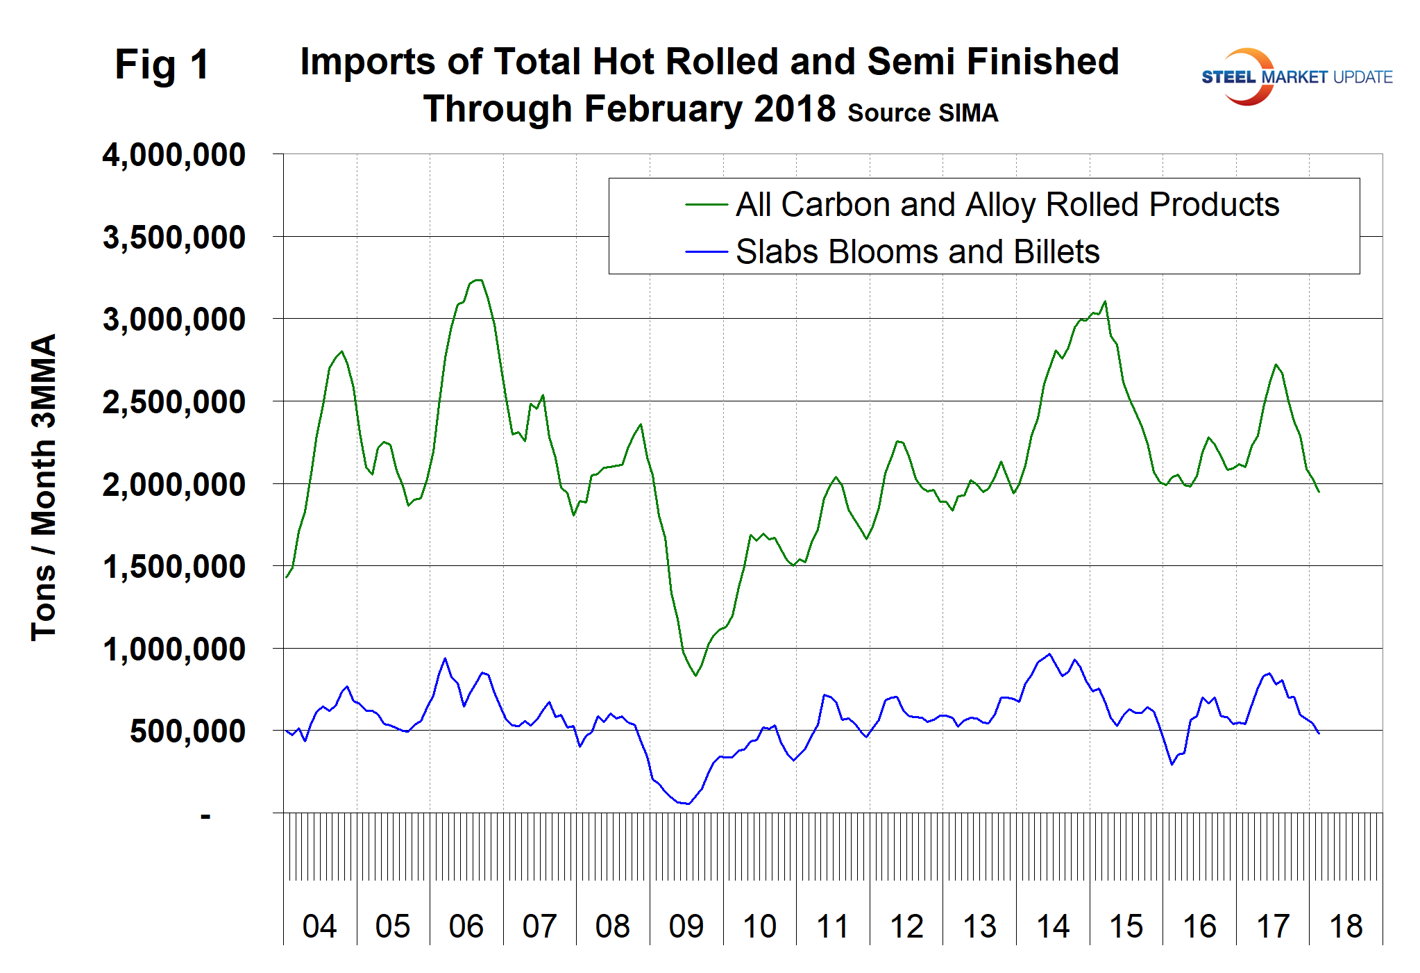
Figure 1 shows the tonnage of total rolled steel and semi-finished imports through February. The three-month moving average (3MMA) of total rolled product import volume in July 2017 was 2,722,567 tons, the highest since May 2015. Imports declined every month on this basis through February 2018 when they reached 1,948,368 tons. This was the first time imports dipped below two million tons since May 2016. The 3MMA of semi-finished imports in February was 481,965 tons. This was the first time for semi-finished to fall below 500,000 tons since April 2016. Semi-finished imports had a recent peak of 848,661 tons in June 2017.
There are three tables in this report. In each of them, we show the 3MMA of the tonnage in February 2018 and 2017 with the year-over-year change. We then calculate the percentage change in volume in the most recent three months with the previous three months. This month, we are comparing December/January/February with September/October/November (3M/3M). The next column to the right shows the year-over-year change as a percentage. Declines are color coded green and increases are coded red. Finally, in the far-right column, we subtract the 12-month change from the three-month change. This is a way of describing the magnitude of the recent trend as a percentage. In some cases, even though imports are declining in both time frames, the trend is red meaning the decline is slowing.
Table 1 describes the imports of all major sectors of the sheet and plate markets. In the flat rolled sectors shown in Table 1, all sheet and plate products had declining imports 3M/3M and only hot rolled sheet and coiled plate had a year-over-year increase. Figures 2 and 3 show the history of sheet and plate product imports since February 2004.
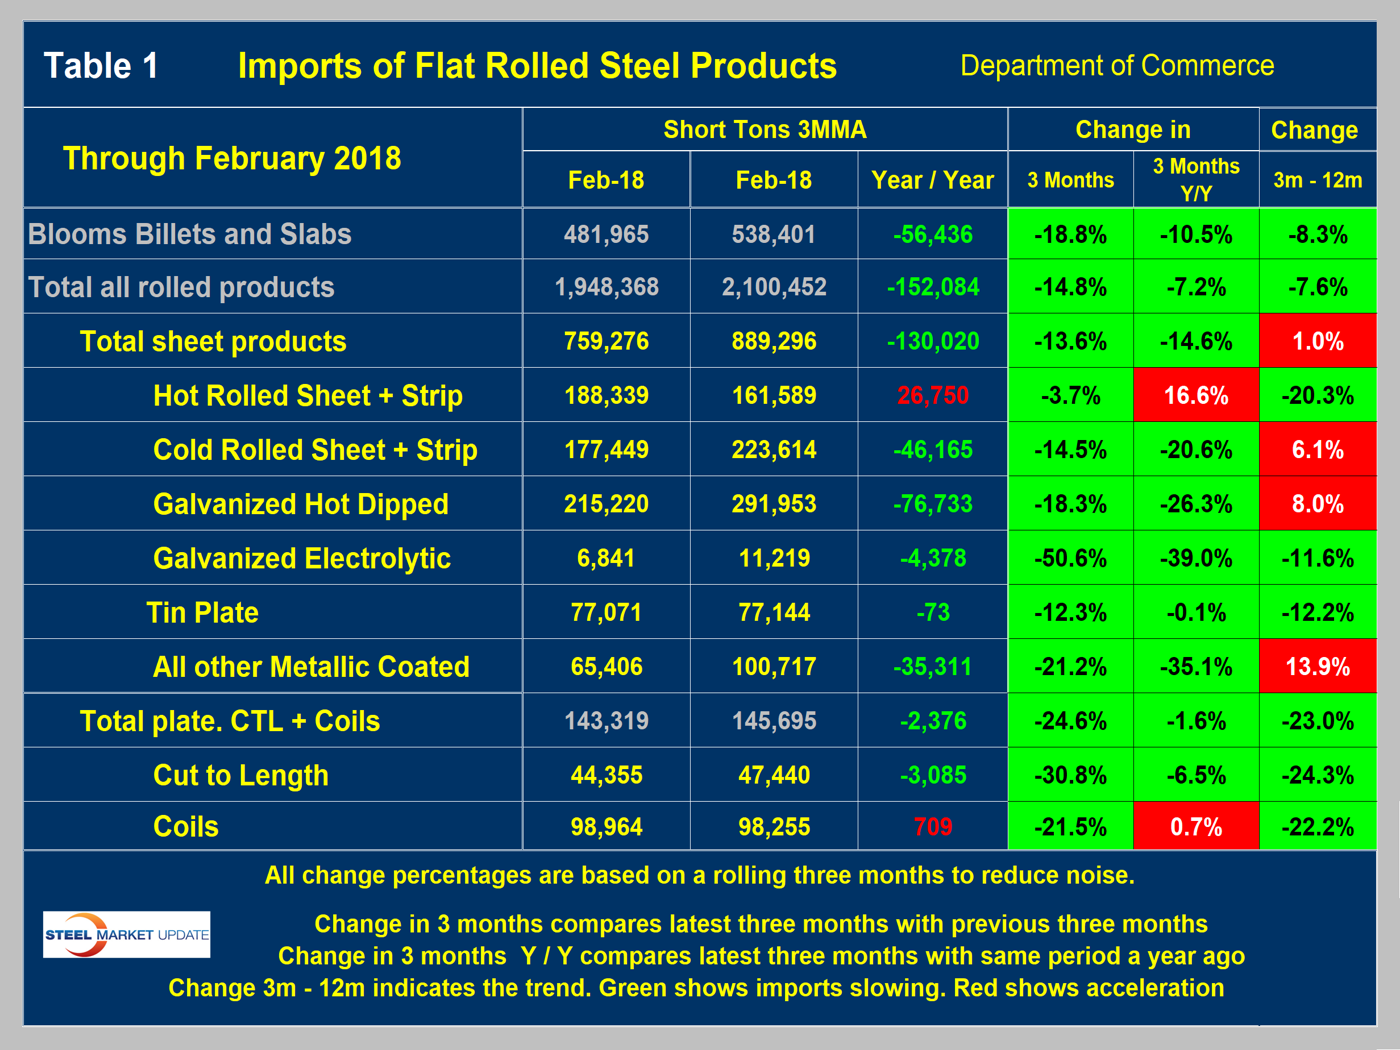
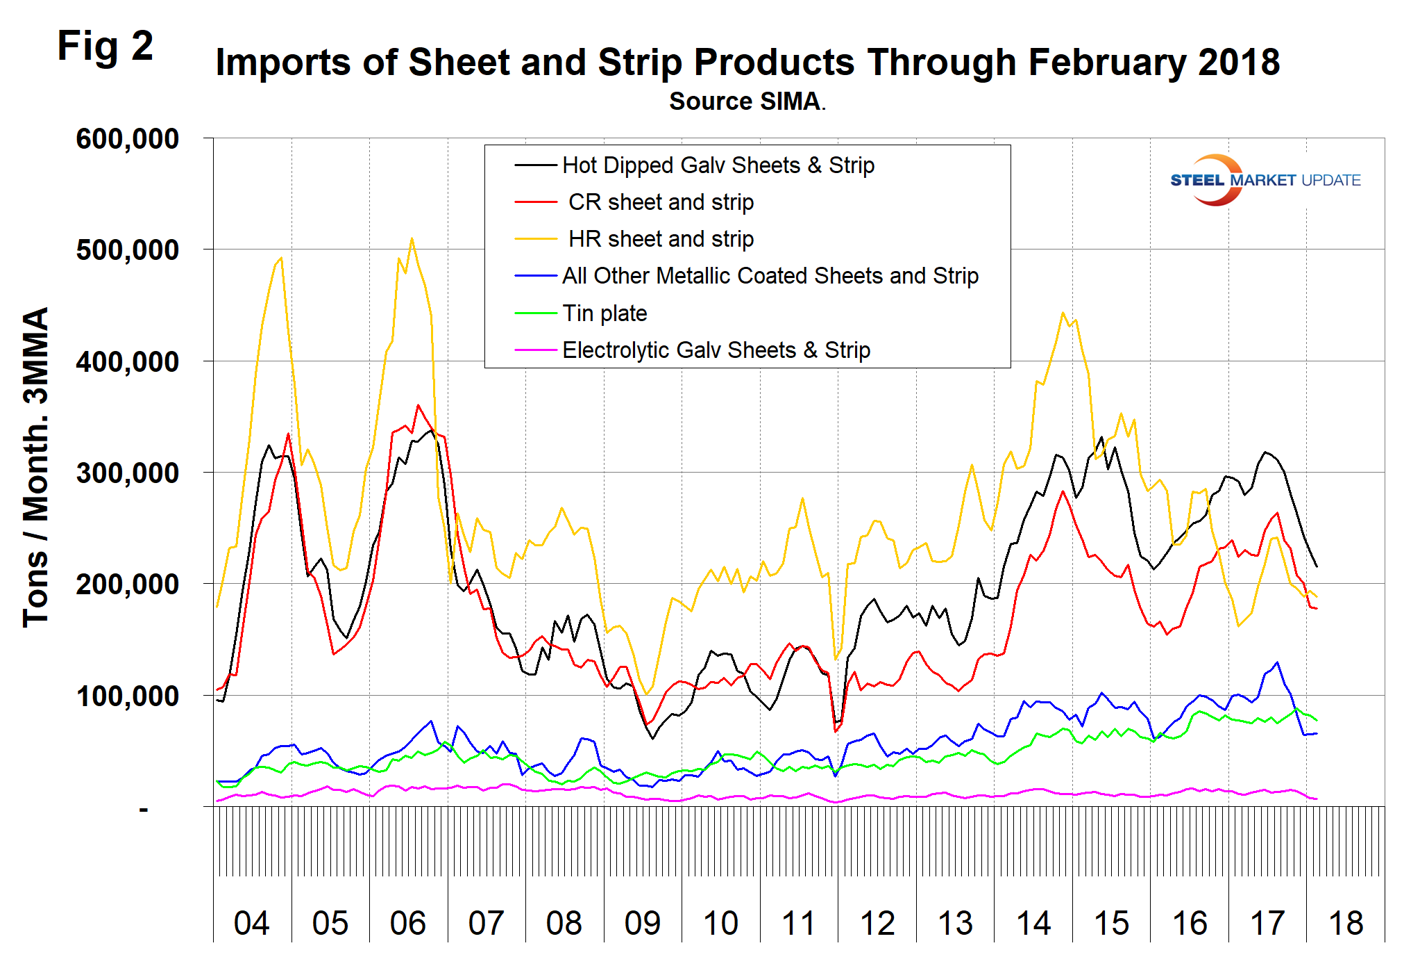
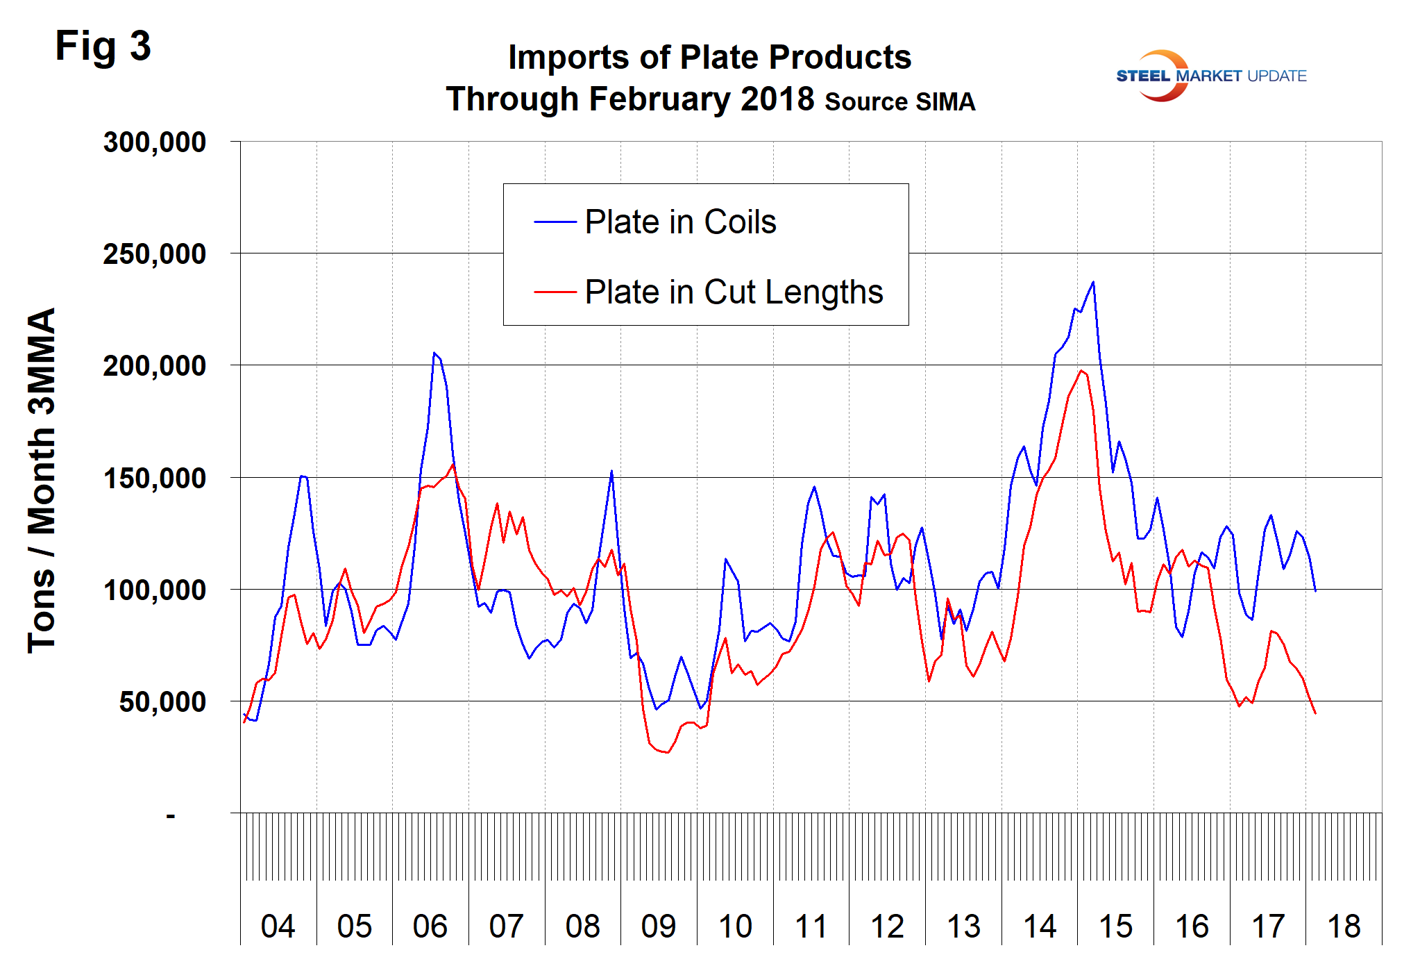
Table 2 shows the same analysis for long products where year-over-year total imports through February were down by 24.6 percent, but the decline is slowing. Rebar has had the most dramatic decrease, down 63.7 percent year over year. Figure 4 shows the history of long product imports.
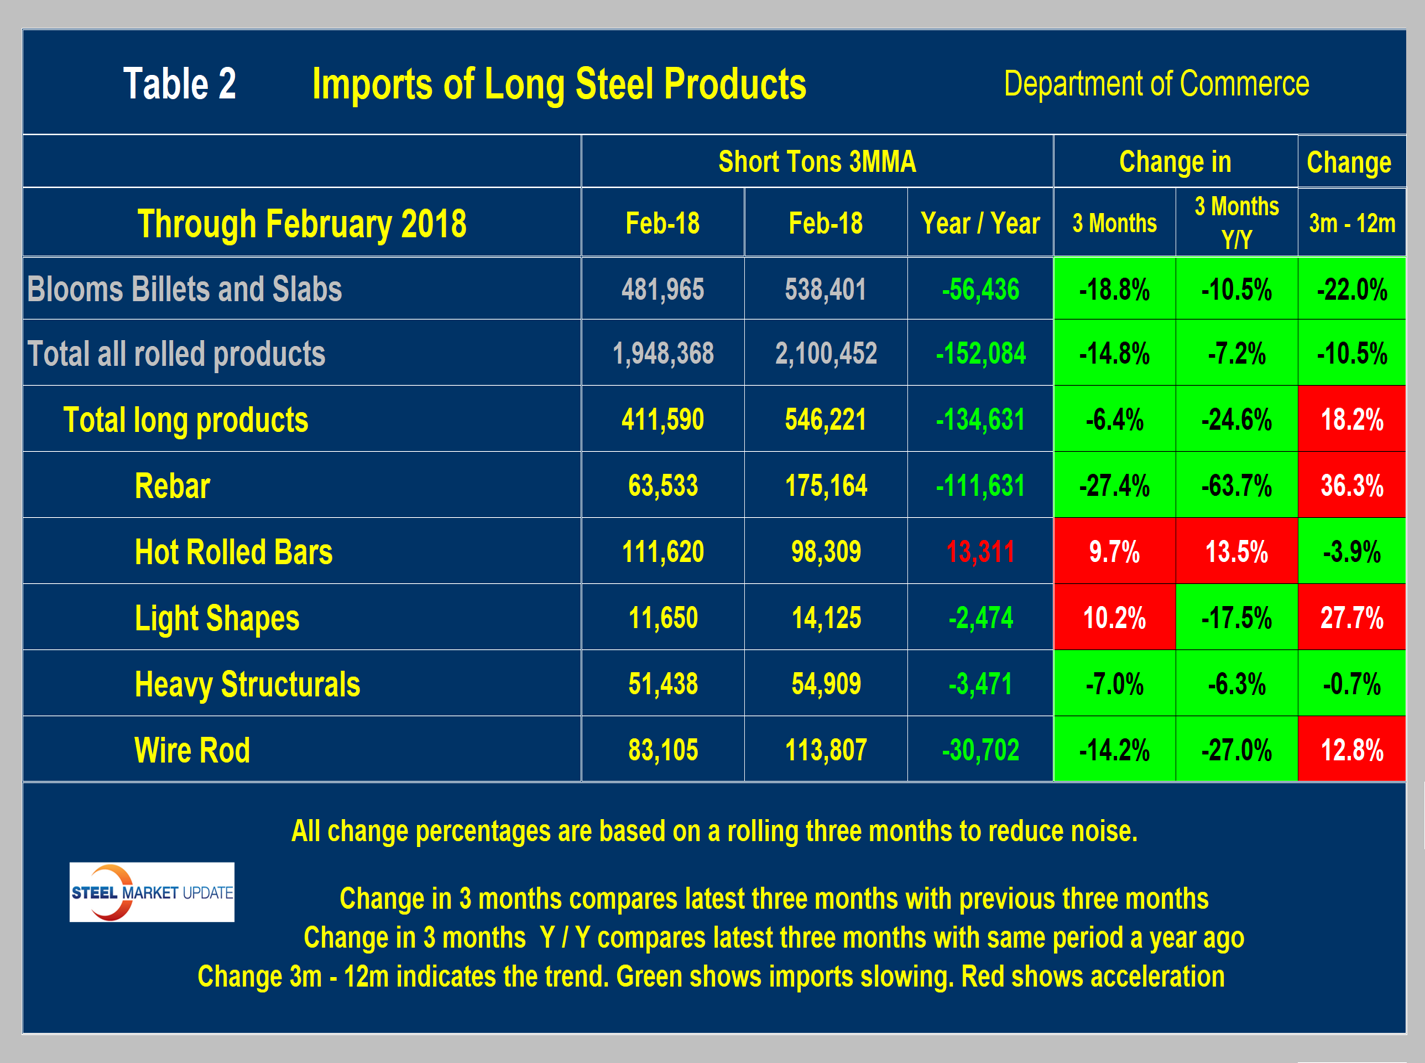
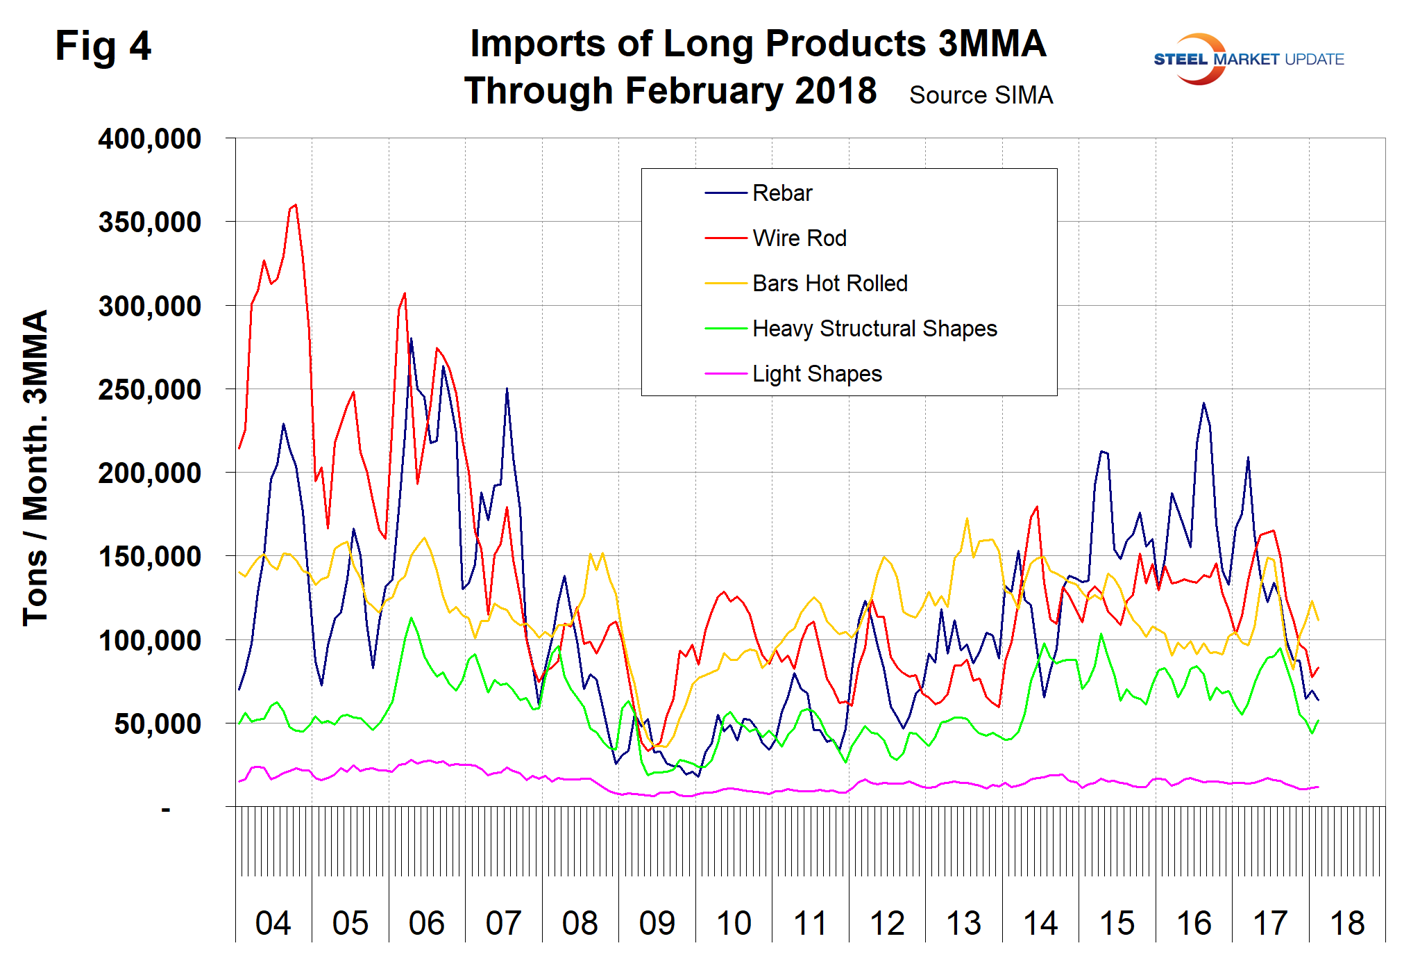
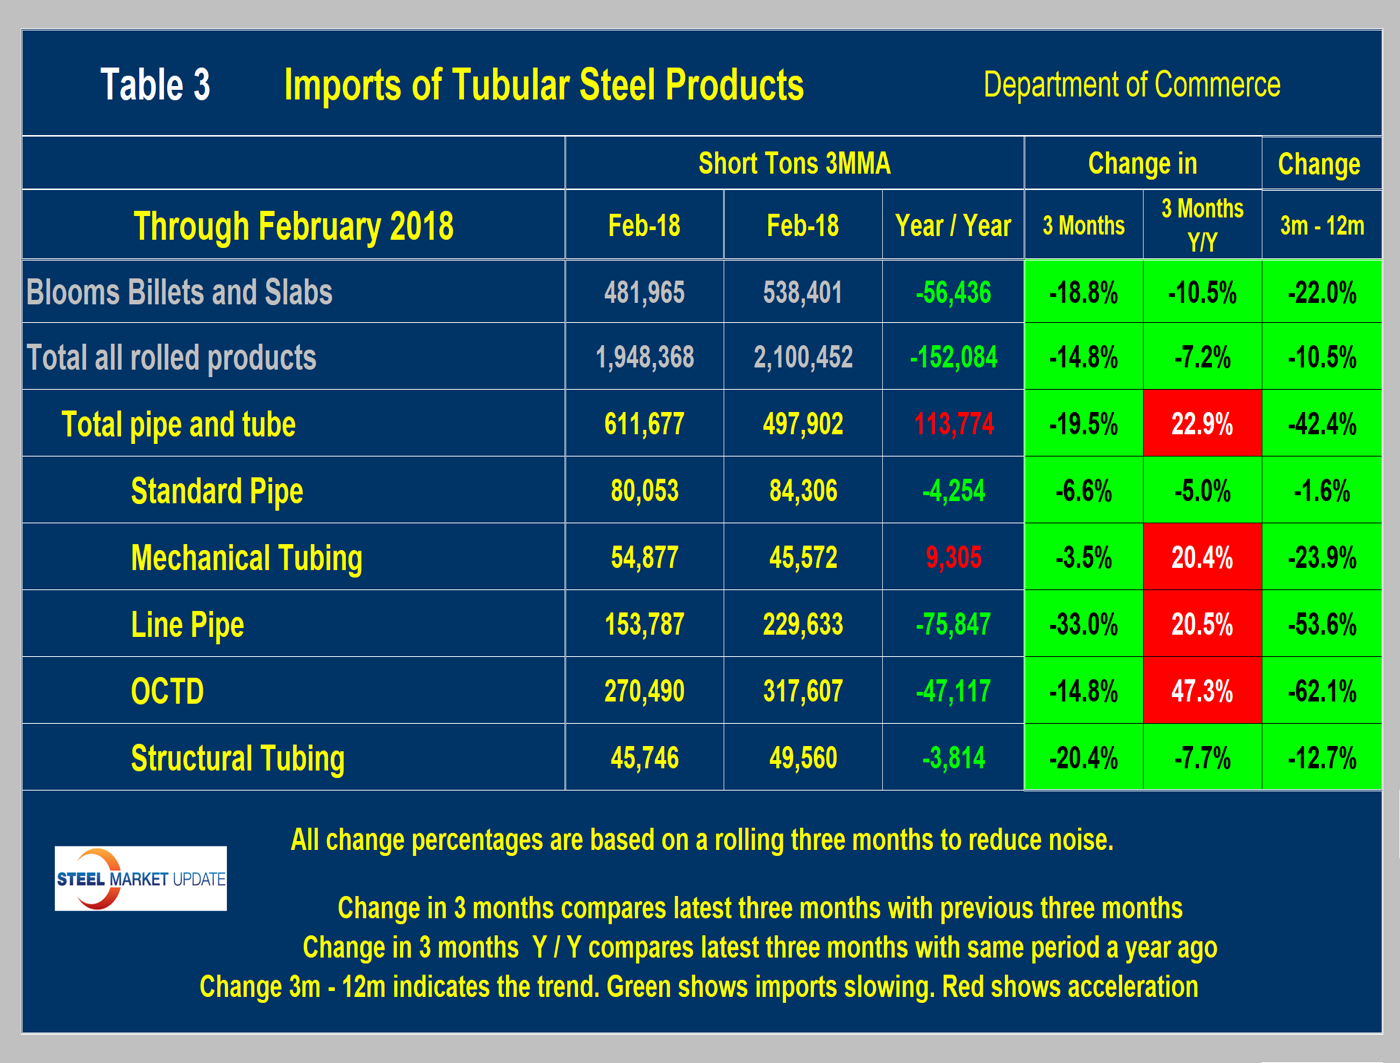
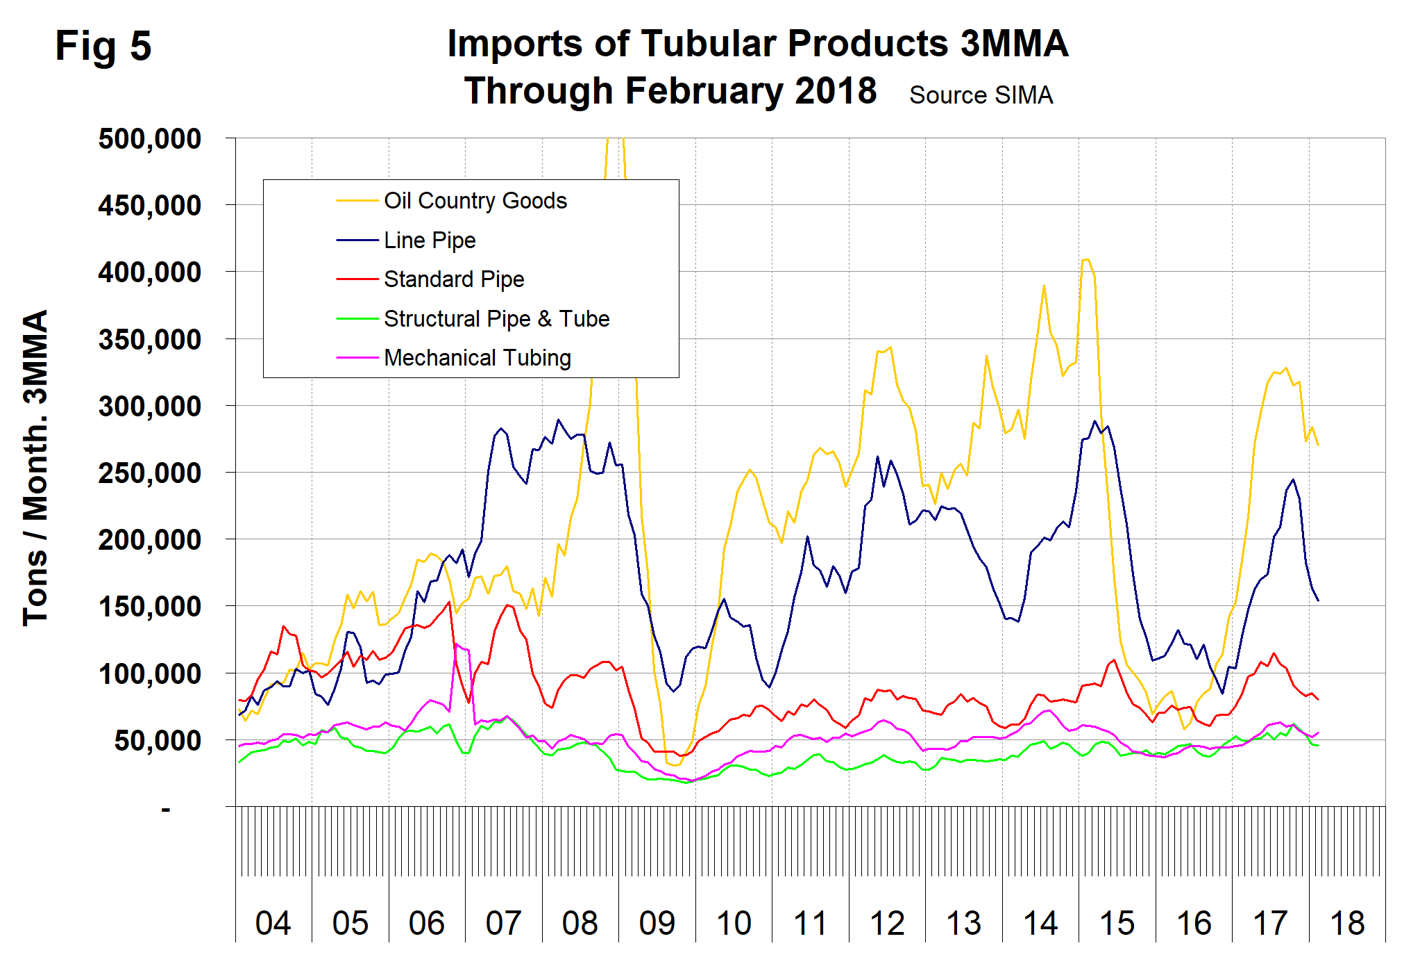
Table 3 shows that for tubular products the year-over-year volume was up by 22.9 percent, but there has been a dramatic decline in recent months. In the last three months, total tubular products were down by 19.5 percent and every tube sector had a 3M/3M decrease. Year over year, mechanical tubing, line pipe and OCTG all had an increase greater than 20 percent. Figure 5 shows the history of tubular imports since 2004.
Explanation: SMU publishes several import reports ranging from this very early look using license data to the very detailed analysis of final volumes by product, by district of entry and by source nation, which is available in the premium member section of our website. The early look is based on three-month moving averages using the latest license data, either the preliminary or final data for the previous month and final data for earlier months. We recognize that the license data is subject to revisions but believe that by combining it with earlier months in this way gives a reasonably accurate assessment of volume trends by product as early as possible. The main issue with the license data is that the month in which the tonnage arrives is not always the same month in which the license was recorded. In 2014, we conducted a 12-month analysis to evaluate the accuracy of the license data compared to final receipts. This analysis showed that the licensed tonnage of all carbon and low alloy products was 2.3 percent less than actual receipts, close enough to confidently include license data in this current update. The discrepancy declined continuously during the 12-month evaluation as a longer period was considered.
Statement from the Department of Commerce: The Steel Import Monitoring and Analysis (SIMA) system of the Department of Commerce collects and publishes data of steel mill product imports. By design, this information gives stakeholders valuable information on steel trade with the United States. This is achieved through two tools: the steel licensing program and the steel import monitor. All steel mill imports into the United States require a license issued by the SIMA office. The SIMA Licensing System is an online system for importers to register, apply for and receive licenses in a timely manner. In addition to managing the licensing system, SIMA publishes near-real-time aggregate data on steel mill imports into the United States. These data incorporate information collected from steel license applications and publicly released Census data. The data are displayed in tables and graphs for users to analyze. Additionally, SIMA provides data on U.S. steel mill exports, as well as imports and exports of select downstream steel products.


