Market Data

March 12, 2018
SMU Market Trends: Is Demand Easing?
Written by Tim Triplett
Is steel demand showing signs of weakening? The year got off to a strong start, but changes in the last three Steel Market Update queries hint at a subtle change in steel buyers’ attitudes.
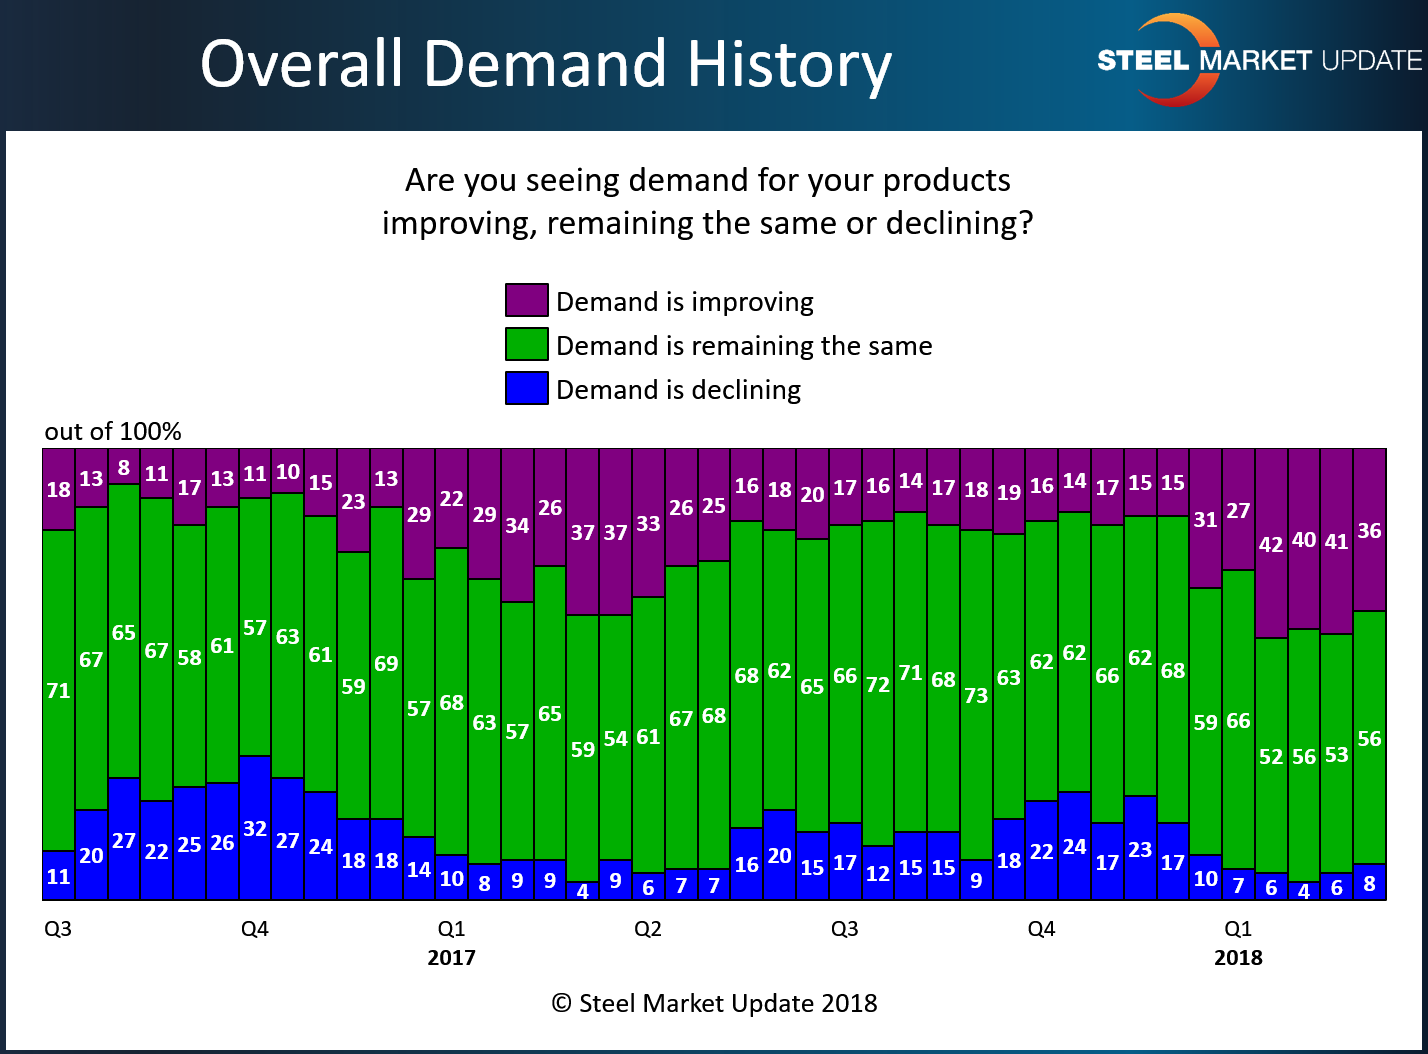
A bit over half of the respondents to the last three SMU market trends questionnaires reported demand staying about the same through February and into March. While the majority view was of stable demand, a diminishing percentage reported demand improving. Forty-two percent reported improving demand for their products in the Feb. 19 questionnaire, but only 26 percent in the March 5 questionnaire. The percentage reporting declining demand increased from 4 percent on Feb. 5 to 6 percent on Feb. 19 to 8 percent on March 5.
Comments from respondents last week had a more bearish tone:
• “Well, demand WAS improving, now we are afraid to quote.”
• “Automotive build schedules are slumping.”
• “More and more manufacturing is being offshored and it will continue to move in that direction.”
• “Panic gives the appearance demand is rising.”
• “I think demand is steady, yet people are on allocation on the West Coast, with Section 232 limiting what can be done import-wise.”
• “People are buying ahead of what they feel will be a time of rapid price increases. Mills may be in for a surprise as many people stocked up in fourth-quarter 2017 and first-quarter 2018. Mill second-quarter bookings may get pretty lean!”
Demand, as economists note, has an inverse relationship with price. The higher the price, the less people tend to buy. With hot rolled steel prices around $850 per ton and climbing, and steel consumers worried about the effects of the Section 232 tariffs, the demand outlook may not be as bullish in the second quarter.