Prices

March 22, 2018
HRC Futures Quiet; Iron Ore Futures Approaching Support
Written by David Feldstein
The following article on the hot rolled coil (HRC) futures market was written by David Feldstein. As the Flack Global Metals Director of Risk Management, Dave is an active participant in the hot rolled futures market, and we believe he provides insightful commentary and trading ideas to our readers. Besides writing futures articles for Steel Market Update, Dave produces articles that our readers may find interesting under the heading “The Feldstein” on the Flack Global Metals website, www.FlackGlobalMetals.com. Note that Steel Market Update does not take any positions on HRC or scrap trading and any recommendations made by David Feldstein are his opinions and not those of SMU. We recommend that anyone interested in trading HRC or scrap futures enlist the help of a licensed broker or bank.
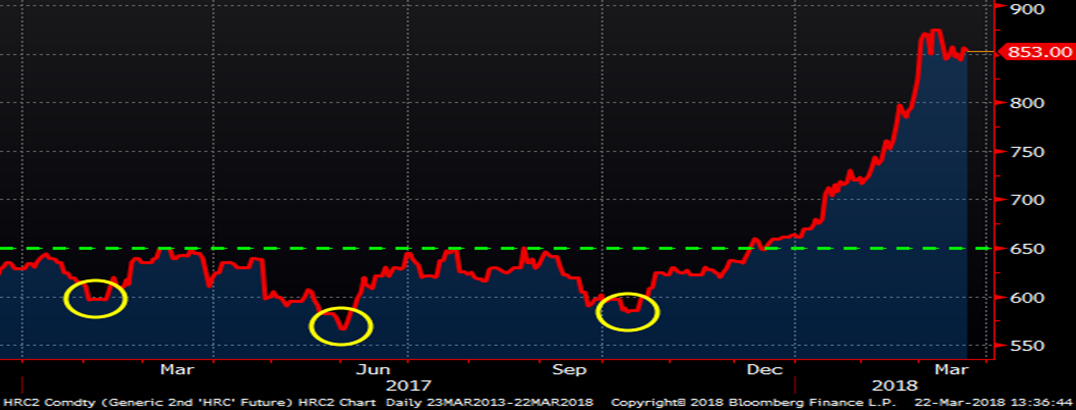
Domestic flat rolled and CME Midwest HRC futures prices are in a world of their own driven by a steel shortage and uncertainties surrounding the administration’s developing steel tariffs. Outside of this bubble (double meaning), the rest of the world is functioning with ferrous raw material prices under pressure. Iron ore continues to trade lower and has pulled scrap pricing down with it.
Since last week, volatility in the CME Midwest HRC futures has ground to a halt with trading volume down sharply.
Rolling 2nd Month CME Midwest HRC Futures
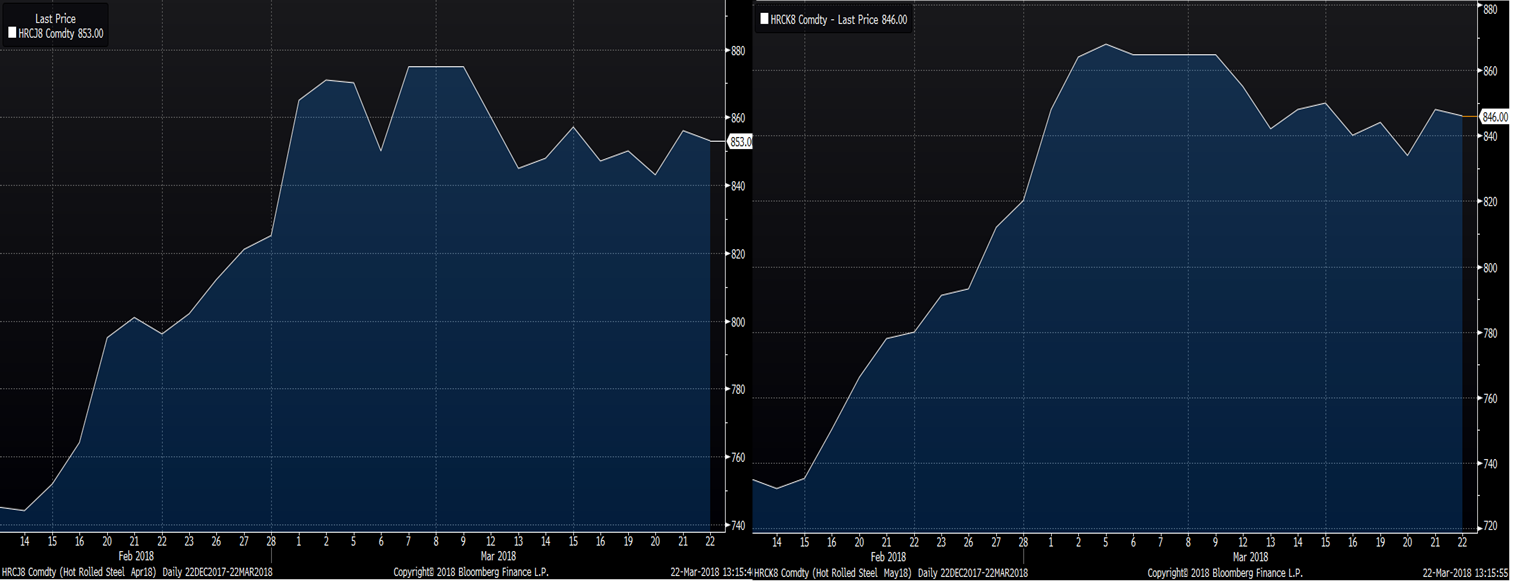
The April future has settled into a range between $845 and $855. The May future has settled into a range between $835 and $845.
April (left) and May (right) CME Midwest HRC Future
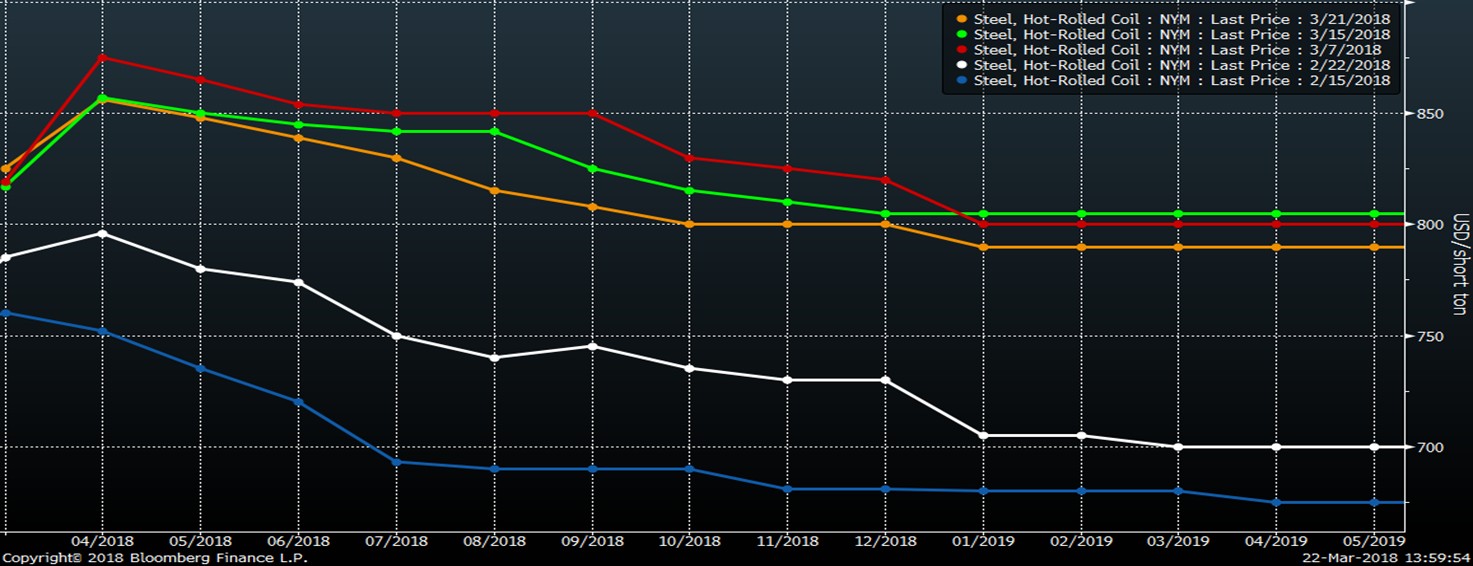
There has been little change in the front of the curve, but the curve has moved $10-$15 lower in Q3 2018 through Q1 2019. Little trading has occurred in Q1 2019 with open interest at a mere 680 short tons per month.
CME Midwest HRC Future Curve
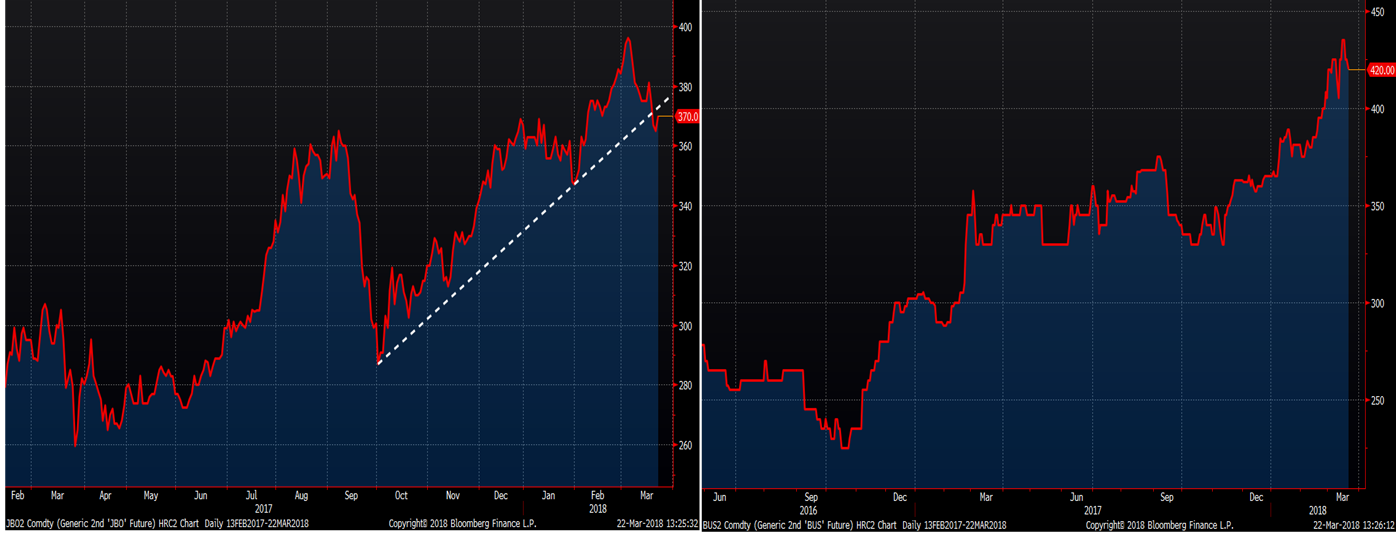
LME Turkish scrap futures have been under pressure with April and May futures falling $20 – $25 from their highs reached two weeks ago. Also, the rolling 2nd month future broke below its uptrend line. The April CME #1 busheling future has retreated $15 off its high of $435 reached last Thursday. However, the 2nd month #1 busheling future has maintained its up trendline.
LME Turkish Scrap (left) & CME #1 Busheling (right) 2nd Month Rolling Future
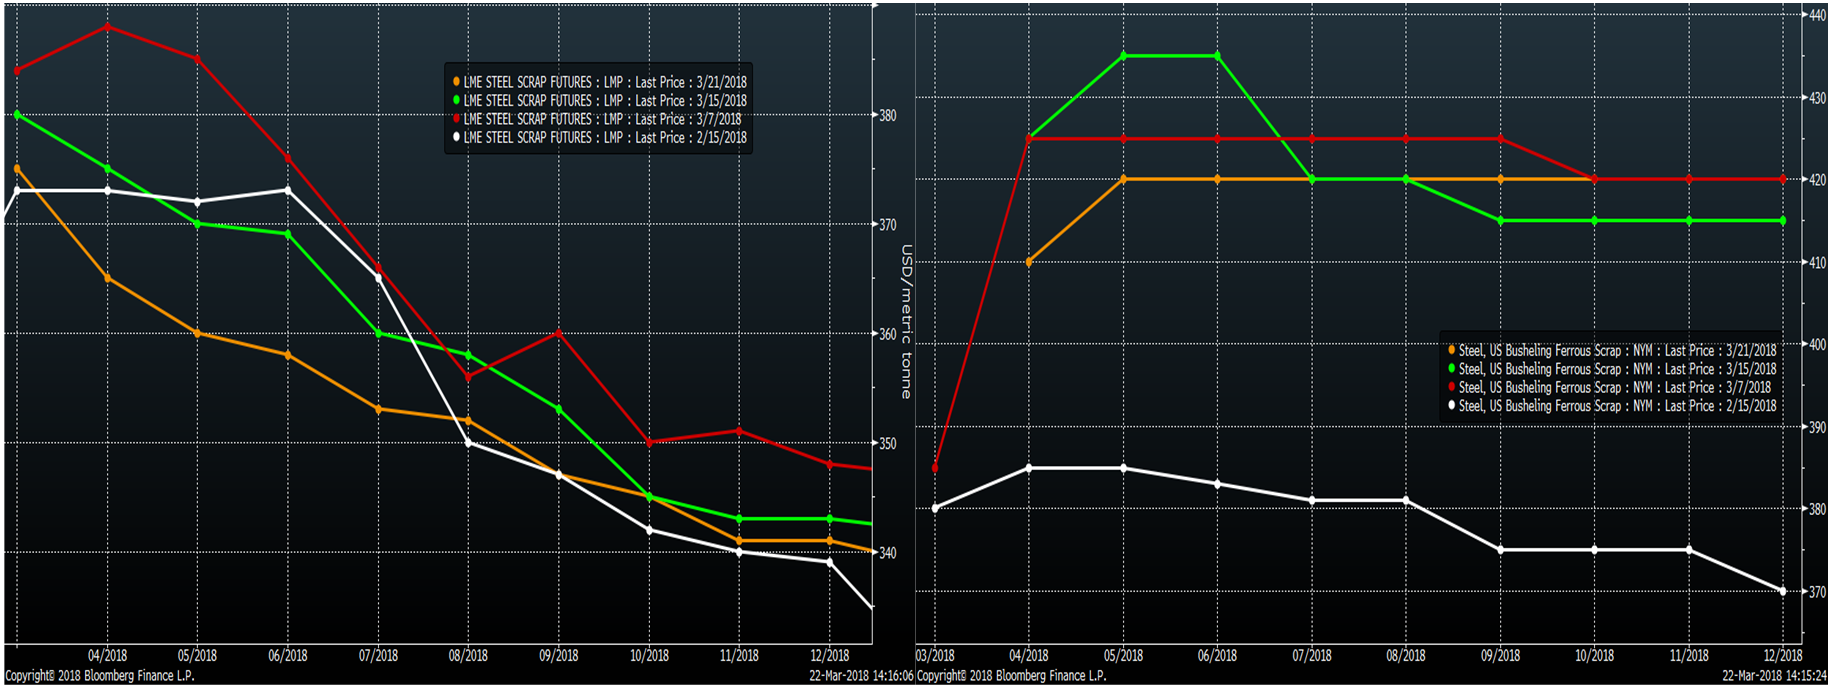
The scrap curves below are interesting as the Turkish scrap curve is sharply backwardated similar to the iron ore curve, while the #1 busheling curve is flat, closer to that of the CME Midwest HRC futures curve. Also, the busheling curve jumped $50 following the administration’s tariff announcement, while the announcement had little to no effect on the Turkish scrap market.
LME Turkish Scrap (left) & CME #1 Busheling (right) Futures Curves
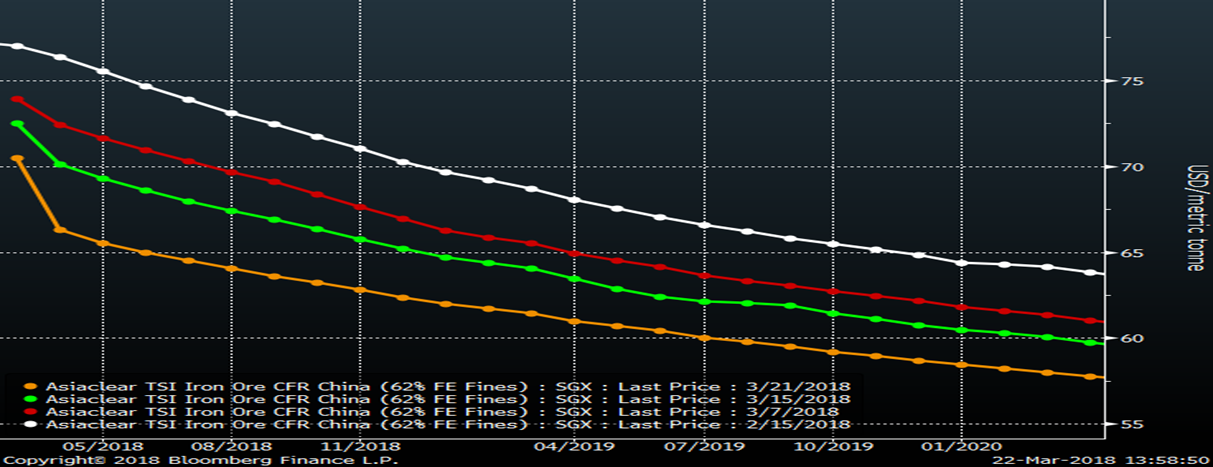
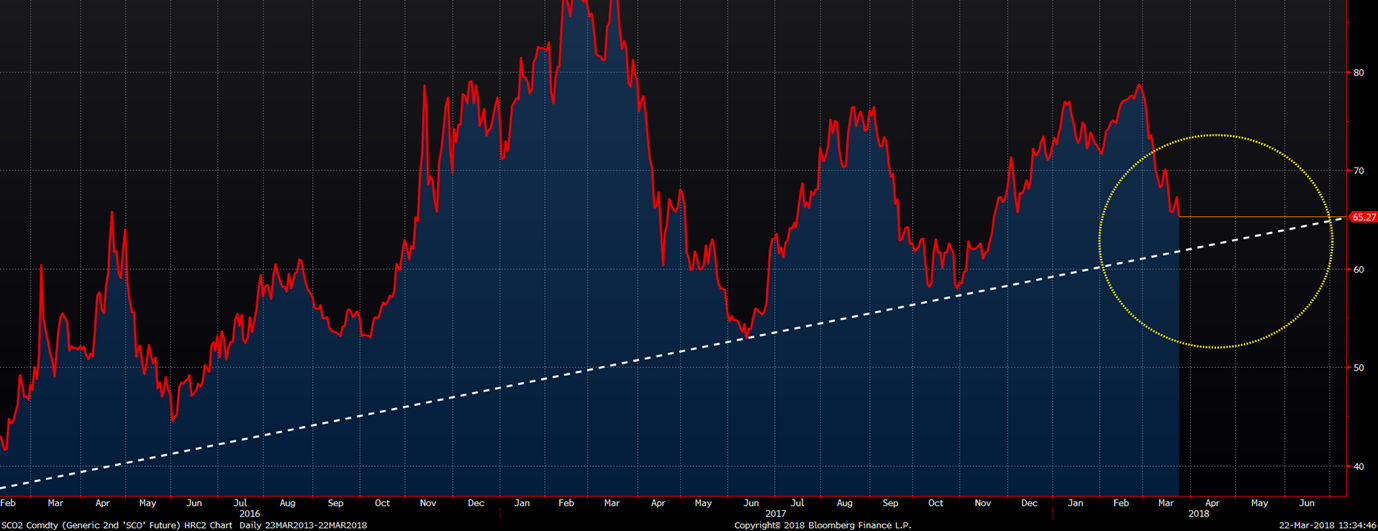
Iron ore futures continue to trade lower week after week. The May future has fallen 16 percent, settling today at $65.27 after reaching a short-term high of $77.86 on Feb. 26.
SGX Iron Ore Future Curve
After failing to break above its long-term downtrend, 2nd month iron ore continues to trade lower and is now approaching its multi-year uptrend line.
SGX 2nd Month Iron Ore Future
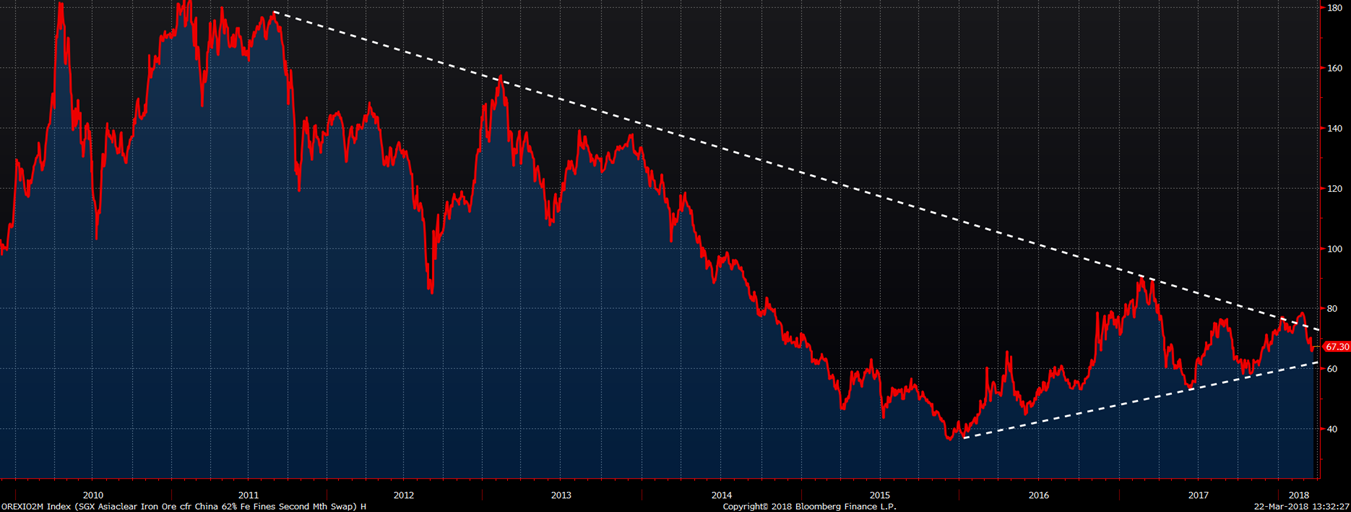
Taking a closer look at the chart, April iron ore looks to be approaching an important price point at $62.50. If prices hold above $62.50 and trade higher, the next step would be to look for prices to trade back up to the long-term down trendline and to trade above the highs seen in late February. However, if ore breaks below the $62.50 level, look out below.
SGX 2nd Month Iron Ore Future
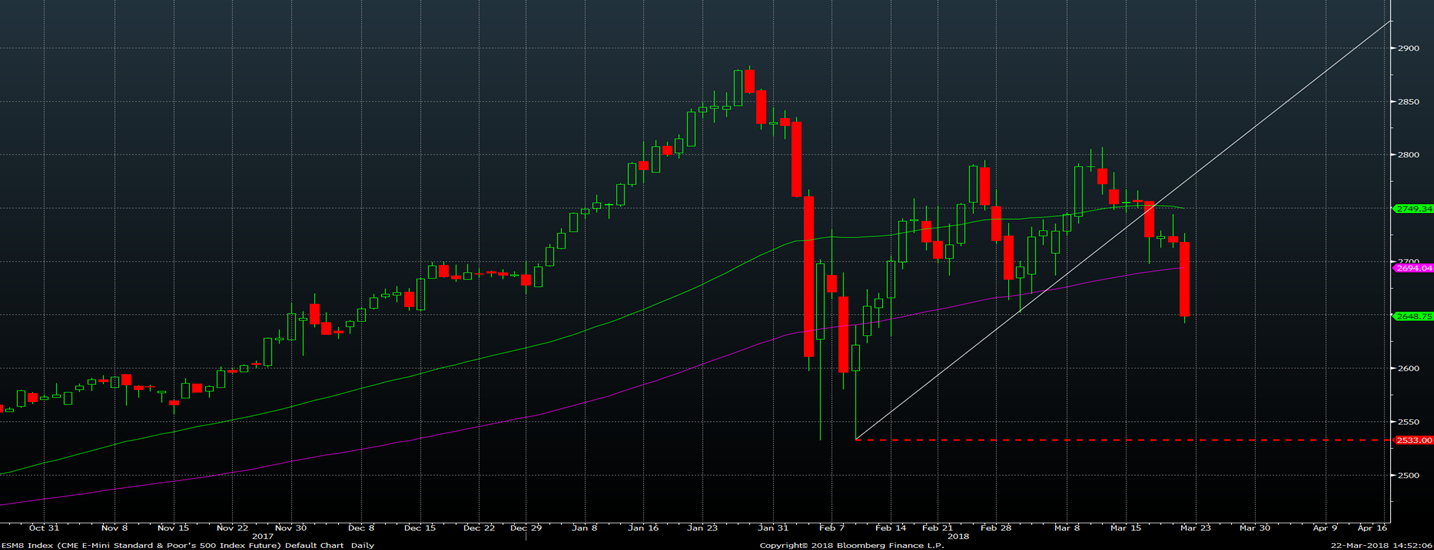
The S&P 500 has gained 325 percent, pretty much unfettered, since the financial crisis lows in March 2009. It has gained 28 percent since March 22, 2016, as of today’s close. Those are pretty remarkable gains.
S&P 500 Future
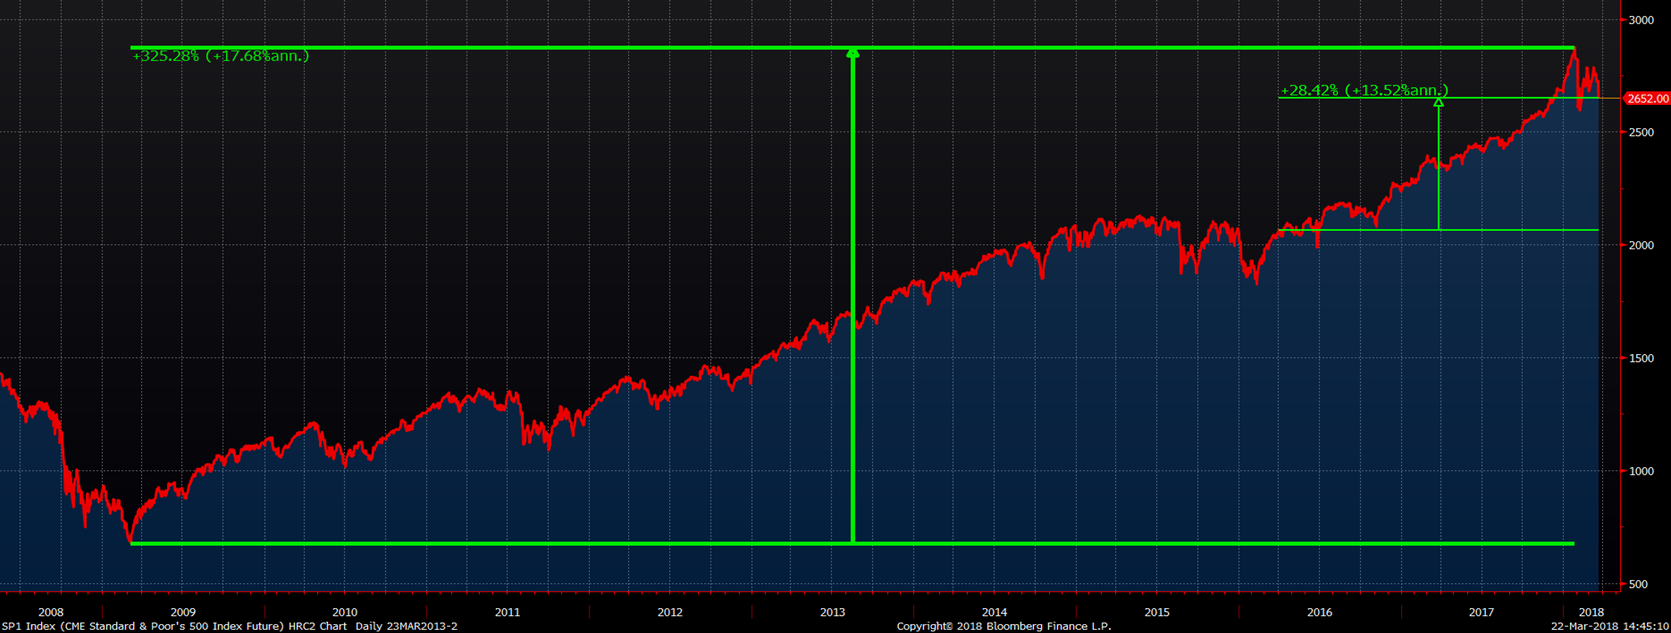
Historically, the S&P 500 underperforms during Federal Reserve monetary tightening cycles. The chart below shows the all-time high set at 2880 on Jan. 26 and the subsequent correction. The rally that followed the correction produced an uptrend that has now been broken. If the S&P falls below the correction low at 2533, that will mean a new low has been made and is very concerning from a technical level as higher highs and higher lows are indicative of a rally/bull market, while lower highs and lower lows are indicative of a sell off/bear market. In the Week Over Week report published on Flack Global Metal’s website, a stock market crash is an event listed in the downside risks section; one that could curtail investment and demand, pressuring steel prices lower. So, now you also have to pay attention to the S&P 500.
S&P 500 June Future