

Market Data

April 23, 2018
China’s Economy, Steel Production Continue to Grow
Written by Peter Wright
Once each quarter, Steel Market Update publishes the official statistics for Chinese GDP, industrial production, consumer price inflation and fixed asset investment. Many analysts don’t believe these self-serving Party figures, but we include them in our reports because of the importance of China in the global steel scene, and these numbers are all that’s available. Economic statistics are never revised. Figure 1 shows published data released this week for the growth of GDP, industrial production and consumer prices through the first quarter of 2018. The GDP and industrial production portions of this graph are three-month moving averages.
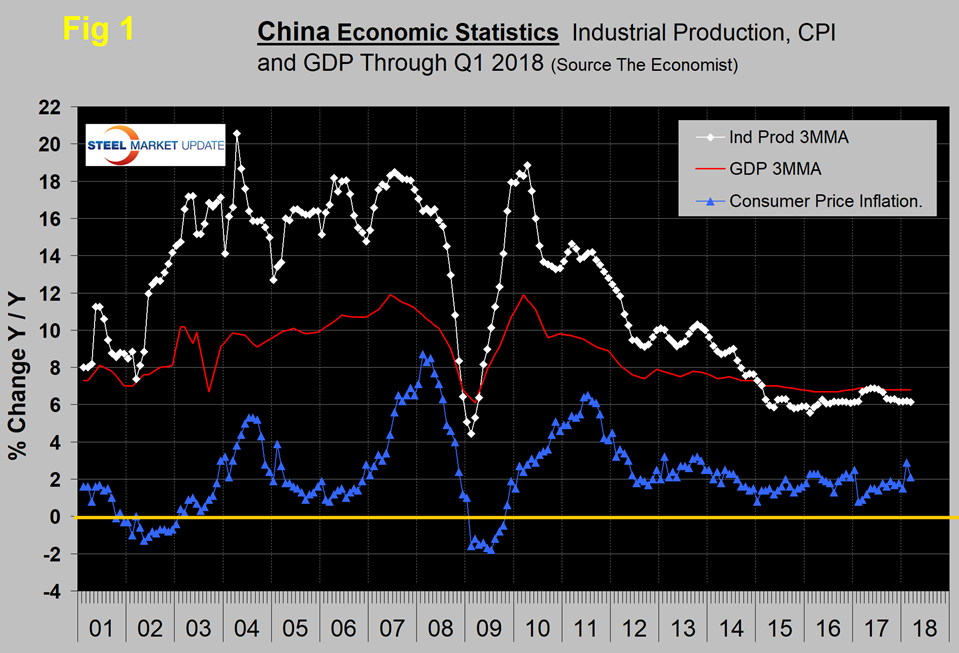
GDP grew at a rate of 6.8 percent in the first quarter, which was unchanged from Q3 and Q4 last year and very little changed for 11 quarters. Moody’s reported that President Xi Jinping gave a relatively upbeat assessment of the economy at the recent Boao Forum, and we expect China’s economy will maintain something close to its current pace of growth for the remainder of the year. Continued public investment, especially related to the One Belt One Road initiative, will make up for softness in residential and commercial real estate. The growing global economy, meanwhile, will keep the export sector busy.
The three-month moving average (3MMA) of the growth of industrial production rose from 6.1 percent in January 2017 to 6.9 percent in June before falling back to 6.1 percent in March 2018. Economy.com wrote: “China’s industrial production decelerated sharply after the Lunar New Year festivities in the January-February period. Industrial production slowed to 6 percent year over year in March on the back of declining mining output and slower manufacturing production. Low base effects from high mobile phone production last year have caused the sharper than anticipated slowdown in manufacturing. The tech cycle appears to be slowing, although production of electrical machinery and other electronic equipment remains upbeat, albeit lower than the previous year. Production of energy-efficient cars continues to boost headline production. Domestic-oriented production growth will likely outpace export-oriented production growth this year, especially if U.S. trade restrictions come to pass.”
Figure 2 shows the growth of fixed asset investment. In March, FAI grew at 7.5 percent year over year. Economy.com wrote: “Investment in fixed assets was up 7.5 percent year over year in the first three months of the year, driven by an 8.9 percent lift in private sector investment and a 7.1 percent rise in public investment. Investment in manufacturing stayed mild, while infrastructure investment continued to be robust. Although public-led infrastructure development is likely to continue underpinning investment growth, restrictions in the housing sector, overcapacity in heavy industry and President Xi’s focus on containing financial risks are likely to keep investment growth relatively restrained in 2018.
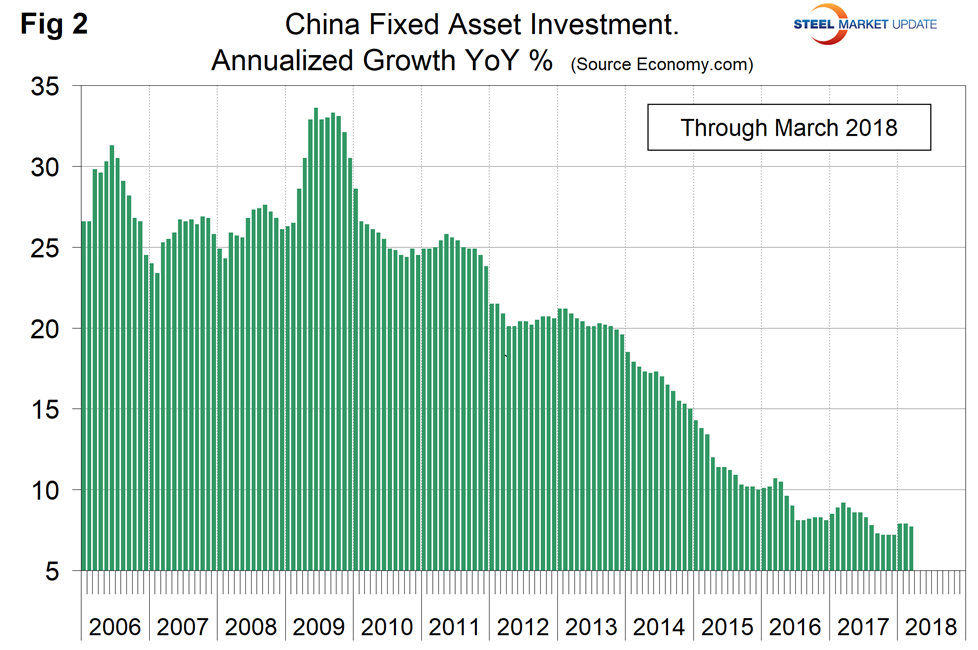
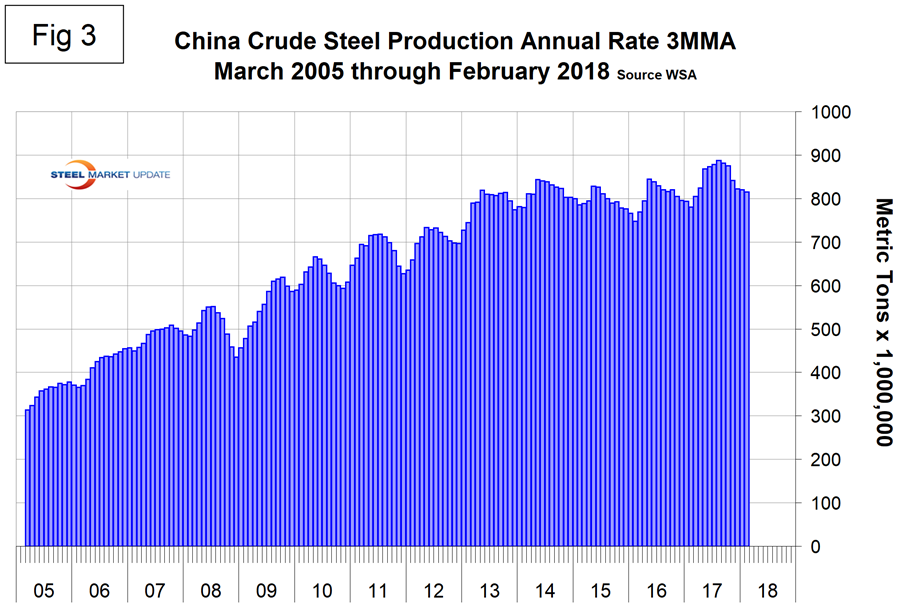
Figure 3 shows the 3MMA of China’s crude steel production through February when it accounted for 49.3 percent of global production. Figure 4 shows the year-over-year growth. After slowing for 13 straight months year over year, China’s production returned to positive growth each month from May 2016 through February 2018. The central government continues to report that cutting overcapacity is high on its reform agenda. Excess capacity in sectors such as steel and coal has weighed on the country’s overall economic performance. Cutting capacity is not the same thing as cutting production since excess capacity is so high.
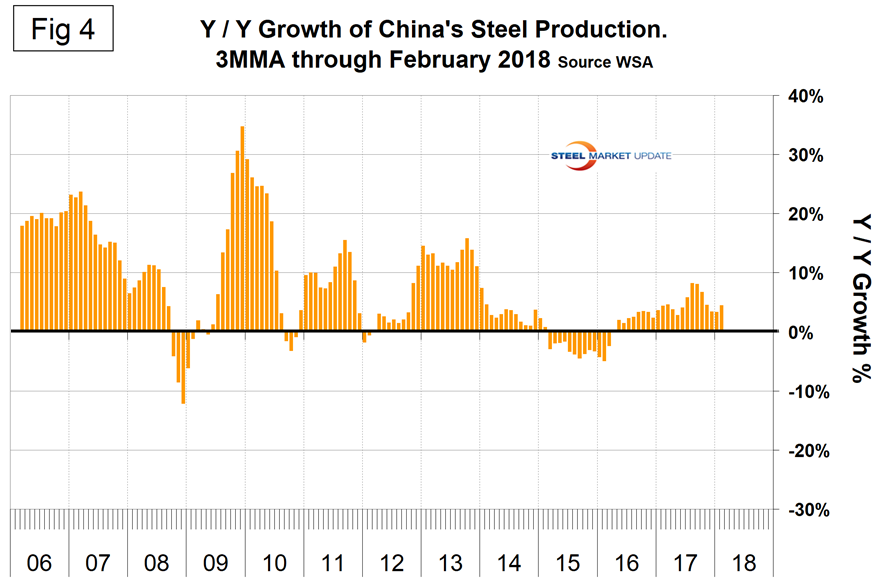
SMU Comment: China’s steel production has continued to grow year over year, contradicting all the optimism about reductions. Capacity utilization is so low that it’s not a problem to cut capacity in polluted locations and to simultaneously increase production overall. In three months through February, the growth rate of China’s steel production exceeded that of the rest of the world.


