

Distributors/Service Centers

April 23, 2018
MSCI: March Shipments Below Seasonal Norm
Written by Peter Wright
Metals Service Center Institute data shows that service center shipments in March were slightly less than the seasonal norm. Daily shipments in March were down by 0.8 percent from the February result. On average since 2009, March shipments have increased by 0.3 percent; therefore, these latest numbers were seasonally slightly worse than the historical average for this time of year. Total carbon steel shipments were 155,400 tons per day in March and days on hand as of the 31st were 47.1, which was up from 46.5 at the end of February.
Intake and Shipments
In March, total carbon steel intake at 157,180 tons per day was up from 156,950 tons in February and was 1,800 tons more than shipments. This was the fourth month of surplus after two months of deficit. Total sheet products had an intake surplus of 1,300 tons.
Total daily carbon steel shipments decreased from 156,600 tons in February to 155,400 tons in March. MSCI data has some seasonality, therefore we need to review that effect before commenting in detail on an individual month’s result. Figure 1 demonstrates this seasonality and why comparing a month’s performance with the previous month can be misleading, particularly in July and the fourth quarter of the year. On average, daily shipments decline slightly in each of the first four months of the year and bounce up in May to the highest level of any month. In the commentary below, we report year-over-year changes to eliminate seasonality and provide an undistorted view of market direction.
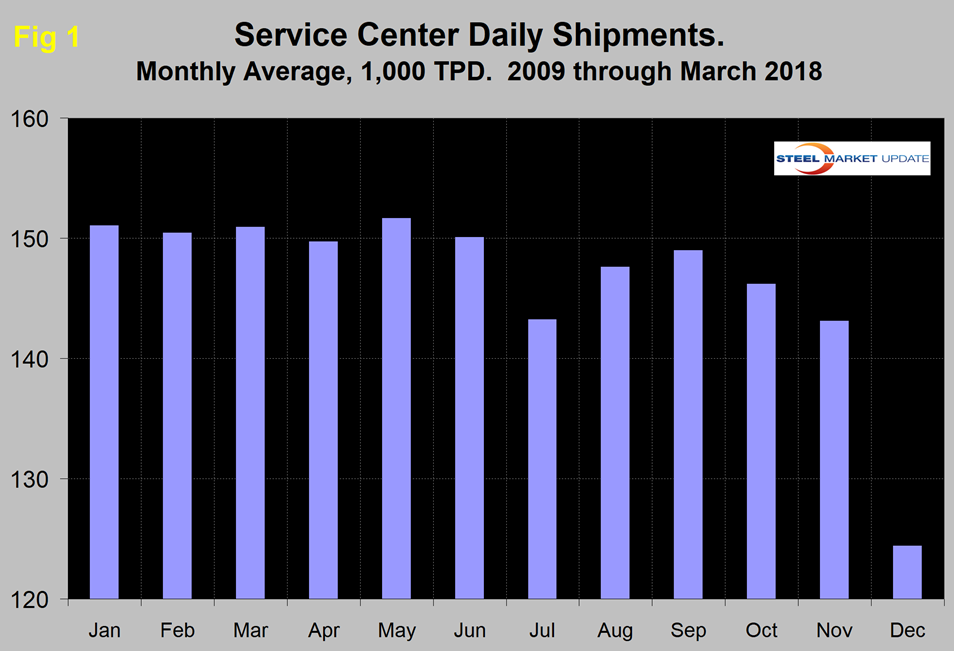
Table 1 shows the performance by product in March compared to the same month last year along with the average daily shipments for this and the two previous months of March. We then calculate the percent change between March 2018 and March 2017 and compare it with the most recent three-year March average. March this year was up by 2.6 percent from March 2017 and up by 4.8 percent from the three-year March average. The fact that the year-over-year growth comparison is lower than the three-year comparison suggests that momentum is negative.
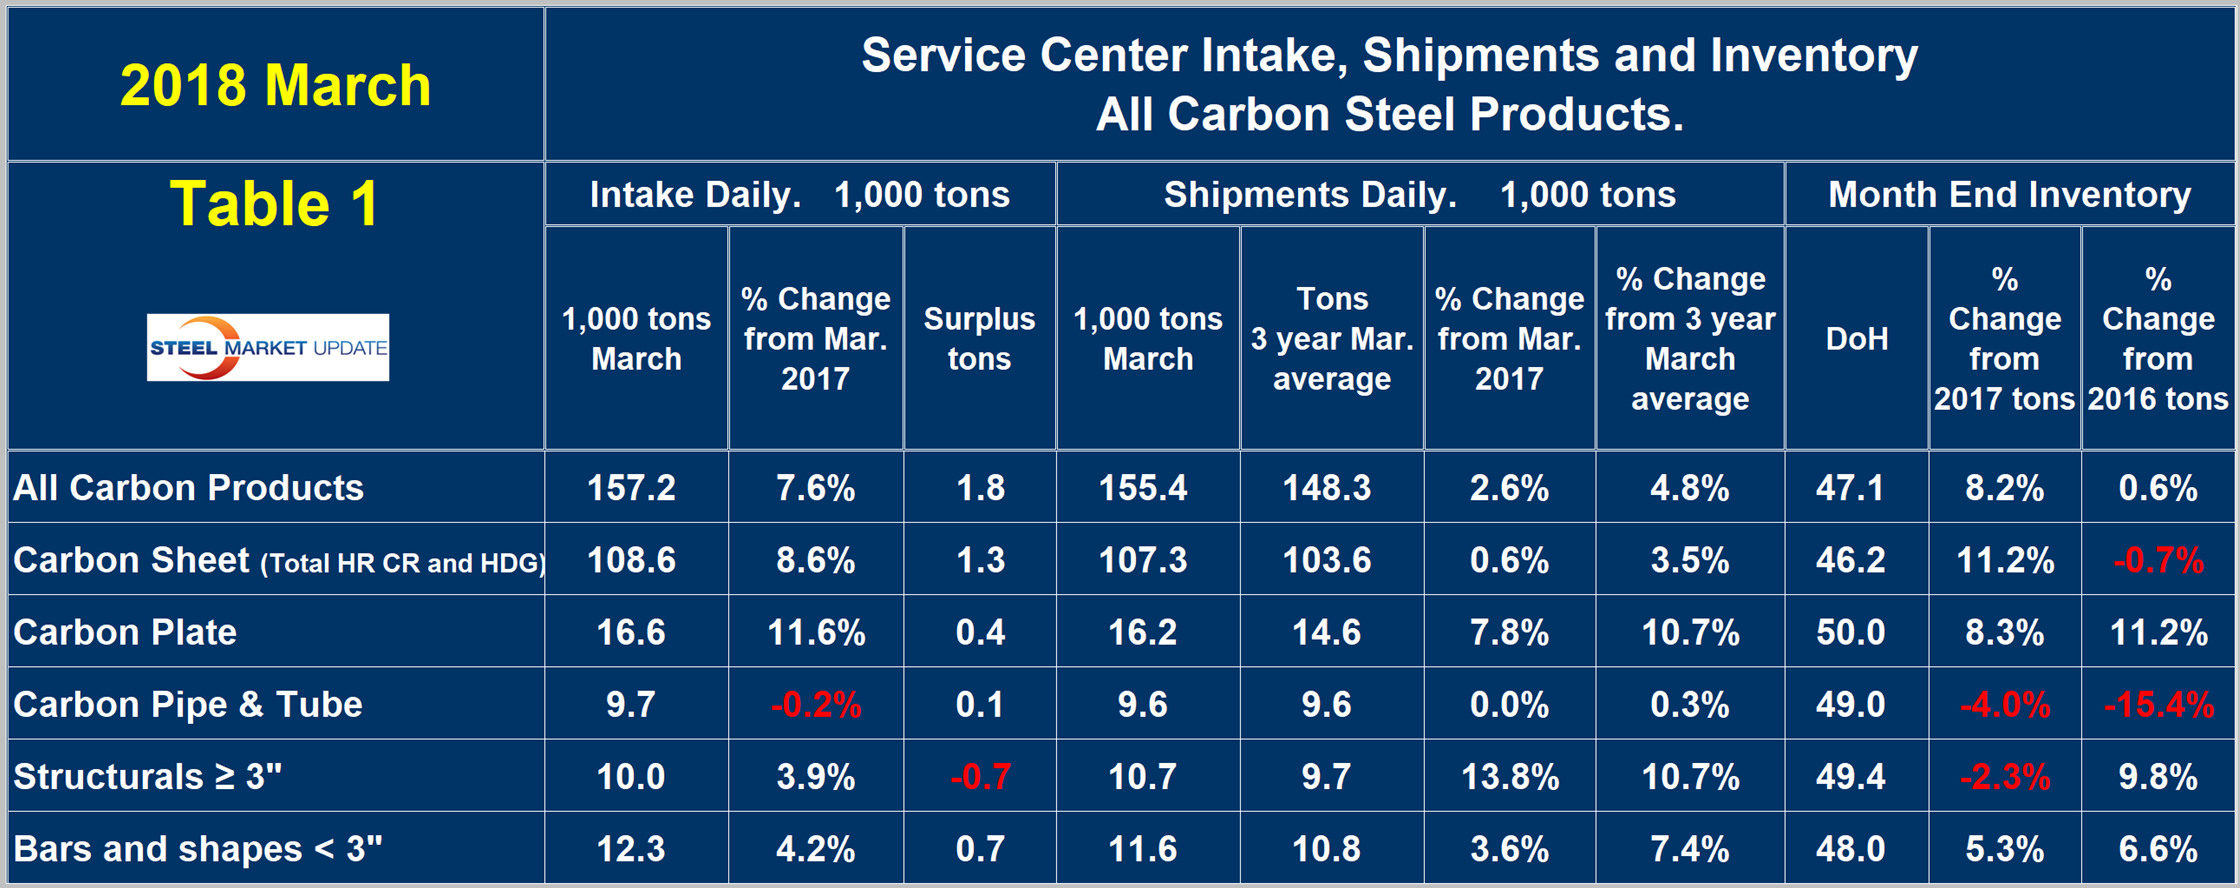
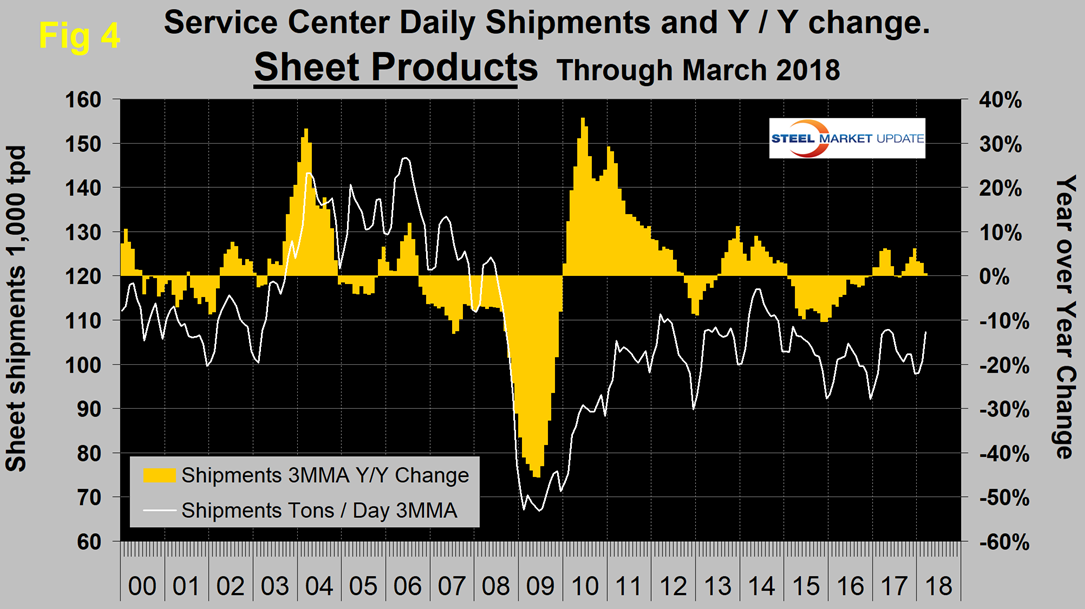
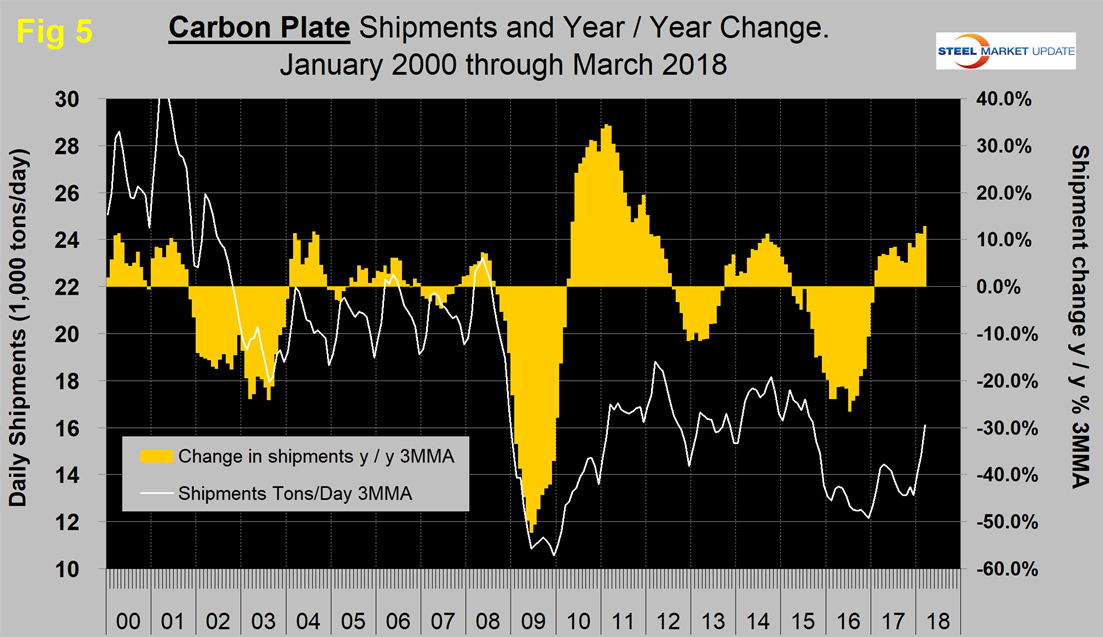
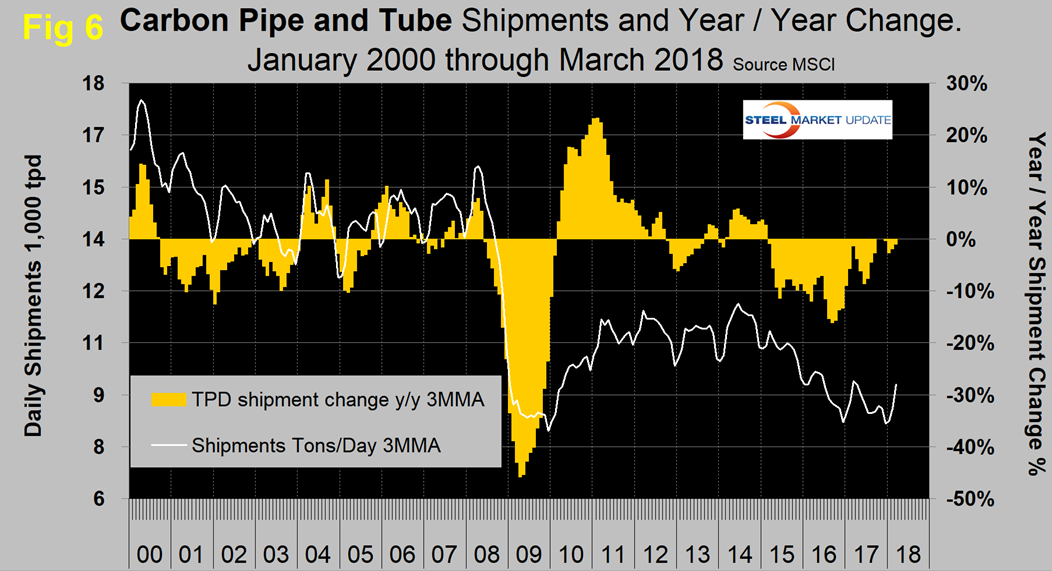
Shipments of all individual products except pipe and tube were up from March last year. Figure 2 shows the long-term trend of daily carbon steel shipments since 2000 as three-month moving averages (3MMA). The quickest way to size up the market is the brown bars in Figures 2-6, which show the percentage year-over-year change in shipments by product.
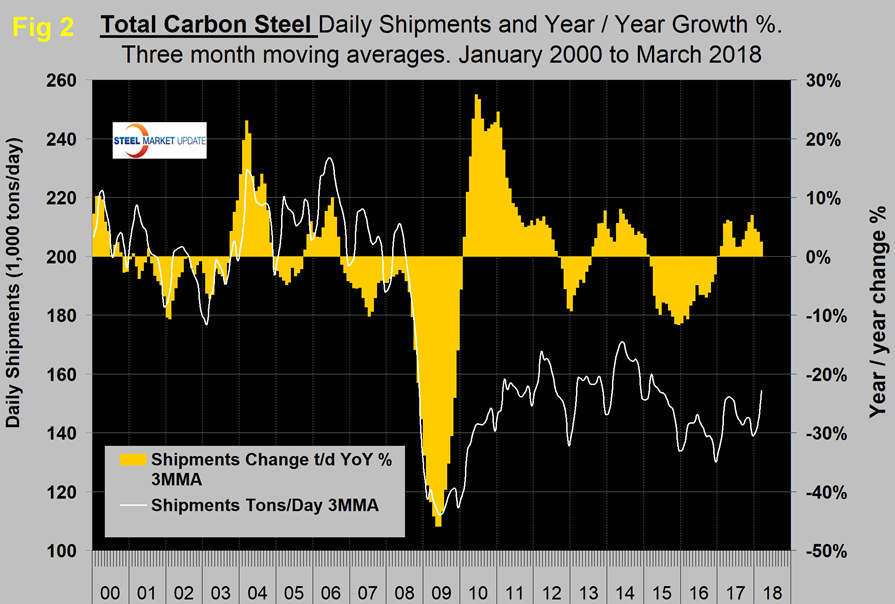
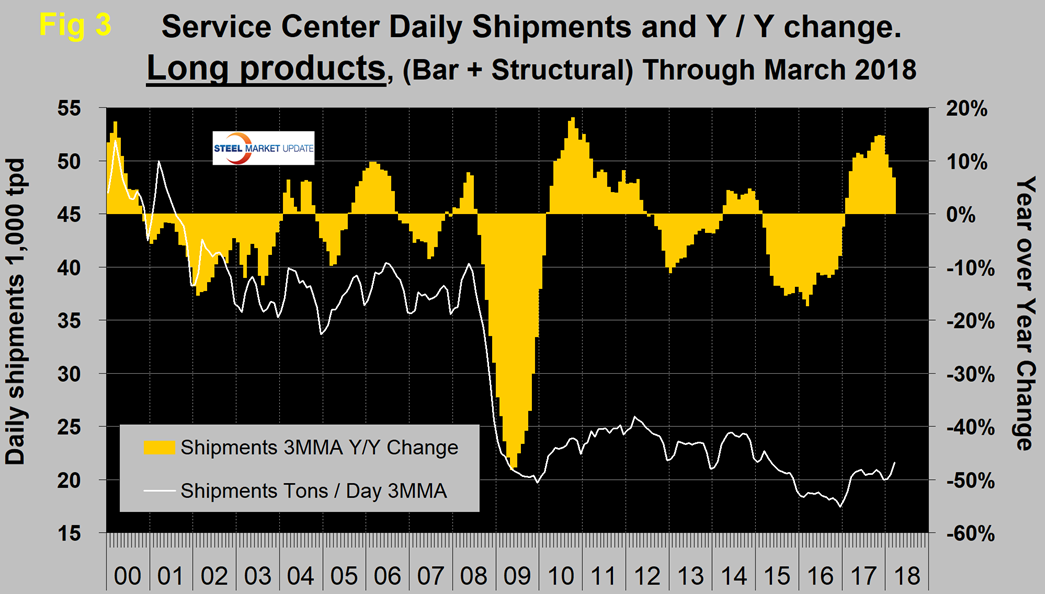
Figure 3 shows monthly long product shipments from service centers as a 3MMA with year-over-year change. Growth has been strong since February last year and in positive double digits every month from April last year through January this year. In February, growth was 8.7 percent and slowed to 6.8 percent in March.
Figures 4, 5 and 6 show the 3MMA of daily shipments and the year-over-year growth for sheet, plate and tubular goods, respectively. Plate performed much worse than sheet in 2015 and 2016. In 2017 and 2018, plate has begun to close the gap. Pipe and tube have performed poorly since early 2015, which coincided with the decline in rig count. The rig count has doubled from where it was this time last year, but so far this has not translated into year-over-year shipment growth of pipe and tube from service centers.
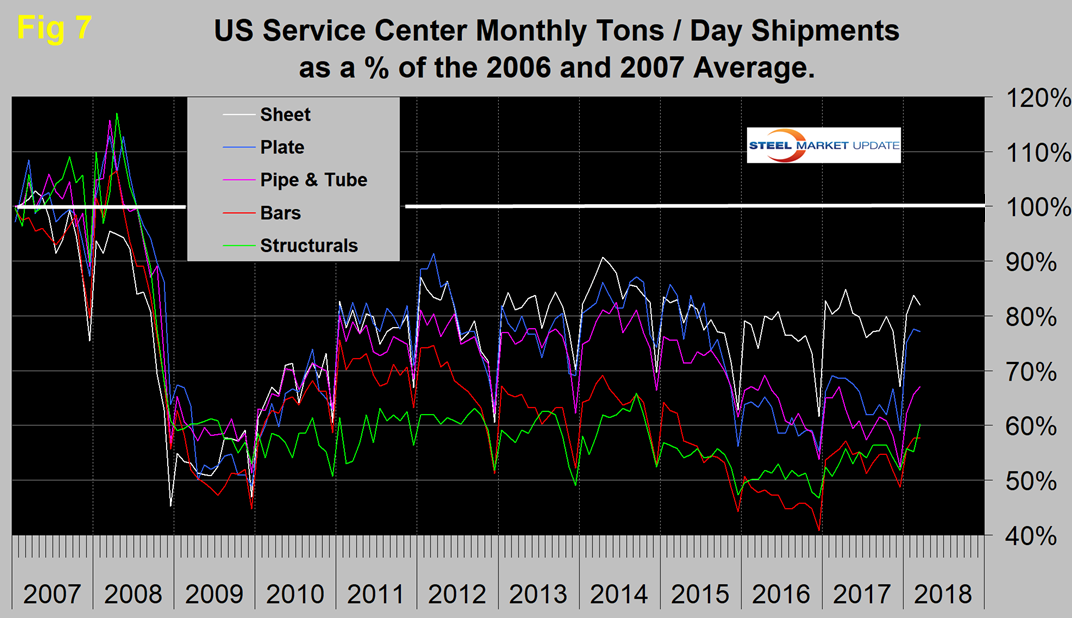
In 2006 and 2007, the mills and service centers were operating at maximum capacity. Figure 7 takes the monthly shipments by product and indexes them to the average for 2006 and 2007 to measure the extent to which shipments of each product have recovered. Each year, all products experience the December collapse and January pickup. In March, the total of carbon steel products was 73.2 percent of the average monthly shipping rate that occurred in 2006 and 2007. Structurals were 60.3 percent and bar was 57.7 percent. Sheet was at 82.0 percent, plate at 77.1 percent and tubulars at 67.1 percent.
Inventories
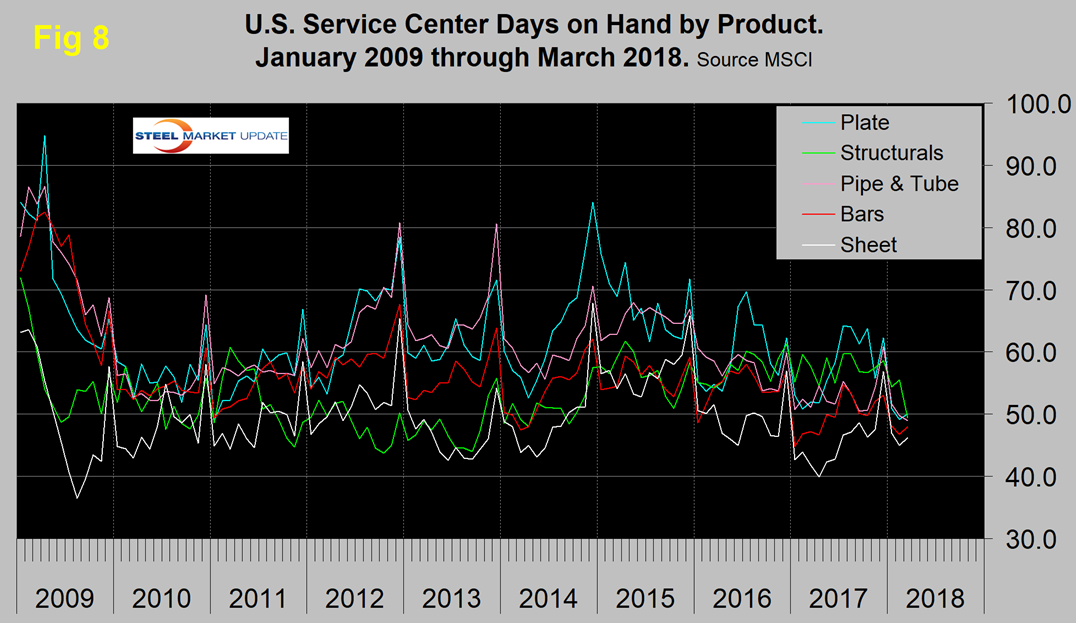
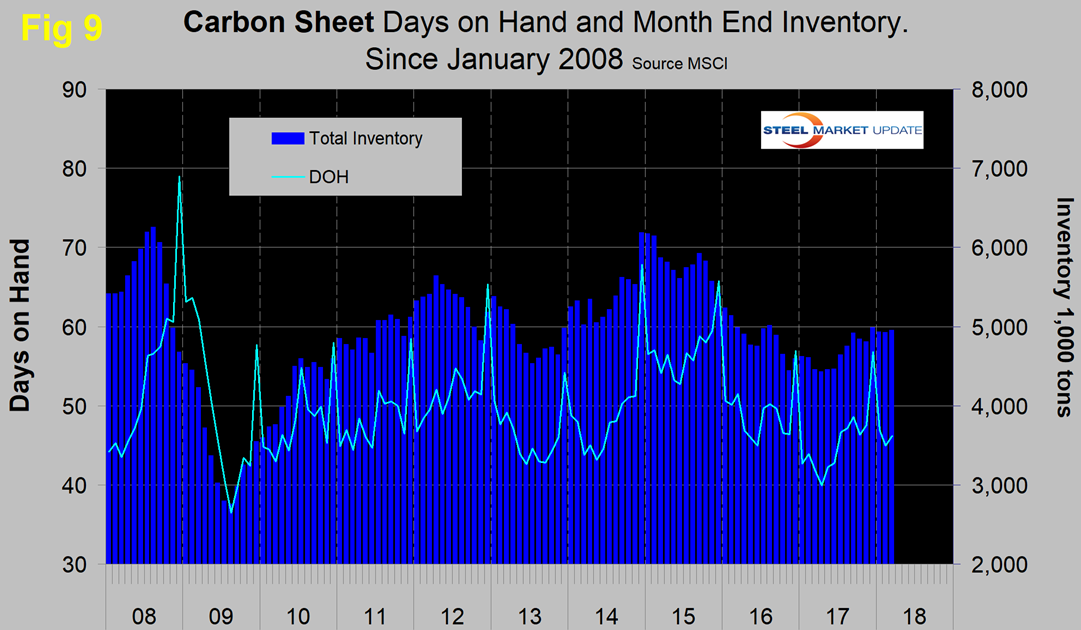
Compared to the end of March last year, total carbon steel inventories rose from 6.8 million to 7.3 million tons, an increase of 8.2 percent, and days on hand rose from 44.7 to 47.1 days. Compared to March 2017, all products except tubular goods and structurals had an inventory tonnage increase. Figure 8 shows the days on hand (DoH) by product monthly since January 2009. Figure 9 shows both the month-end inventory and DoH since January 2008 for total sheet products. In the last three years, both the year-end spikes and the mid-year troughs of days on hand of sheet inventory tonnage have been declining.
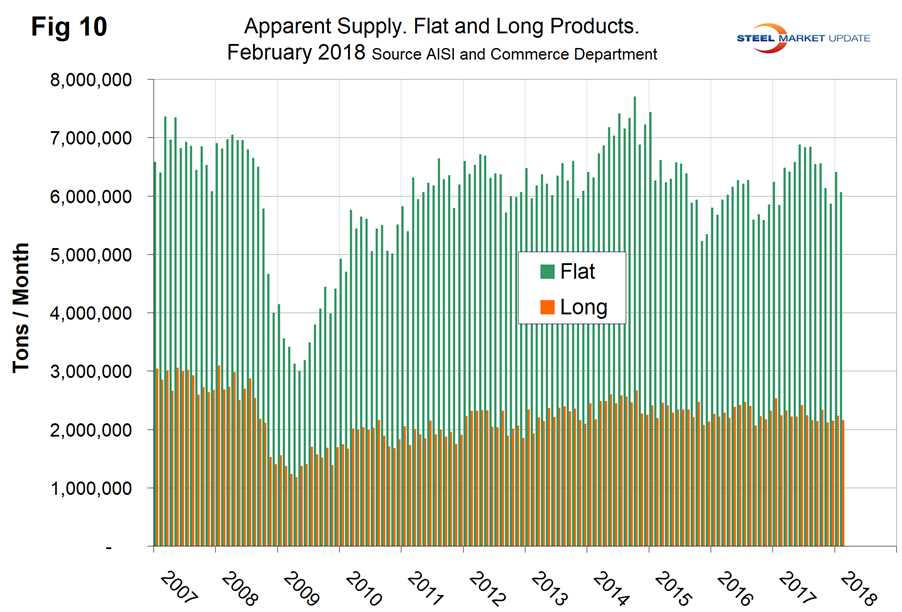
SMU Comment: In March, service center shipments improved for all products except tubulars year over year, the extremes being structurals up 13.8 percent and carbon sheet up 0.6 percent. Tubular goods were unchanged. There are differences between the MSCI data and some of our other information sources that we can’t reconcile. For example, based on AISI shipment data and USITC import data, tubular goods are doing much better than the MSCI data suggests. On the other hand, MSCI data for long products looks more believable than the AISI and import data. Figure 10 shows the total supply to the market of long and flat products based on AISI shipment and import data through February, which is the latest data available.
Notes: In this analysis, we began to report days on hand for the first time in August 2017. All previous SMU updates reported months on hand. The problem with MoH is that it is influenced by the number of shipping days, therefore another variable is introduced. In months with a high number of shipping days, monthly shipments are elevated, which reduces the numerical value of inventory divided by shipments. In months with few shipping days, the reverse is the case. This is a big deal because shipping days can be as low as 18 and as high as 23. This variable is eliminated by considering inventory divided by daily shipments.
The SMU database contains many more product-specific charts than can be shown in this brief review. For each product, we have 10-year charts for shipments, intake, inventory tonnage and months on hand, available on request.


