

Market Data

April 30, 2018
SMU Analysis: Key Market Indicators Still Mostly Positive
Written by Peter Wright
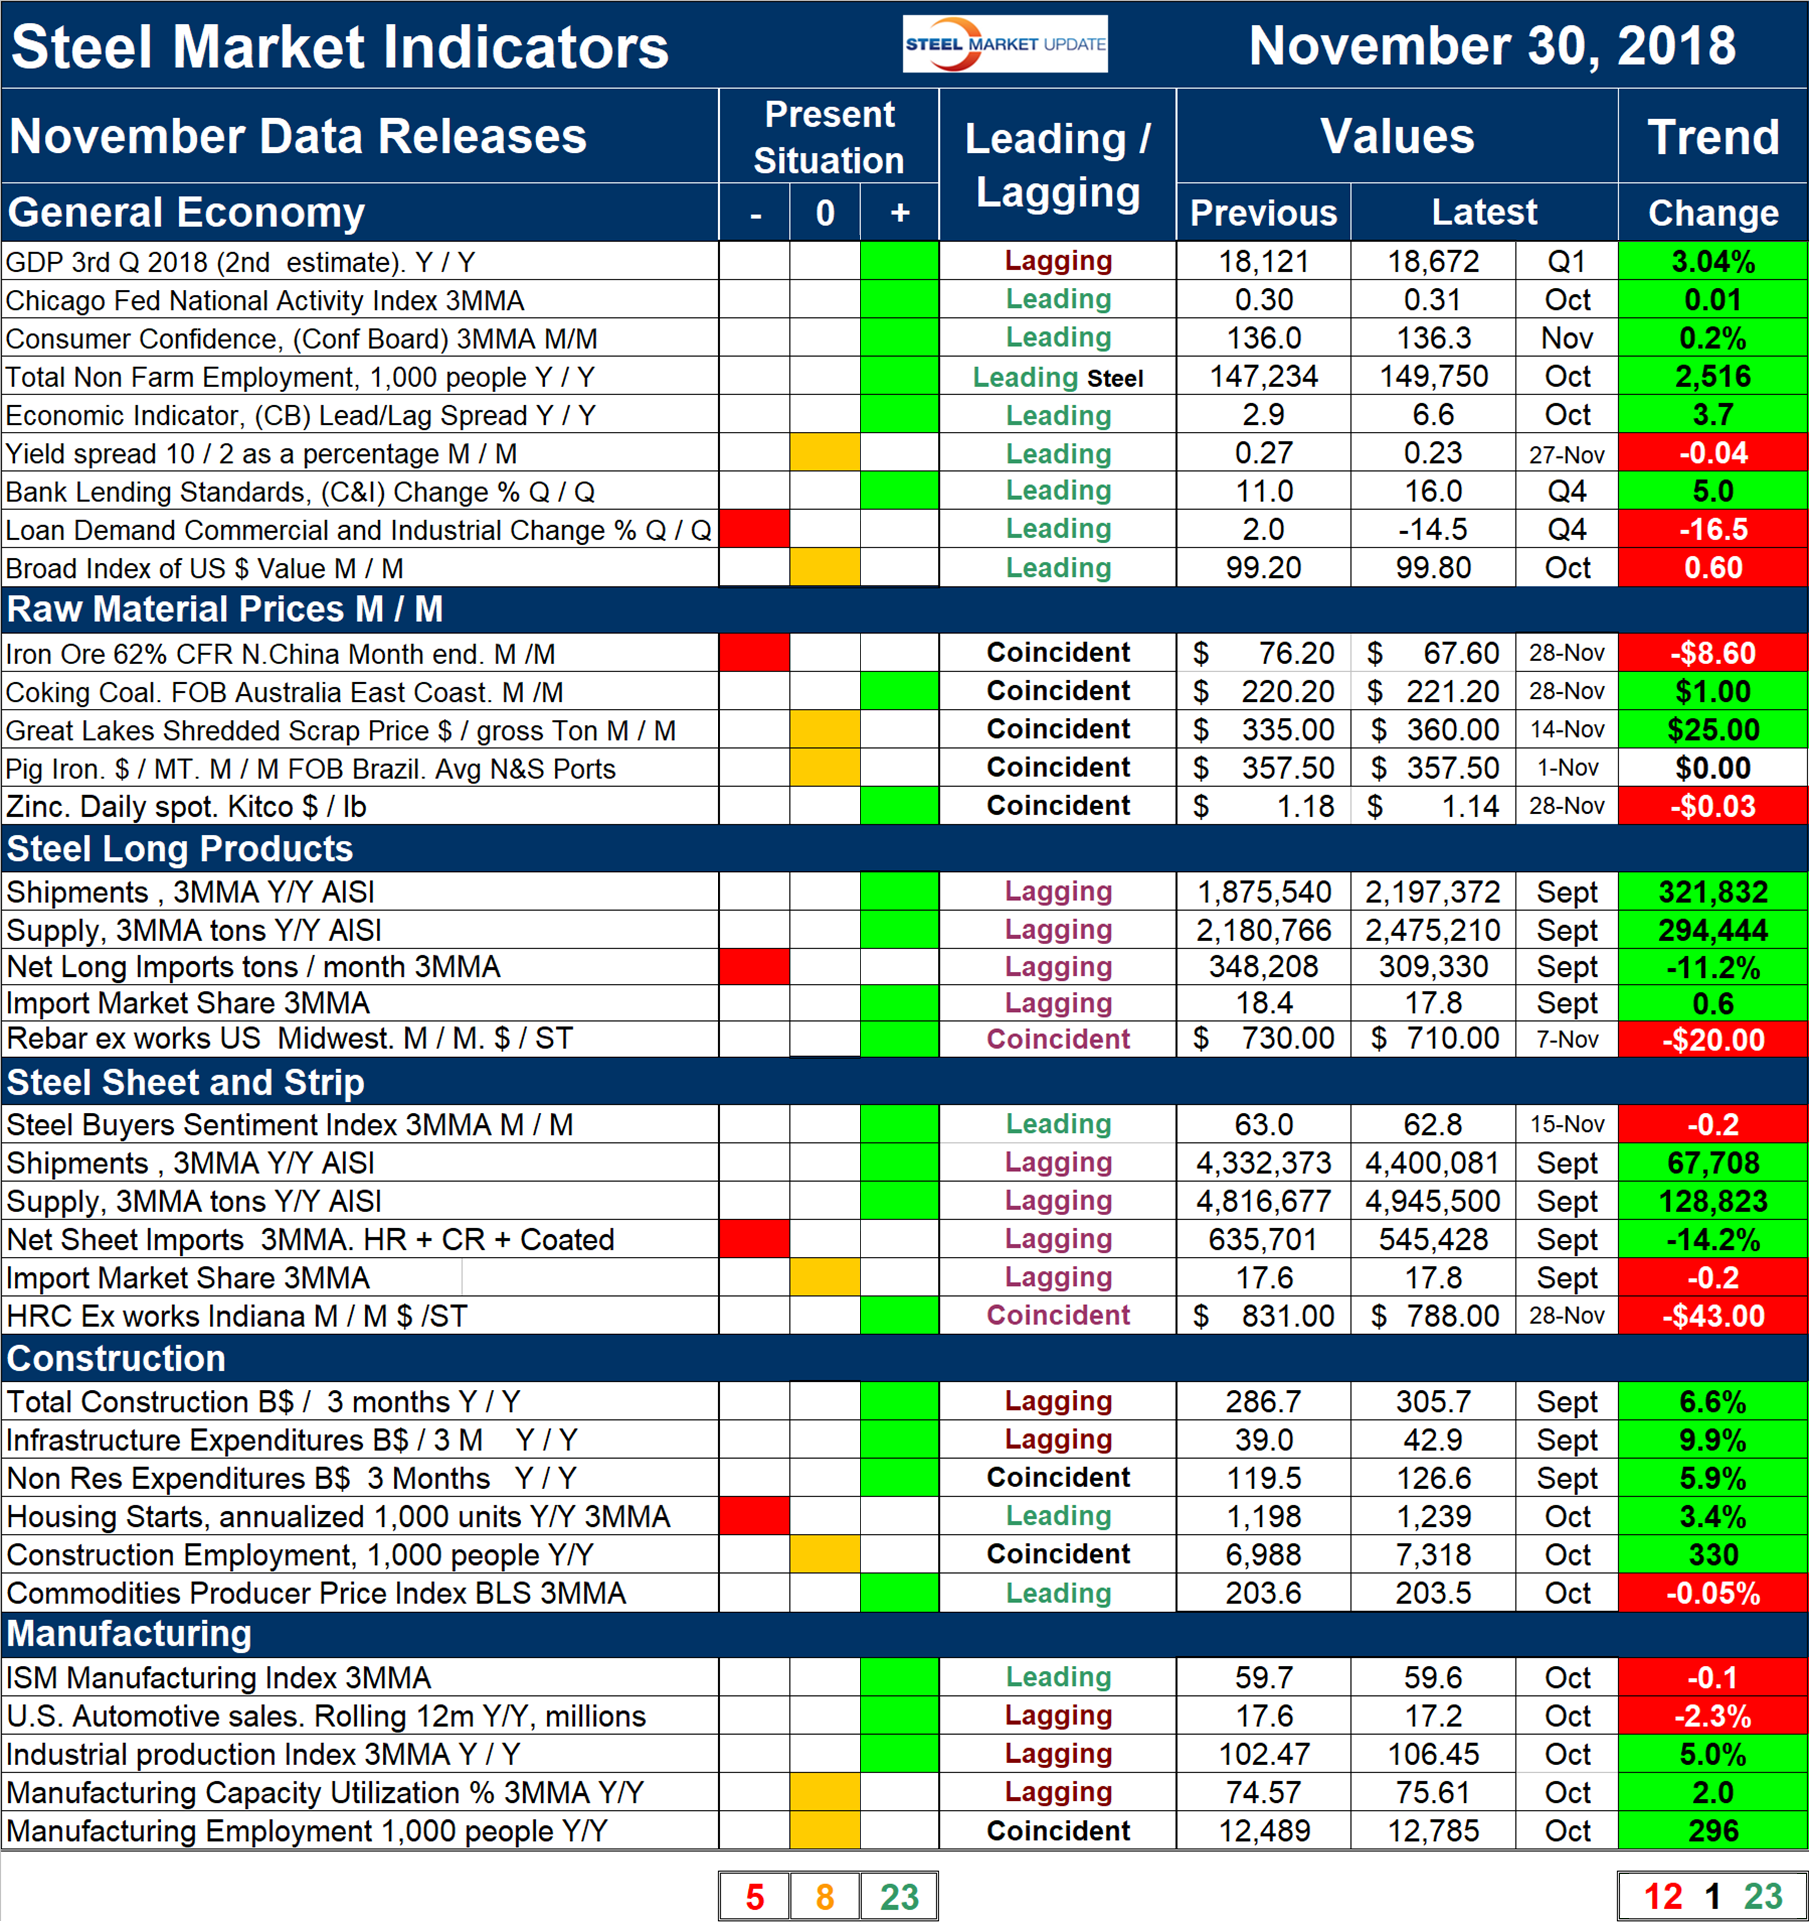
This is Steel Market Update’s first Key Market Indicators report since April as we have renegotiated some data supply contracts and made a few changes to the content. The report still summarizes 36 data streams that we believe critically describe the state of the steel market and provide forward guidance to steel buyers. Data released in November shows that 23 of the 36 indicators are historically positive with only five negative. The balance is within the band of historically normal. Trends took a step back since April, falling from 26 positive to 23 positive in November. Trends lead the present situation by about four months.
See the end of this piece for an explanation of the Key Indicators concept. This will explain the difference between our view of the present situation, which is subjective, and our analysis of trends, which is based on the latest facts available.
Please refer to Table 1 for our view of the present situation and the quantitative measure of trends. Readers should regard the color codes in the present situation column as a visual summary of the current market condition. The “Trend” columns of Table 1 are also color coded to give a quick visual appreciation of the direction the market is headed. All data included in this table was released in November. The month or specific date to which the data refers is shown in the second column from the far right. All results are the latest available as of Nov. 30, 2018.
 Present Situation
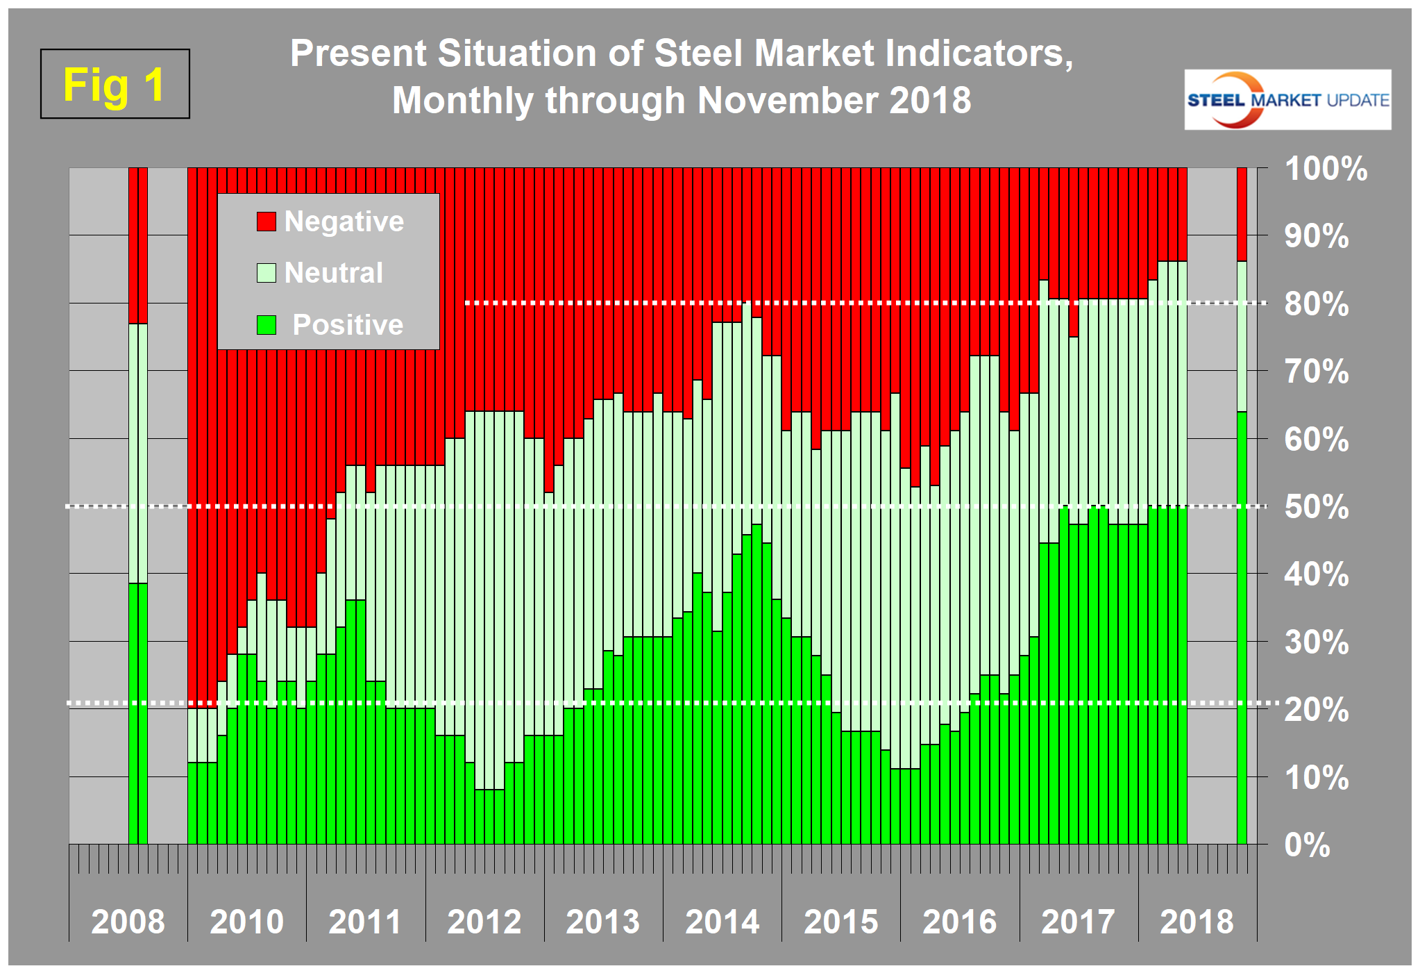
Since our last update, there has been an increase in the number of data points that we consider to be historically positive from 18 in April to 23 in November. The number of negative points remained unchanged at five and the number neutral—falling in the midrange of historical data—declined from 13 to eight. Figure 1 shows our monthly assessment of the present situation since January 2010 on a percentage basis. The number of negative perceptions continues to be the lowest it has ever been in the history of this analysis. The following changes were made in November: In the General Economy section, we introduced The Conference Board leading economic indicator and the 10-year minus 2-year spread of treasury bond yields, both of which we regard as predictors of future recessions. The only negative in this section in fourth-quarter 2018 was that on balance, banks reported to the Federal Reserve that demand has weakened across most major lending categories, though standards on loans have loosened.
In the raw materials section, we have introduced the price of pig iron this month. In November, two of the five product prices are historically positive, two are neutral and one, iron ore, is historically low.
The present state of the long products and sheet markets are very similar with the only negative being that net imports of both are still historically high.
The situation of both construction and manufacturing indicators is good, the only negative being housing starts. Housing will not advance to even a neutral performance in the foreseeable future.
Trends
Most values in the trends columns are three-month moving averages (3MMA) to smooth out what can be very erratic monthly data. Trend changes in the individual sectors are described below together with some general comments. (Please note in most cases this is not November data but data that was released in November for previous months.)
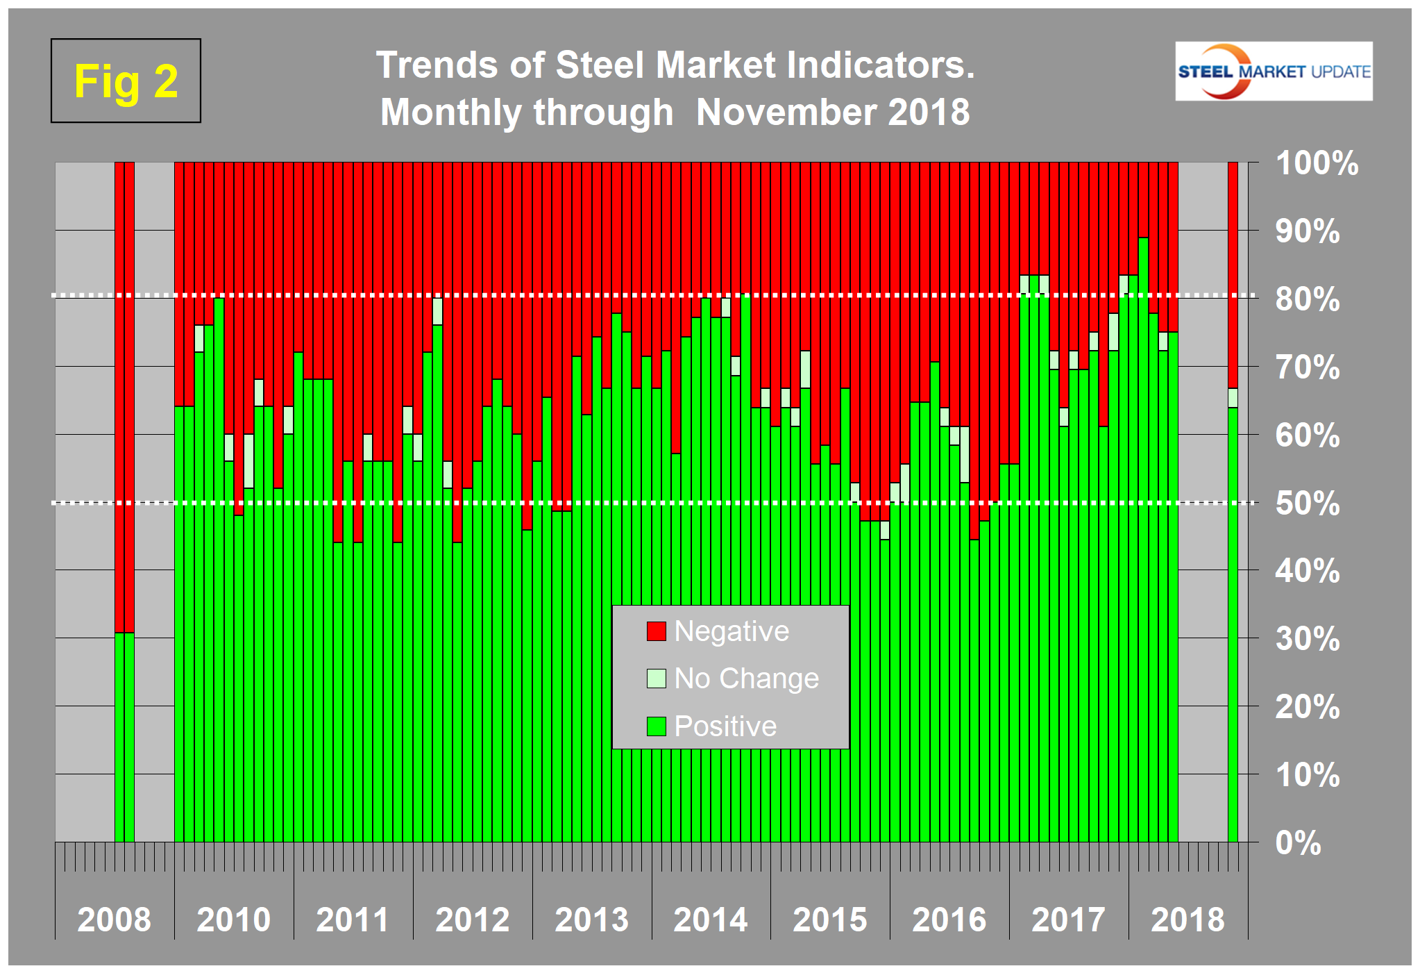
Figure 2 shows the trend of the trends and the pre-recession situation at the far left of the chart. The proportion of trends that are improving is now 63.9 percent of the 36 indicators. This was a decline from an all-time high of 88.9 percent in February.
Our observations about trends in the November data are as follows: In the general economy, trends are good overall, the only negatives being a decline of the yield spread, a decline in demand for commercial and industrial loans and a dollar that continues to add value compared to our other trading partners.
In the raw materials section, the prices of coking coal and scrap are escalating, iron ore and zinc are declining and pig iron was unchanged in November.
In the long products and sheet sections, the prices of benchmark rebar and HRC both declined month over month. The import market share of long products declined and of sheet increased. Year over year, both shipments and supply increased for longs and sheet.
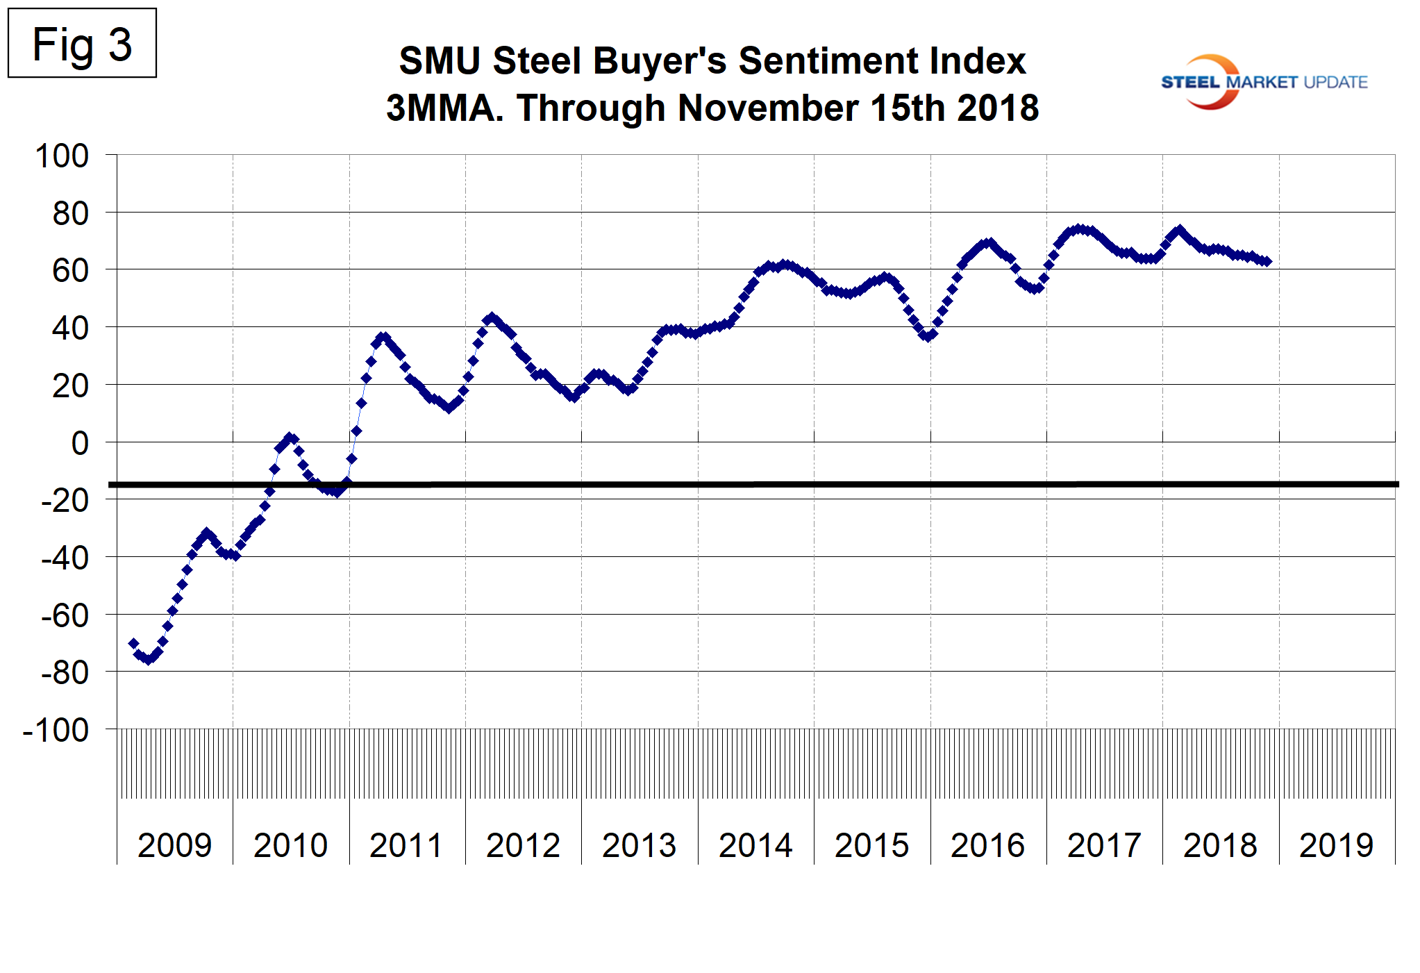
The SMU Steel Buyers Sentiment Index is a measure of the current attitude of buyers and sellers of flat rolled steel products in North America. It reports on how they feel about their company’s opportunity for success in today’s market. This index is still strong, but declined slightly in November and has been in steady decline since the peak in mid-January (Figure 3).
Trends in construction are good, the only negative being a slight decline in the producer price index of commodities. This sector of the PPI analysis is a leading indicator of industrial construction, particularly energy and power projects.
In the manufacturing section, the ISM index took a small step back from a very strong position. U.S. automotive sales, which improved in October, were down by 2.3 percent on a rolling 12-months basis. Industrial production, manufacturing capacity utilization and manufacturing employment all advanced.
We believe a continued examination of both the present situation and direction is a valuable tool for corporate business planning.
Explanation: The point of this analysis is to give both a quick visual appreciation of the market situation and a detailed description for those who want to dig deeper. It describes where we are now and the direction the market is headed and is designed to describe the situation on a specific date. The chart is stacked vertically to separate the primary indicators of the general economy, of proprietary Steel Market Update indices, of raw material prices, of both sheet and long product market indicators, and of construction and manufacturing indicators. The indicators are classified as leading, coincident or lagging as shown in the third column.
Columns in the chart are designed to differentiate between where the market is today and the direction it is pointing. Our evaluation of the present situation is subjectively based on our opinion of the historical value of each indicator. There is nothing subjective about the trends section, which provides the latest facts available on the date of publication. It is quite possible for the present situation to be predominantly red and trends to be predominantly green or vice versa depending on the overall situation and direction of the market. The present situation is subdivided into, below the historical norm (-), (OK), and above the historical norm (+). The “Values” section of the chart is a quantitative definition of the market’s direction. In most cases, values are three-month moving averages to eliminate noise. In cases where seasonality is an issue, the evaluation of market direction is made on a year-over-year comparison to eliminate this effect. Where seasonality is not an issue, concurrent periods are compared. The date of the latest data is identified in the third values column. Values will always be current as of the date of publication. Finally, the far-right column quantifies the trend as a percentage or numerical change with color code classification to indicate positive or negative direction.


