Prices

May 3, 2018
HRC Futures: It’s All About Quotas These Days
Written by David Feldstein
The following article on the hot rolled coil (HRC) futures market was written by David Feldstein. As the Flack Global Metals Director of Risk Management, Dave is an active participant in the hot rolled futures market, and we believe he provides insightful commentary and trading ideas to our readers. Besides writing futures articles for Steel Market Update, Dave produces articles that our readers may find interesting under the heading “The Feldstein” on the Flack Global Metals website, www.FlackGlobalMetals.com. Note that Steel Market Update does not take any positions on HRC or scrap trading, and any recommendations made by David Feldstein are his opinions and not those of SMU. We recommend that anyone interested in trading steel futures enlist the help of a licensed broker or bank.

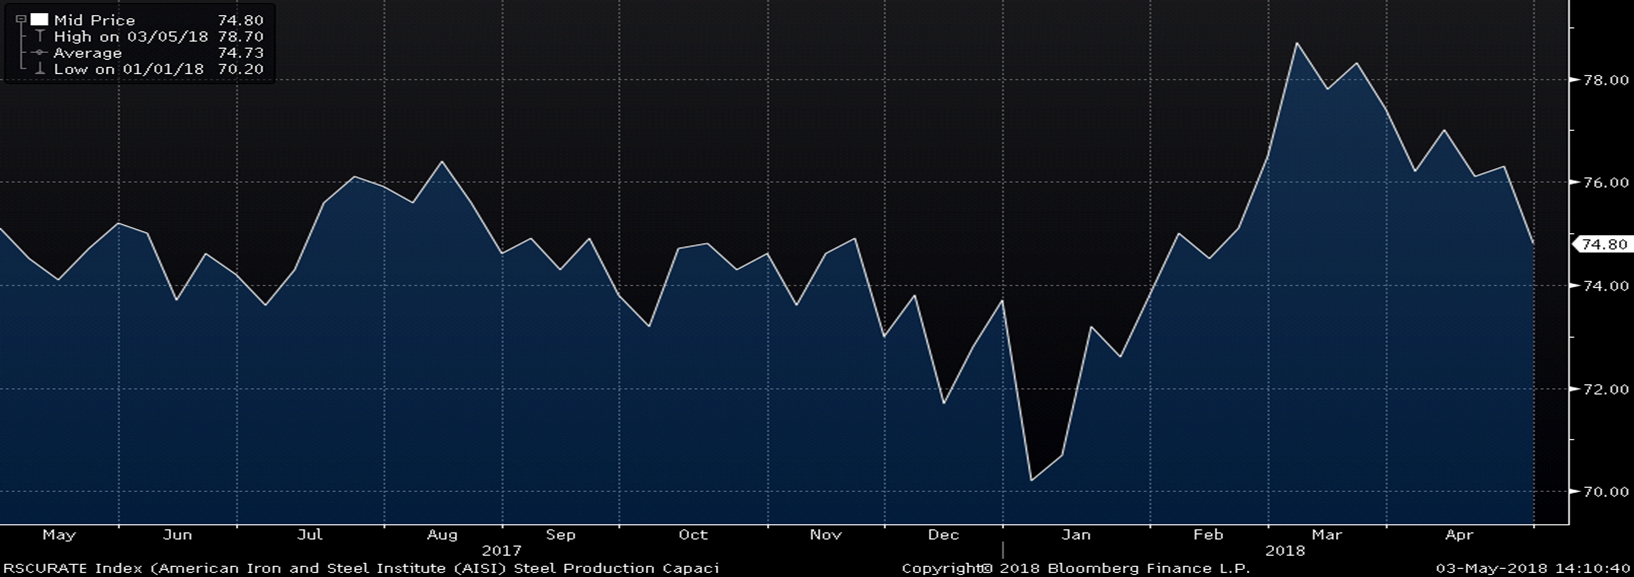
The May 1st tariff exemption deadline came and went with the DOC and Trump administration kicking the can down the road a month. What is becoming clear is that the mechanism by which they will accomplish it will be through quotas. It seems that the negotiation tactic is to convince our allies to agree to these quotas in order to prevent legal action down the road through the WTO. If this is correct, the uncertainty regarding the policy will slowly be resolved, but that resolution should result in the reality that supply will remain constrained. Meanwhile, mill utilization is getting further from 80% and much of that is due to the jump in imported tons in March and April. Expect the DOC and Trump administration to remain hawkish until they meet this goal.
AISI Steel Production Capacity Utilization Rate
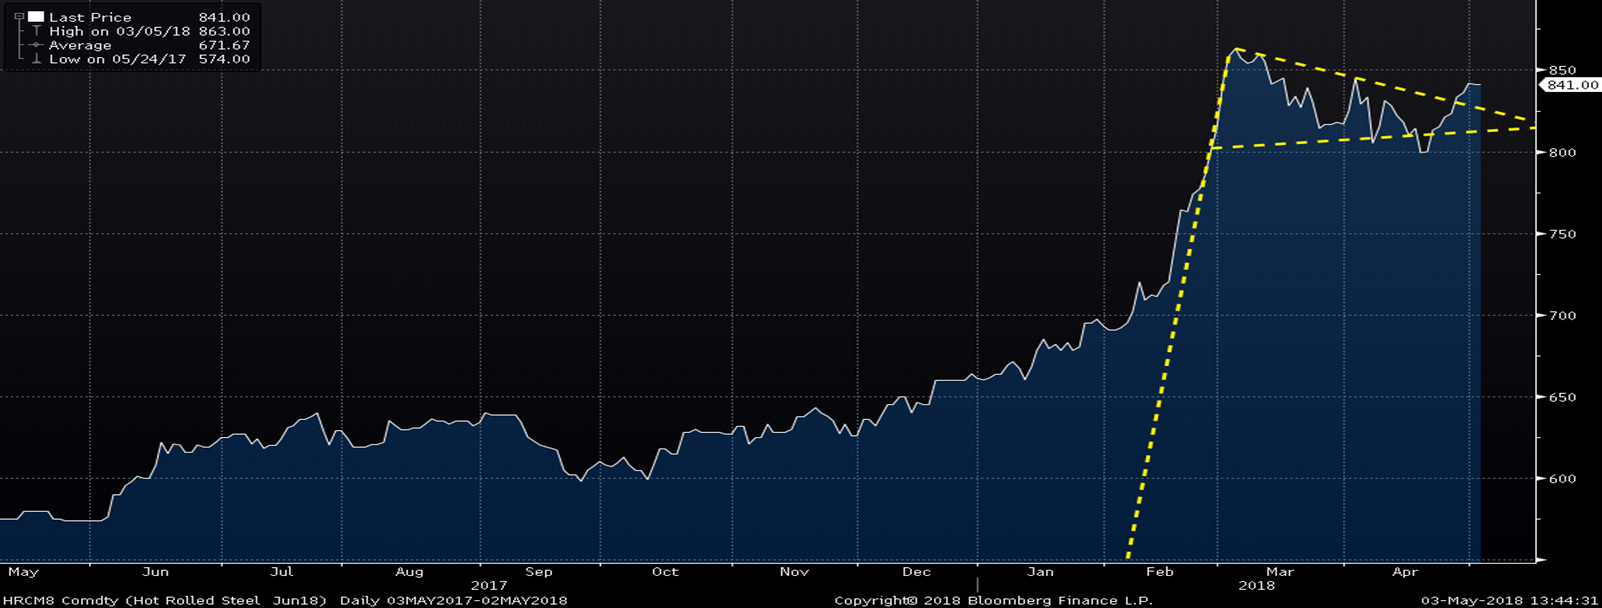
The HRC futures have been range bound since the “Gary Cohn Top” on March 7th, but are now breaking out of a “flag” or “pennant” formation. This pattern forms from a consolidation pattern that follows a sharp rally. Breaking out of the formation can indicate the resumption of the rally.
The May CME Midwest HRC Future
The shape of the curve hasn’t changed much in past weeks with steep backwardation (downward 2sloping) and Q4 trading at over $100 below spot prices.
CME Midwest HRC Future Curve
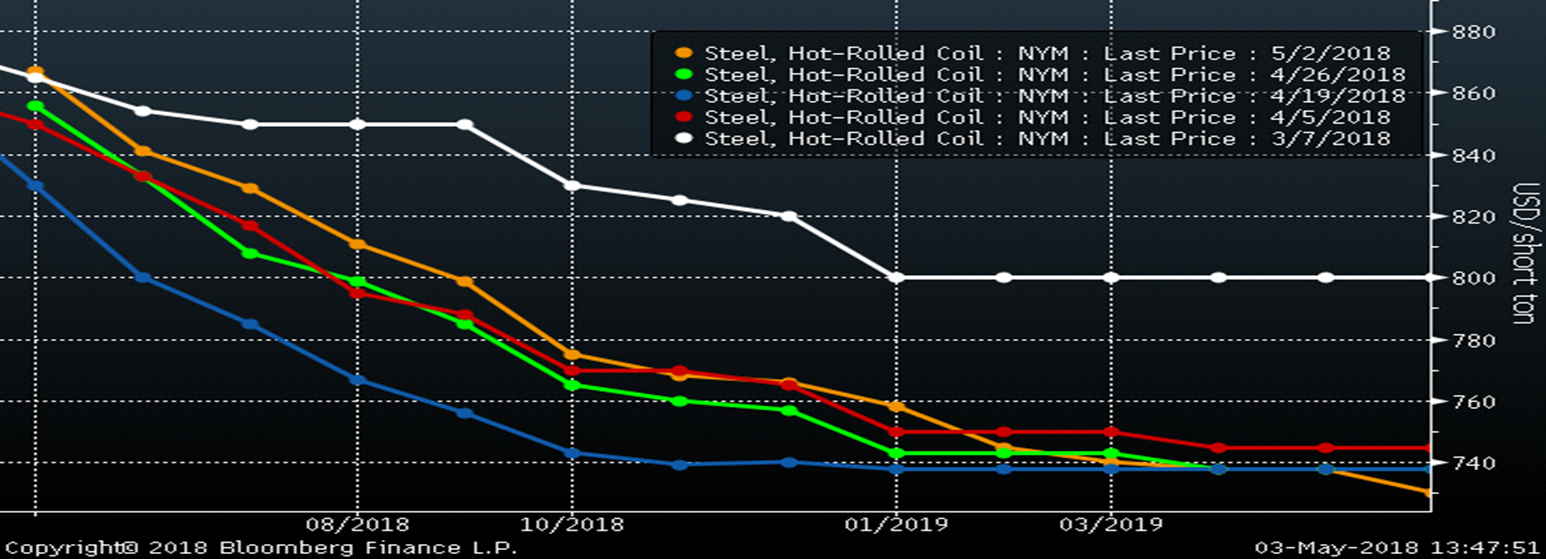
The curve indicates where buyers and sellers agree on price, but it is not a reliable forecast for where the HRC price is going. Case in point:
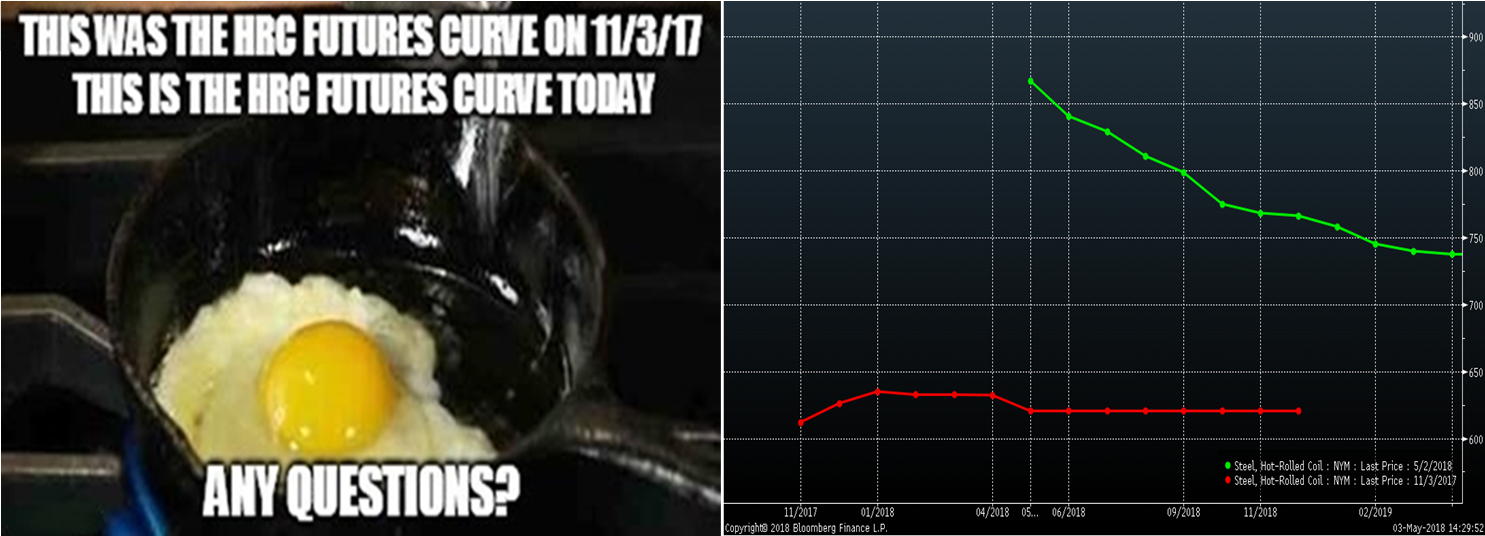
On Nov. 3, 2017, the HRC futures curve was essentially flat trading between $620 and $630. It wasn’t in contango (upward sloping) indicating higher prices to come. None of the 2018 futures were trading in the $700s or $800s. Looking at today’s HRC future curve, the question isn’t is this telling you something, the question is does locking in these prices, whether you are a buyer or seller, make good and prudent business sense? The futures are primarily designed for commercial players who have a customer(s) with a fixed price and can thus lock in a reasonable margin, to hedge inventory price risk or to hedge a long term commitment like imported steel that won’t arrive until October. They are also very useful for speculating on prices, but just remember, it isn’t as easy as looking at a curve and making bets. If it were, everyone would just do that!
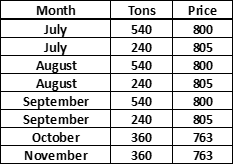
The table below shows today’s HRC futures trades.
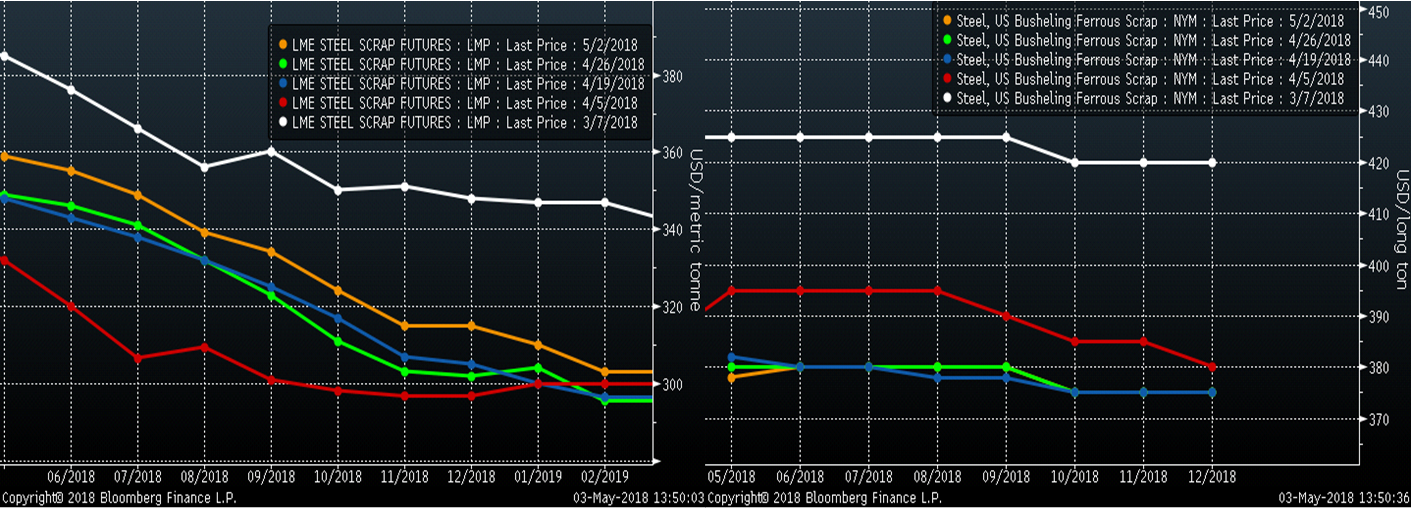
Turkish scrap futures have rallied $6 – $12/t this week. The May and June futures have been relatively weaker than those in July through year end. Busheling futures have been relatively quiet with some metal spread trades (long scrap, short HRC) being executed with May at $378 and Q3 at $385.
LME Turkish Scrap (left) & CME #1 Busheling (right) 2nd Month Rolling Future
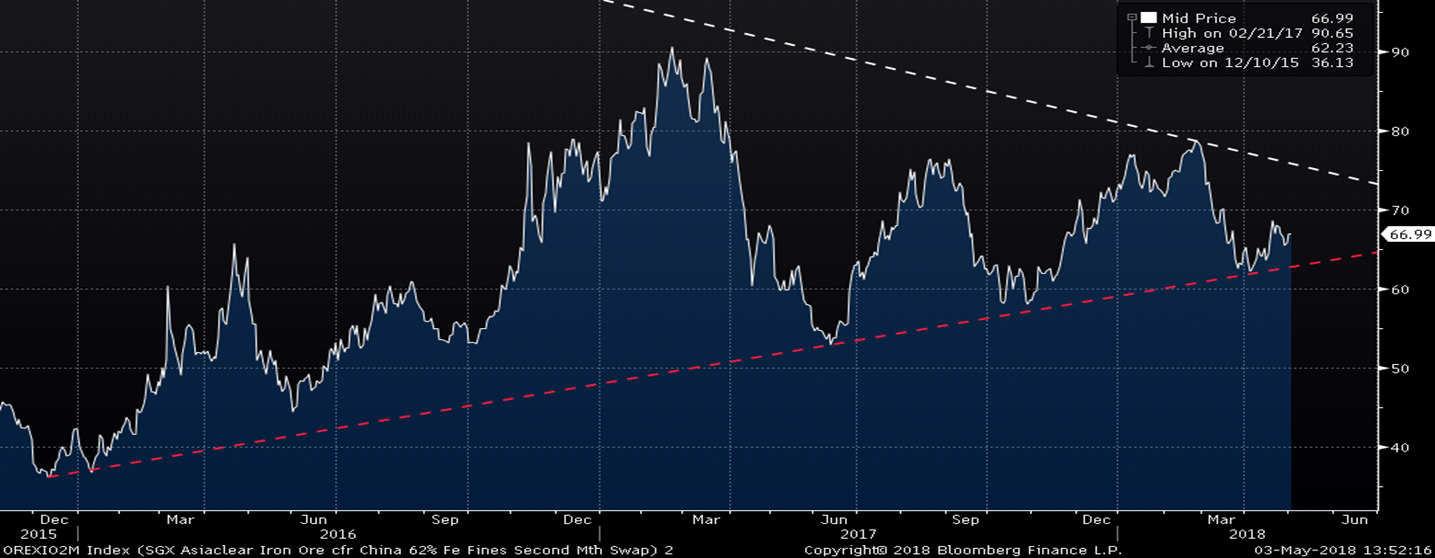
The SGX 2nd month iron ore future has done little in the last week as China was closed for a national holiday. The 2nd month future remains inside the triangle pattern. Watch for it to break out of the triangle and for a sharp move in that direction to follow.
SGX 2nd Month Iron Ore Future
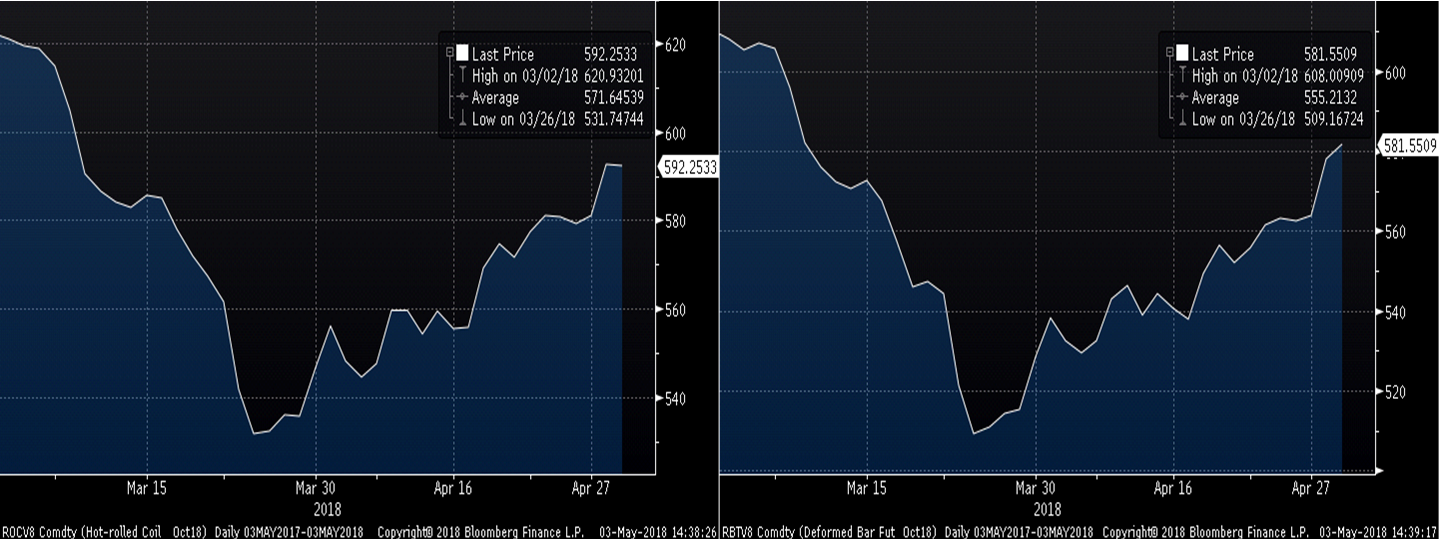
Chinese HRC and rebar futures have rallied 11.5% and 14%, respectively, since March 26th.
Shanghai Futures Exchange October HRC (left) and Rebar (right) Futures
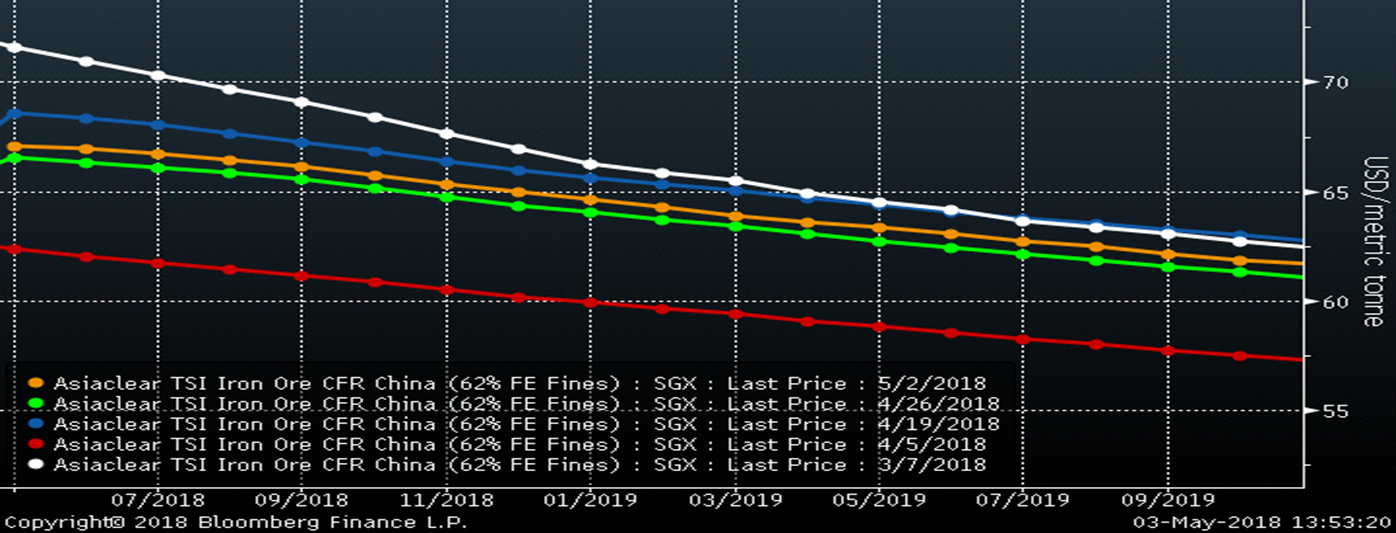
Below is the SGX iron ore futures curve.
SGX Iron Ore Future Curve
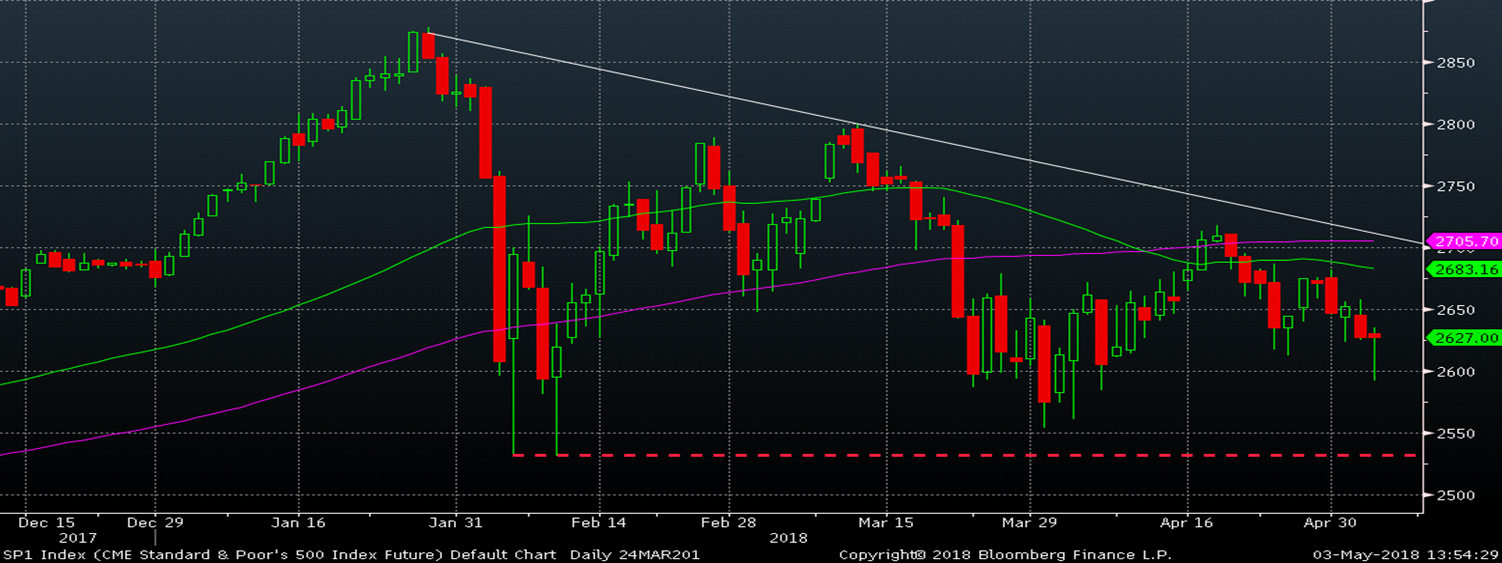
HRC futures look poised for another leg up in the rally barring any major economic disruptions. The S&P 500 has trended lower over the past two weeks. Not a great sign for the market and if it goes back into sell off mode, watch the 2530 (red dashed line) level. If the S&P 500 closes below that level, the market is likely in for a serious correction, a risk worth paying attention to.
S&P 500 June Future