

Market Data

May 3, 2018
Lead Times Continue to be Extended
Written by John Packard
Compared to this time last year, flat rolled lead times are highly extended – on all products. Plate lead times, which is not on our graphic, are also highly extended, but we are treating it differently as the domestic mills are on controlled order entry/allocation with their plate customers.
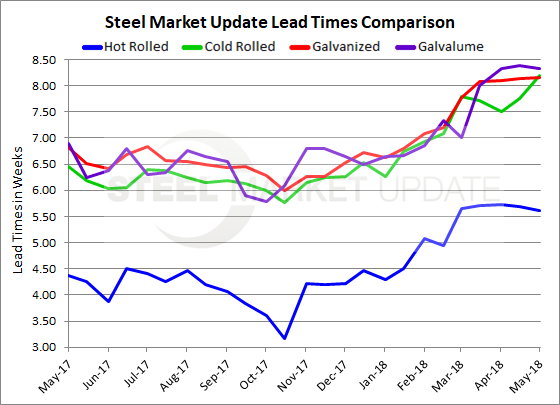
Hot rolled lead times are averaging more than 5.5 weeks (5.62) based on the responses we received this week from our flat rolled steel market trends survey that was completed on Wednesday. One year ago, HRC lead times were averaging 4.37 weeks.
Cold rolled lead times are now out to an average of slightly more than 8 weeks (8.19). This is 1.5 weeks longer than the 6.5 weeks reported one year ago.
Galvanized lead times are much the same as cold rolled coming in at an average of 8.15 weeks. One year ago – 6.82 weeks.
Galvalume lead times are now, as they have been for the past six weeks, at an average of 8.33 weeks. One year ago, AZ lead times were just under 7 weeks (6.89).
The lead times referenced are from the responses we received from our flat rolled steel market trends analysis (survey), which we conduct twice per month. The respondents are either manufacturing companies, steel service centers or wholesalers. Steel mills and trading companies do not participate in this section of our analysis. We average the responses of the two groups to come up with an “average” lead time.
Note: These lead times are based on the average from manufacturers and steel service centers who participated in this week’s SMU market trends analysis. Our lead times do not predict what any individual may get from any specific mill supplier. Look to your mill rep for actual lead times on specific products Our lead times are meant only to identify trends and changes in the marketplace. To see an interactive history of our Steel Mill Lead Times data, visit our website here.


