

Market Data
June 14, 2018
SMU Premium-Level Report: HRC Imports by Region
Written by Tim Triplett
Editor’s Note: Not a Premium-level subscriber to SMU? See the sample Premium report below:
Hot-rolled coil imports in the first four months of the year increased by 38 percent nationally, but saw big variations regionally.
Imports can vary significantly from one region to another. Steel Market Update has produced import reports by product at the national level and detailed reports at the port level by source nation. This new analysis of U.S. International Trade Commission data plugs the gap between SMU’s other reports by identifying changes at the regional level. Produced for the first time this week are reports on hot rolled, cold rolled and hot-dipped galvanized steel.
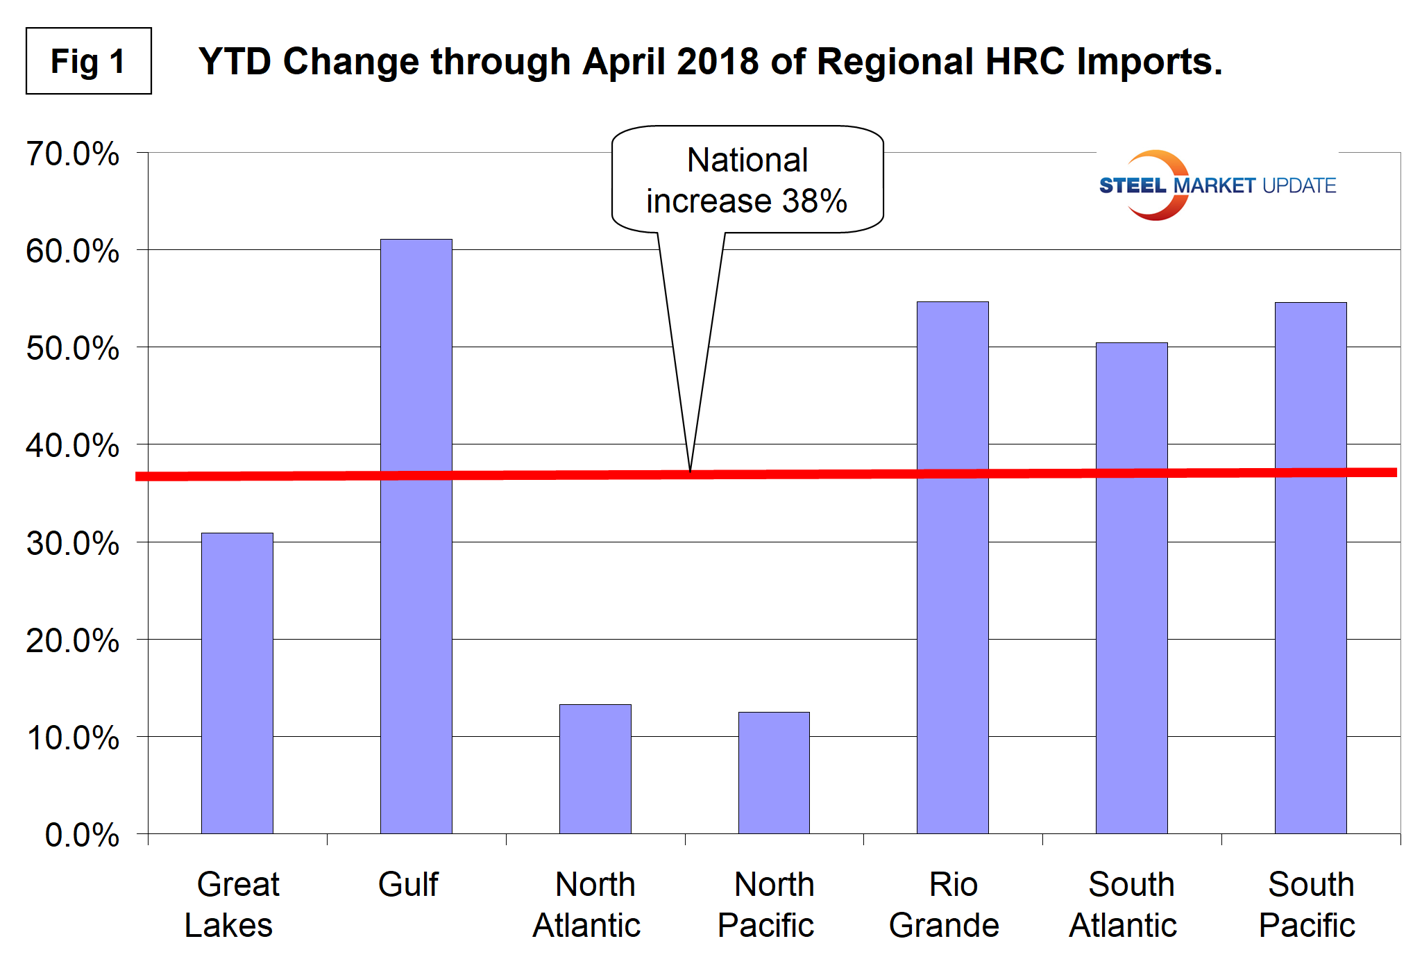
Figure 1 shows the year-to-date change in HRC imports for each of seven regions and the change at the national level. The North Atlantic and North Pacific regions have had a small increase compared to the Gulf of Mexico, the Rio Grande Valley, the South Atlantic and South Pacific. The Great Lakes region, which currently has the highest volume of HRC imports, has experienced a 30.9 percent increase, a little below the 38.3 percent at the national level.
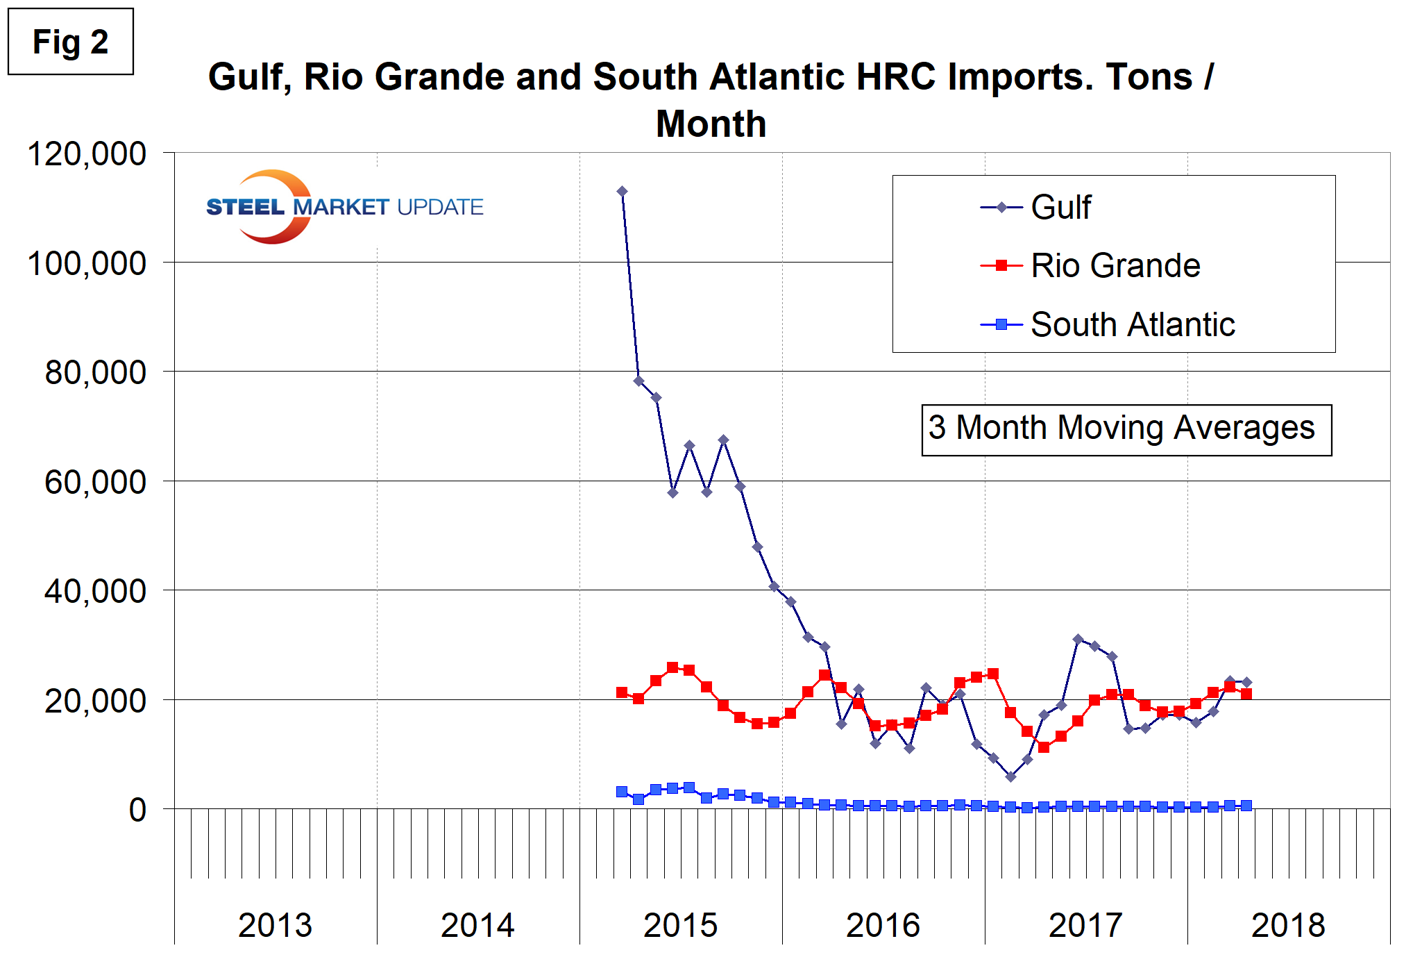
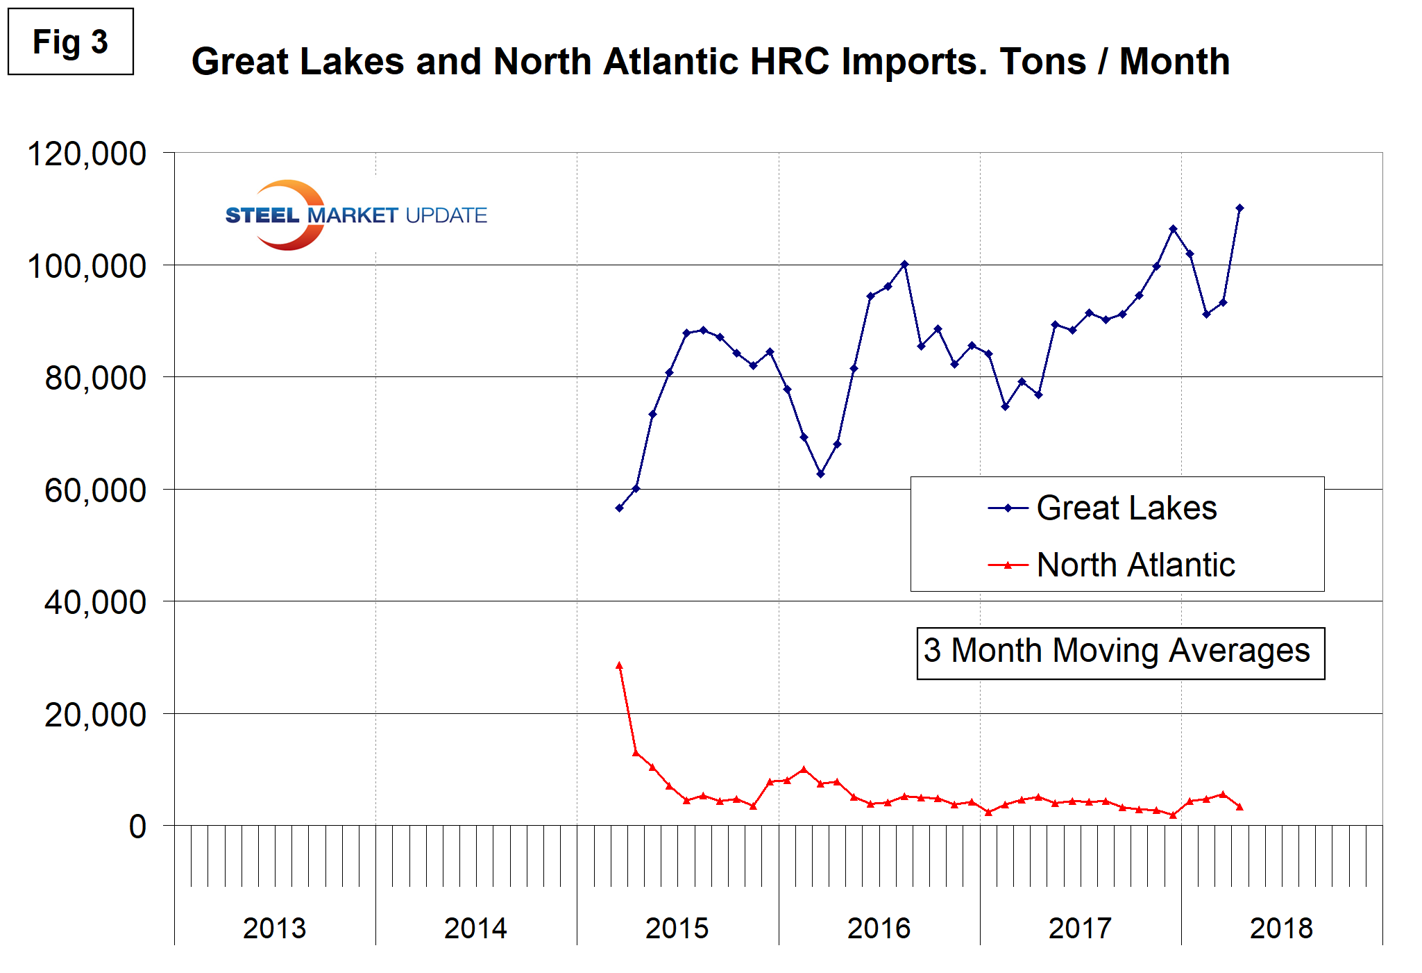
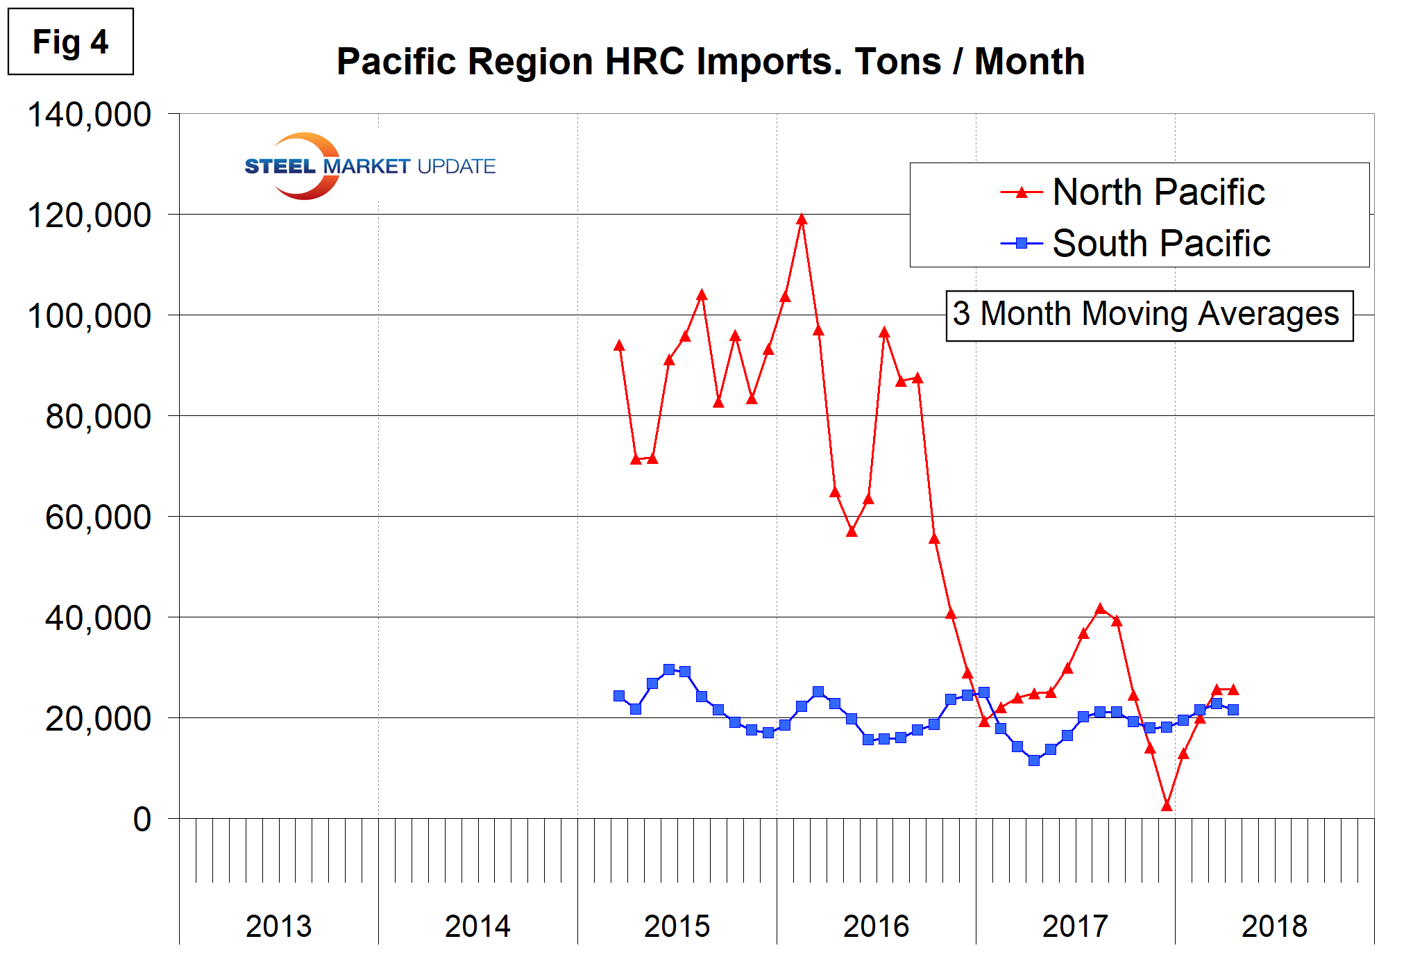
Figures 2, 3 and 4 show the history of HRC coil imports by region since March 2015 on a three-month moving average basis.
There has been a drastic decline of HRC imports into the Gulf region since early 2015. Tonnage coming across the river hasn’t changed much in three years and tonnage into the South Atlantic region is minimal.
The Great Lakes are currently receiving by far the highest volume of HRC imports with minimal tonnage into the North Atlantic ports.
Volume into the North Pacific ports of San Francisco, Columbia Snake and Seattle has fallen drastically since early 2016 and was almost zero in December 2017. There has been a small recovery in 2018. Tonnage into the South Pacific ports of San Diego and Los Angeles has been relatively consistent for over three years.
Executive-level subscribers can upgrade to Premium-level content by emailing info@SteelMarketUpdate.com or calling 772-245-8630.


