SMU Data and Models
![](https://www.steelmarketupdate.com/wp-content/uploads/sites/2/media/k2/items/src/5b3bd75246cd4cbc1e8188747d246310.jpg)
New SMU Regional Analysis of Coiled Plate Imports
Written by Peter Wright
June 22, 2018
There are big differences in the year-to-date increase of coiled plate imports on a regional basis.
Last week, we published new regional import reports for HRC, CRC and HDG. This week we are publishing new reports for coiled and cut-to-length plate based on the new format. SMU produces import reports by product at the national level and detailed reports for premium subscribers by product at the port level by source nation. These new reports are designed to bridge the gap between those two. Our intent is to demonstrate and measure the fact that an import report at the national level can miss regional differences that may be substantial.
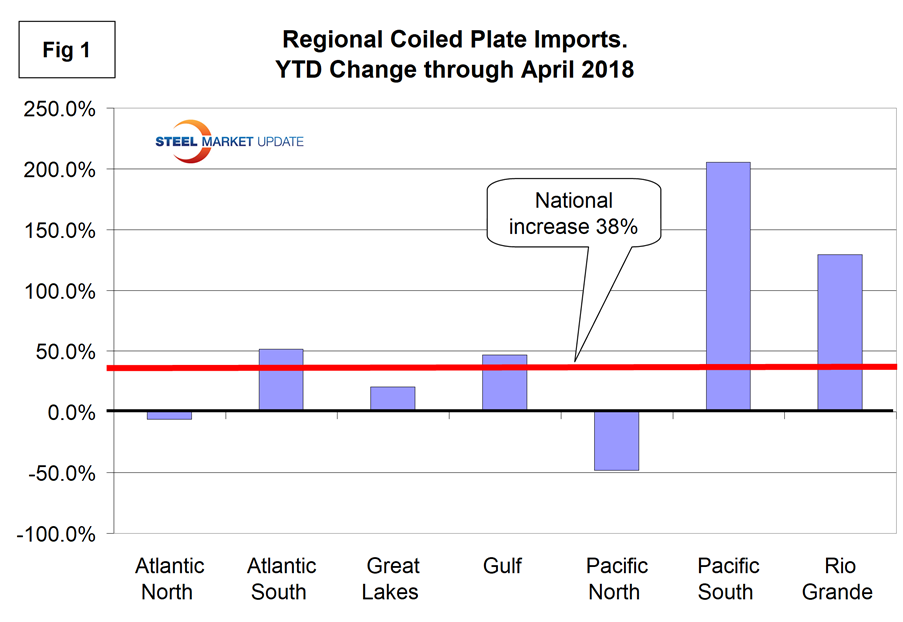
In the first four months of the year, coiled plate imports were up from 299,960 tons in 2017 to 413,303 tons in 2018, an increase of 37.8 percent. Figure 1 shows the year-to-date change for each of seven regions and the change at the national level. Differences between regions are extreme for this product. In 2018, the Pacific South was up 205 percent and the Pacific North was down by 48 percent. By far the highest volume region in both years was the Great Lakes with a volume increase of 20.4 percent. To dig deeper into the current situation, it is necessary to go to our detailed report by district and source nation. For example, such an examination of the Pacific South shows firstly that there is zero volume into San Diego and that the increased tonnage into Los Angeles came mainly from Korea. In the first four months of 2017, Korea shipped 7,082 tons into LA; this increased to 23,868 tons in 2018.
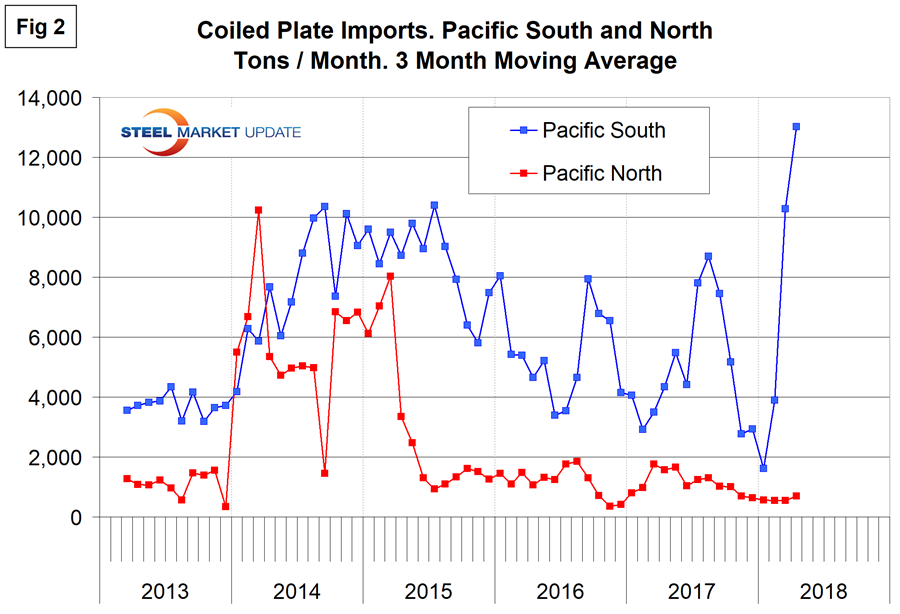
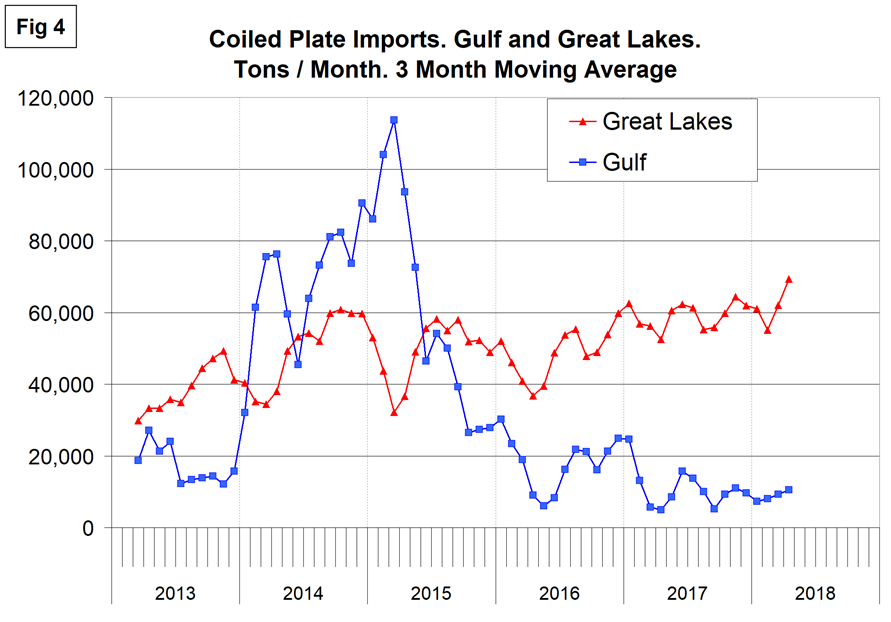
Figures 2, 3, 4 and 5 show the history of coiled plate imports by region since March 2013 on a three-month moving average basis.
The dramatic increase in volume into the Pacific South is shown in Figure 2. Tonnage into the Pacific North has been minimal since mid-2015.
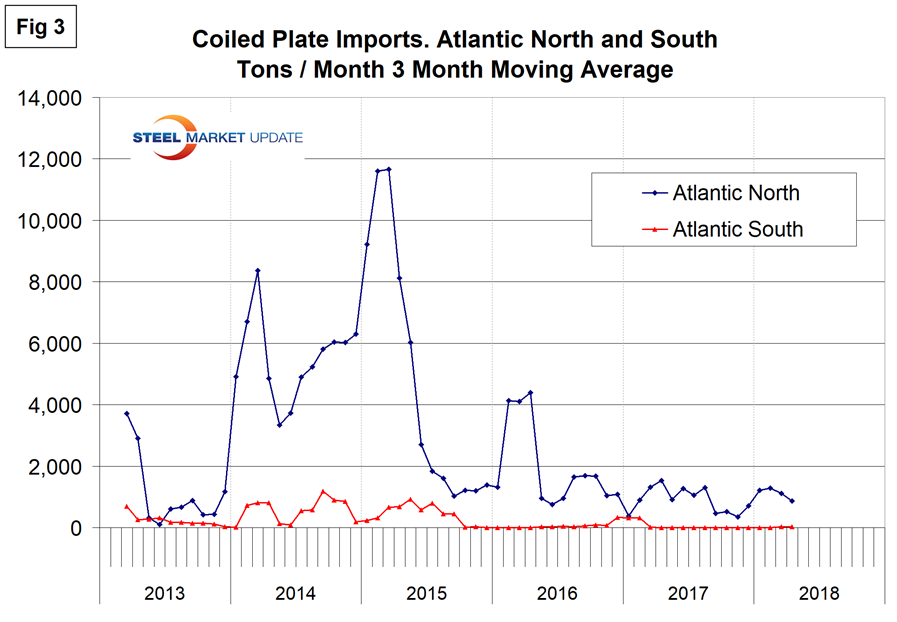
Tonnage into the North Atlantic ports peaked in early 2015 and has declined drastically since then. Only 97 tons entered the South Atlantic region in the first four months of 2018.
Imports into the Gulf have also declined drastically since early 2015. Volume into the Great Lakes has been steadily increasing in the same time frame.
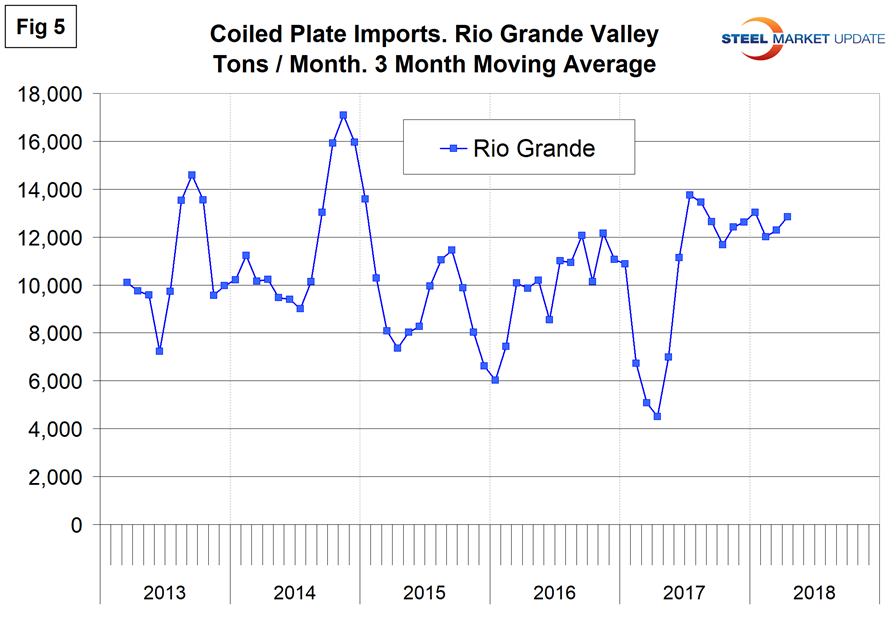
Tonnage crossing the Rio Grande into Laredo and El Paso has been relatively consistent since 2013.
![](https://www.steelmarketupdate.com/wp-content/uploads/sites/2/2023/04/peter-wright.png)
Peter Wright
Read more from Peter WrightLatest in SMU Data and Models
![](https://www.steelmarketupdate.com/wp-content/uploads/sites/2/images/Featured_News_Icons/Premium1.png)
Steelmaking raw material prices ease in July
The majority of steelmaking raw material prices declined in June, following the same trend seen in May, according to SMU’s latest analysis.
![](https://www.steelmarketupdate.com/wp-content/uploads/sites/2/2024/01/cropped-SMU_Mobile_final.png)
SMU price ranges: HR declines moderate. Are we near a bottom?
SMU’s sheet price ranges slid again this week. But the declines were more pronounced on tandem products whereas prices for hot-rolled coil held roughly steady.
![](https://www.steelmarketupdate.com/wp-content/uploads/sites/2/images/Featured_News_Icons/Premium1.png)
Some SMU Key Market Indicators improve, others remain near historic lows
SMU’s Key Market Indicators include data on the economy, raw materials, manufacturing, construction, and steel sheet and long products. They offer a snapshot of current sentiment and the near-term expected trajectory of the economy. All told, nine key indicators point lower, 16 are neutral, and 13 point higher. One thing worth noting: The nine indicators pointing lower are all lagging indicators. Many of those pointing upward are leading indicators.
![](https://www.steelmarketupdate.com/wp-content/uploads/sites/2/2024/01/cropped-SMU_Mobile_final.png)
SMU survey: Steel Buyers’ Sentiment Indices rebound
SMU’s Steel Buyers’ Sentiment Indices both saw improvement this week. Current sentiment ticked higher but remains near the four-year low seen earlier this month. Future Sentiment continues to indicate that buyers are optimistic for future business conditions.
![](https://www.steelmarketupdate.com/wp-content/uploads/sites/2/images/Featured_News_Icons/Premium1.png)
SMU market survey results now available
The latest SMU market survey results are now available on our website to all premium members. After logging in at steelmarketupdate.com, visit the pricing and analysis tab and look under the “survey results” section for “latest survey results.” Historical survey results are also available under that selection. If you need help accessing the survey results, or if your […]