

Market Data

August 9, 2018
Steel Mill Lead Times: Getting Shorter
Written by Tim Triplett
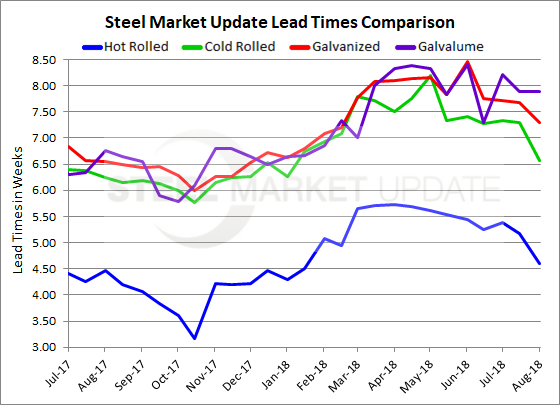
Lead times for steel delivery are a measure of demand at the mill level. Lead times on most flat rolled steel products continue to shorten, according to Steel Market Update’s latest market trends data, suggesting that the mills are not as busy as they were earlier in the year and may be more open to negotiation. Lead times for hot rolled now average less than five weeks, cold rolled less than seven weeks and galvanized less than seven and a half weeks. Galvalume lead times are about the same. While mill lead times are still extended compared to this time last year, they are gradually moving back toward more typical delivery times.
Hot rolled lead times now average 4.60 weeks, down from 5.39 weeks a month ago, and down from the April peak of 5.73 weeks.
Cold rolled lead times, at 6.57 weeks, are down from 7.33 weeks in early July. Last year at this time, CR lead times averaged 6.25 weeks.
The current lead time for galvanized steel is 7.29 weeks, down from 7.71 weeks at this time last month. A year ago, lead times on spot orders of galvanized averaged 6.54 weeks.
At 7.88 weeks, Galvalume lead times are relatively unchanged over the past couple months, but up from 6.30 weeks this time last year.
Note: These lead times are based on the average from manufacturers and steel service centers who participated in this week’s SMU market trends analysis. Our lead times do not predict what any individual may get from any specific mill supplier. Look to your mill rep for actual lead times. Our lead times are meant only to identify trends and changes in the marketplace. To see an interactive history of our Steel Mill Lead Times data, visit our website here.


