

Prices

August 9, 2018
SIMA: Steel Import License Data for July
Written by Peter Wright
Steel Market Update offers this early look at July’s import volume based on license data (see explanation below). The analysis evaluates the pressure that imports are having on individual products at the national level, but gives no indication of regional differences. SMU has developed a new series of regional reports for the six main flat rolled sectors, as we are becoming more aware that changes in import levels at the regional level are in some cases much different than changes at the national level.
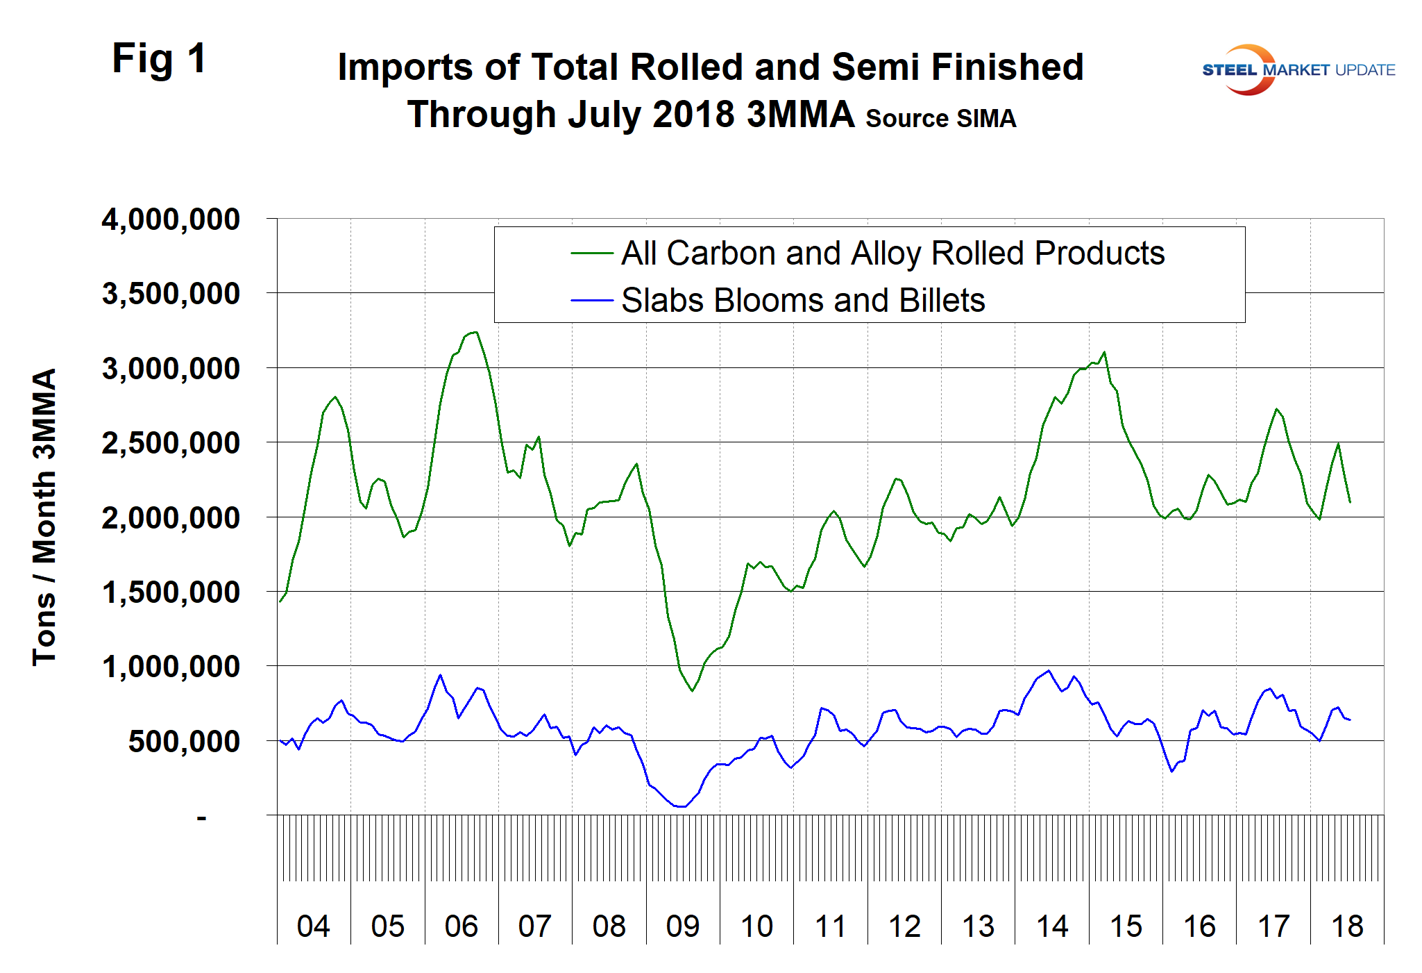
Total rolled steel product imports in July were up by 24.1 percent from June’s volume, but on a 3MMA basis were down by 8.4 percent. This discrepancy arose because June’s volume was the lowest since December 2012. Year over year, total rolled product imports were down by 23.0 percent on a 3MMA basis.
Beginning in January 2018, we expanded this import analysis to include all major steel sectors: sheet, plate, longs and tubulars, with a total of 18 subsectors, and we now publish an import market share analysis for the same 18 steel product groups. Together, these two reports should give an accurate view of the effect of the Section 232 trade legislation. All volumes in this analysis are reported in short tons. We use three-month moving averages rather than single-month results to smooth out the variability.
Figure 1 shows the tonnage of total rolled steel and semi-finished imports through July on a 3MMA basis. The volume of total rolled product imports in June had a recent low of 1,766,259 tons. There was a recovery to 2,191,754 tons in July with a 3MMA of 2,289,324 tons. The import volume of semis in July was 816,684 tons with a 3MMA of 638,542 tons. Because of the variability in these numbers, it’s easy to suggest very different trends depending how one looks at them. We are trying to give the most accurate view by considering three months of data and comparing both short- and long-term volumes.
There are three tables in this report. In each of them, we show the 3MMA of the tonnage in July 2018 and 2017 with the year-over-year change. We then calculate the percentage change in volume in the most recent three months with the previous three months. This month, we are comparing May/June/July with February/March/April (3M/3M). The next column to the right shows the year-over-year change as a percentage. Declines are color coded green and increases are coded red. Finally, in the far-right column, we subtract the 12-month change from the three-month change. This is a way of describing the magnitude of the recent trend as a percentage. It is not unusual for the color code of the trend to be the opposite of the two time frame analyses.
Table 1 describes the imports of all major sectors of the sheet and plate markets. In the flat rolled sectors shown in Table 1, all sheet and plate products except tin plate had decreasing imports 3M/3M and every one of them decreased year over year. Figures 2 and 3 show the history of sheet and plate product imports since January 2004.
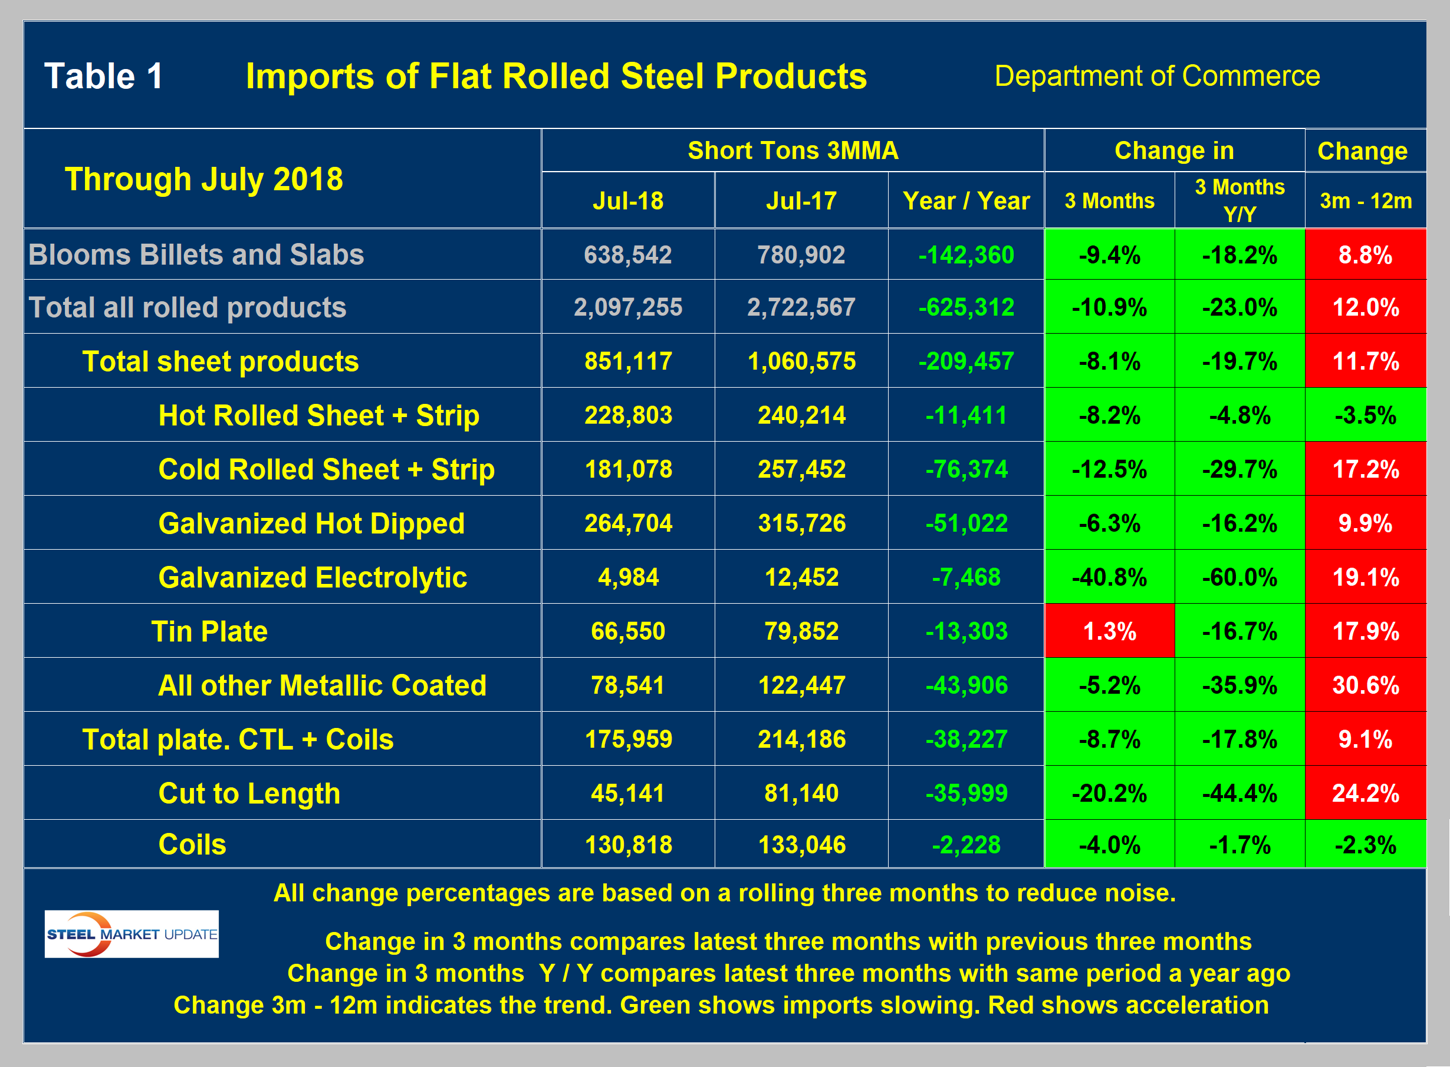
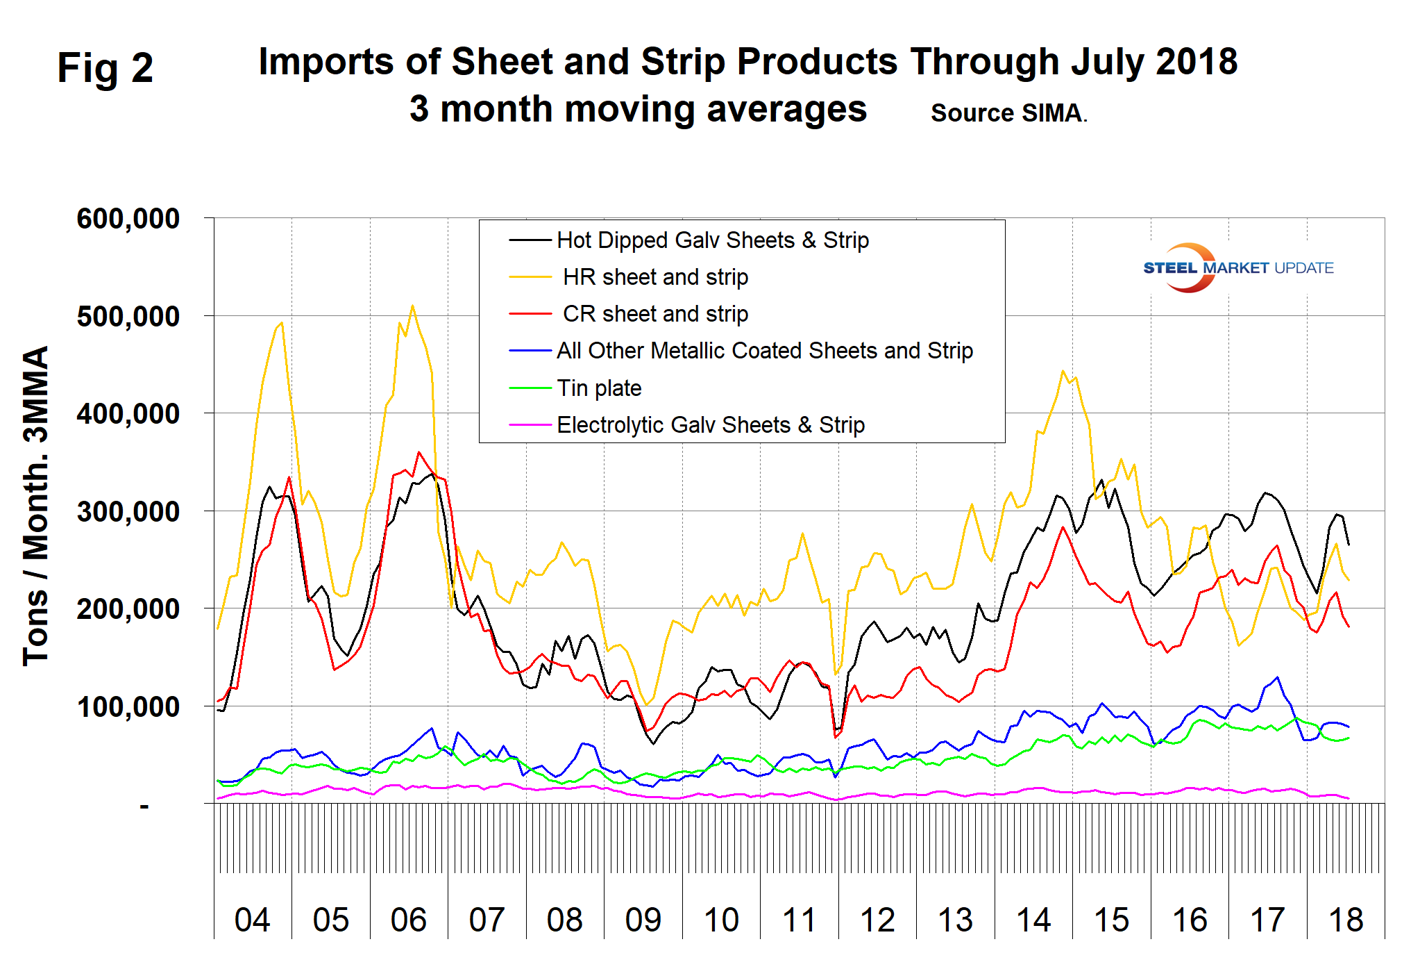
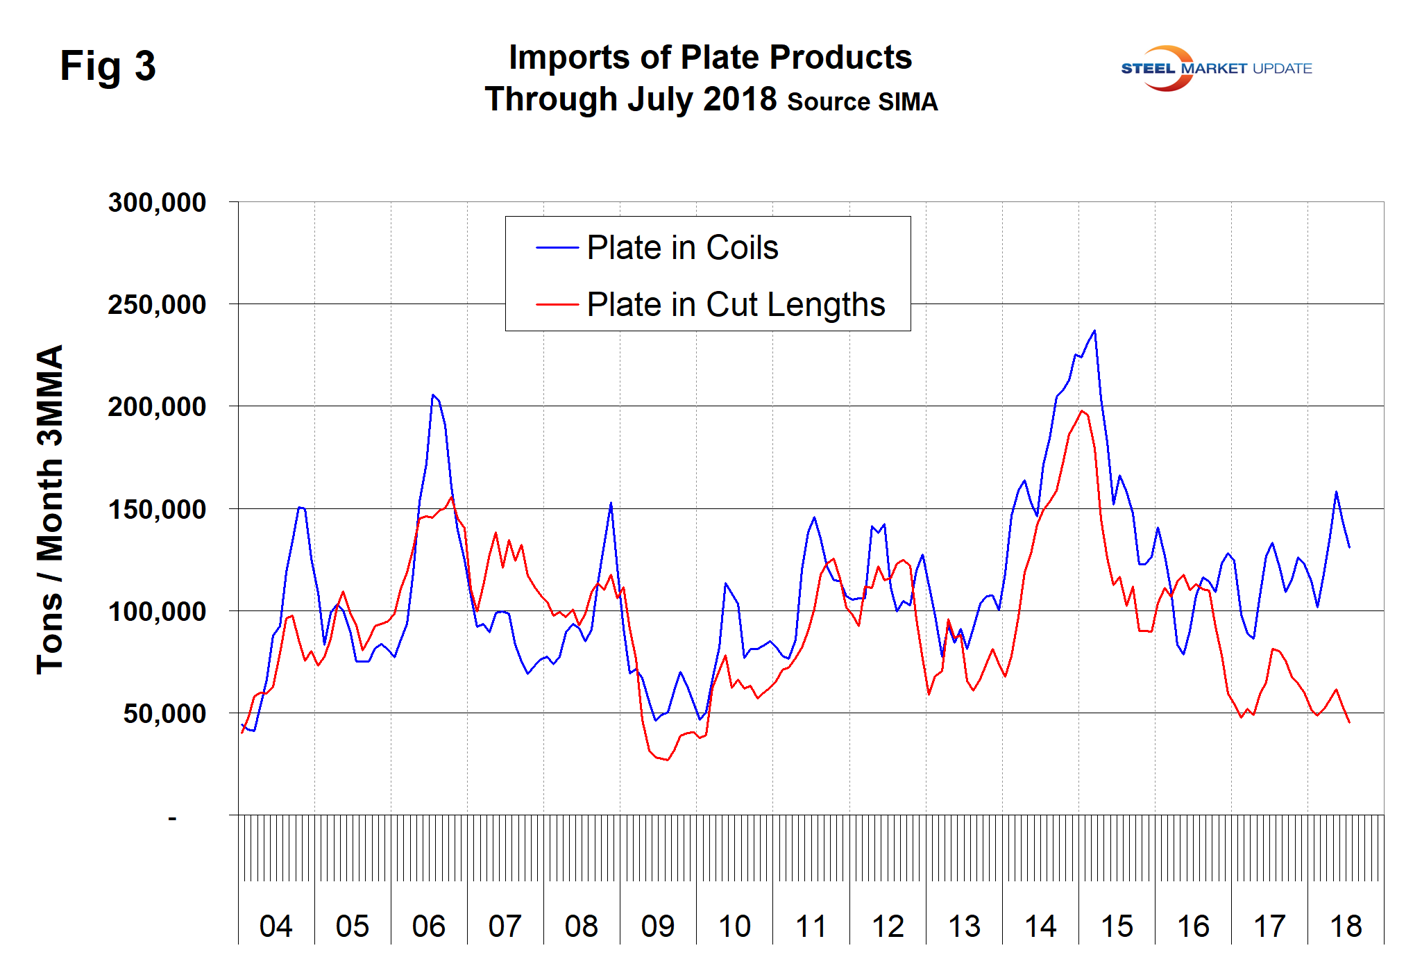
Table 2 shows the same analysis for long products where 3M/3M imports were down by 8.8 percent and down by 28.9 percent year over year. Figure 4 shows the history of long product imports.
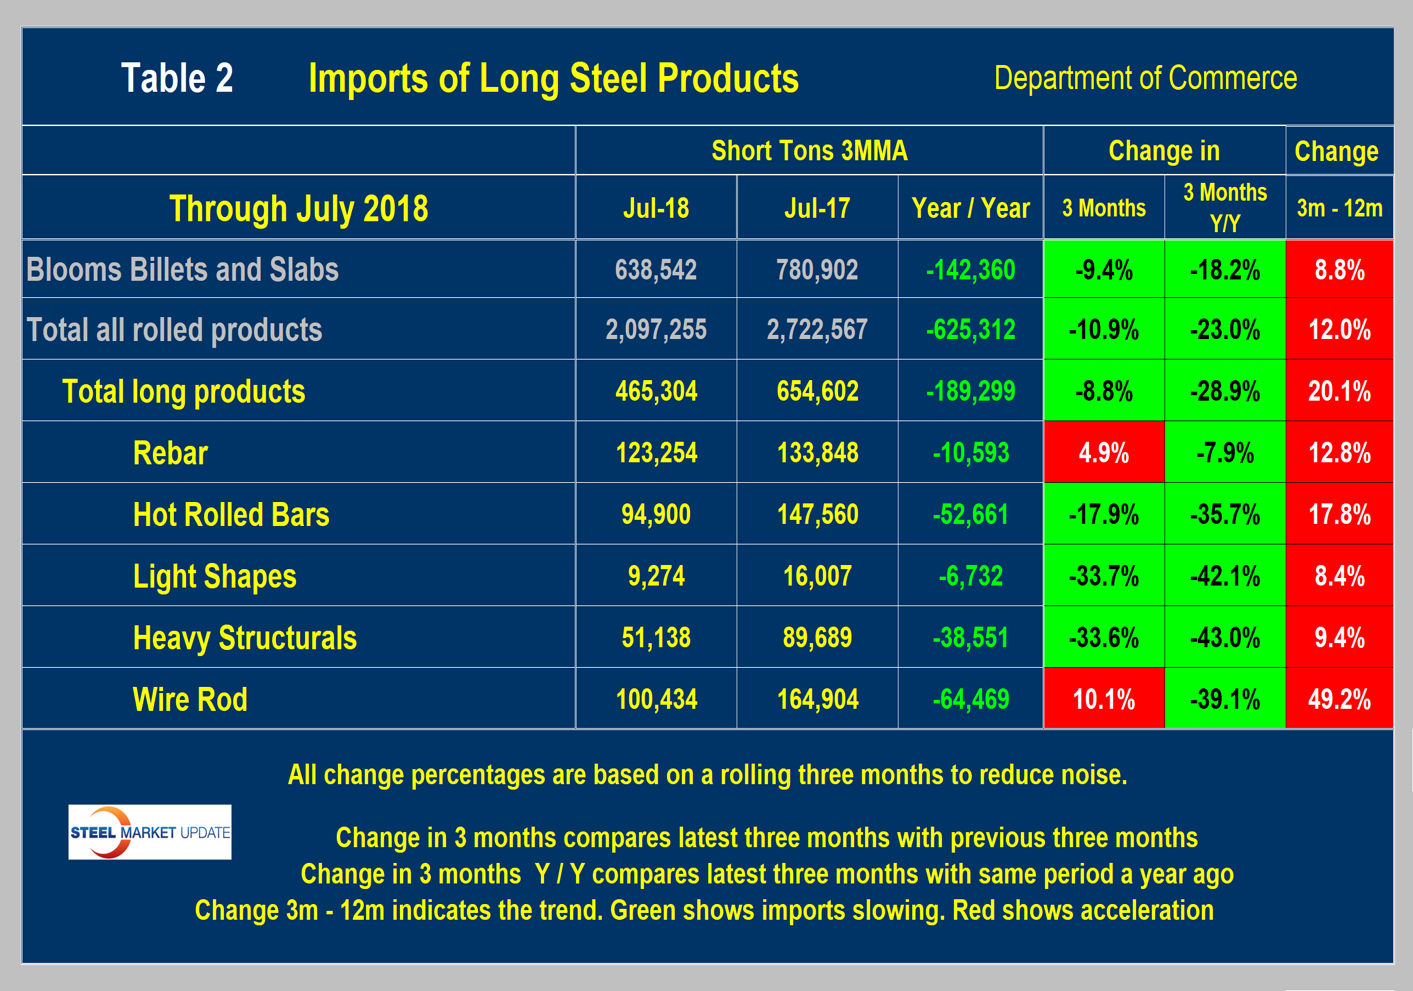
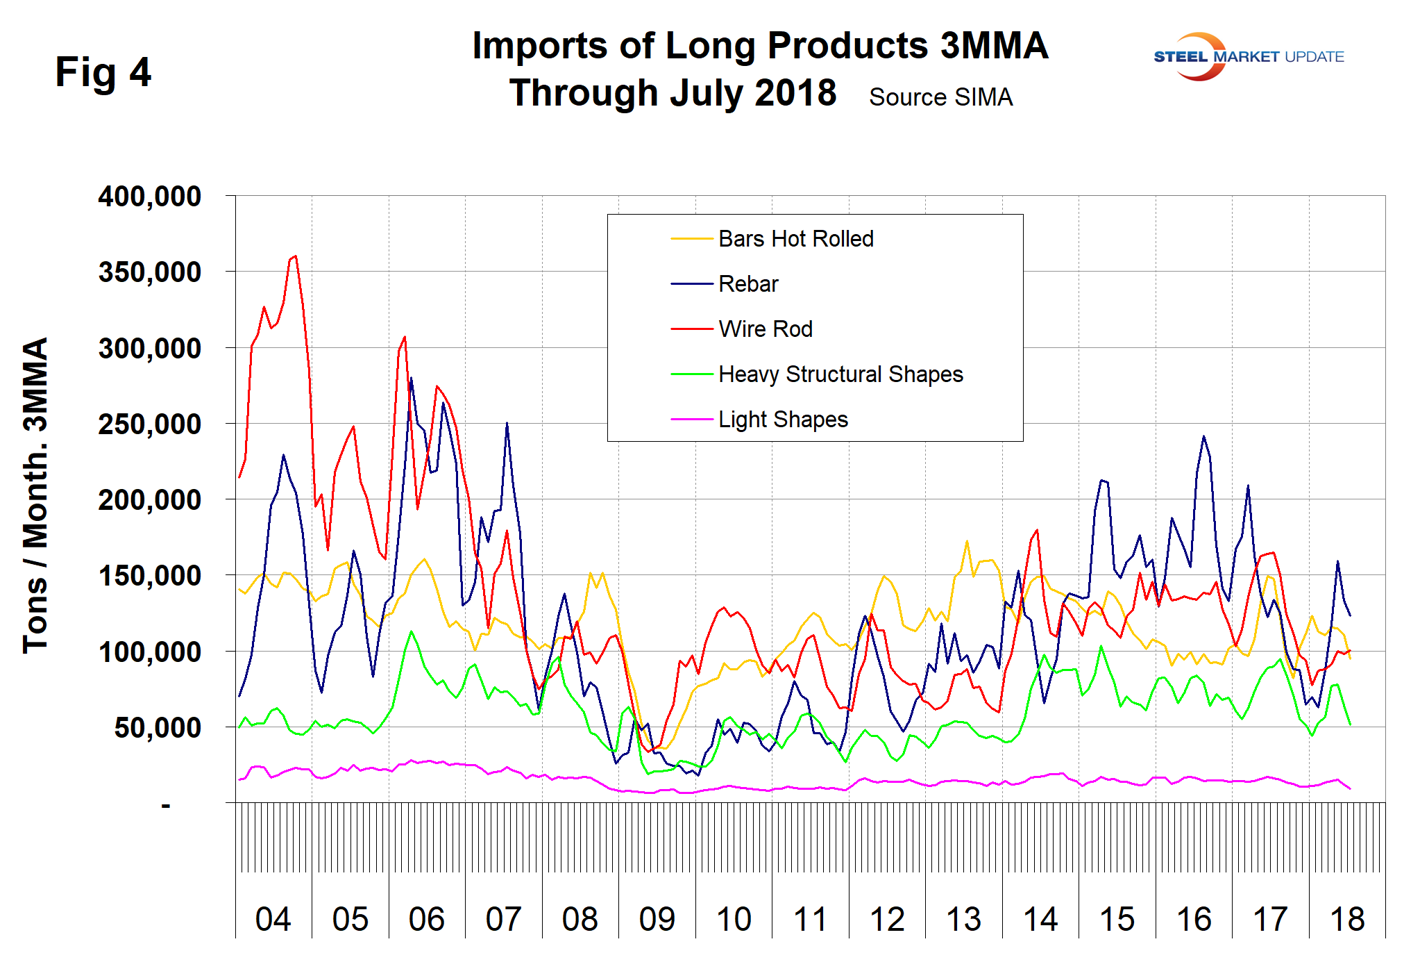
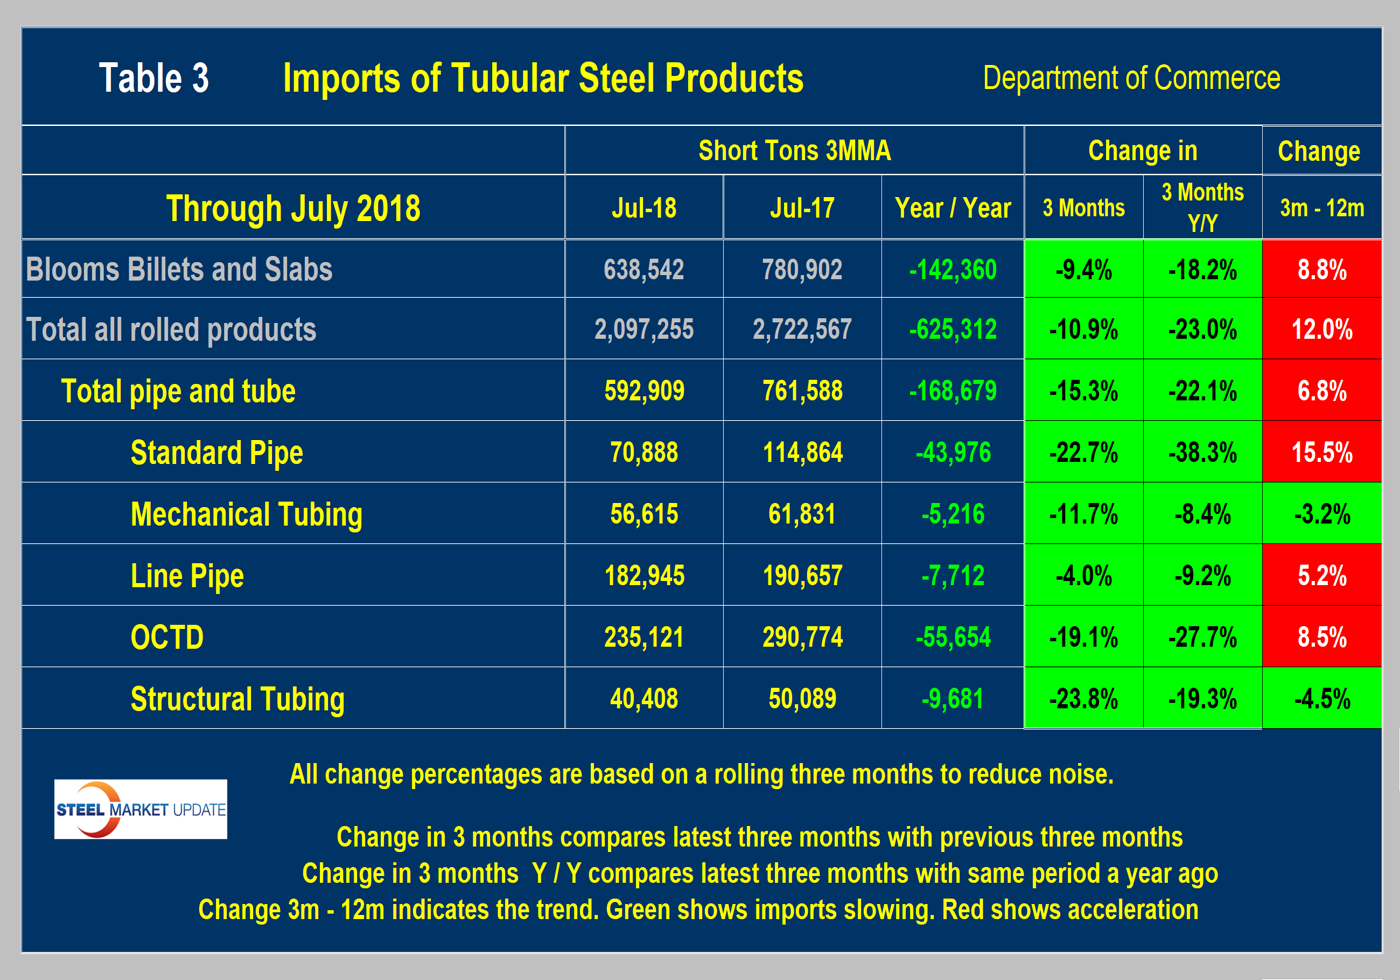
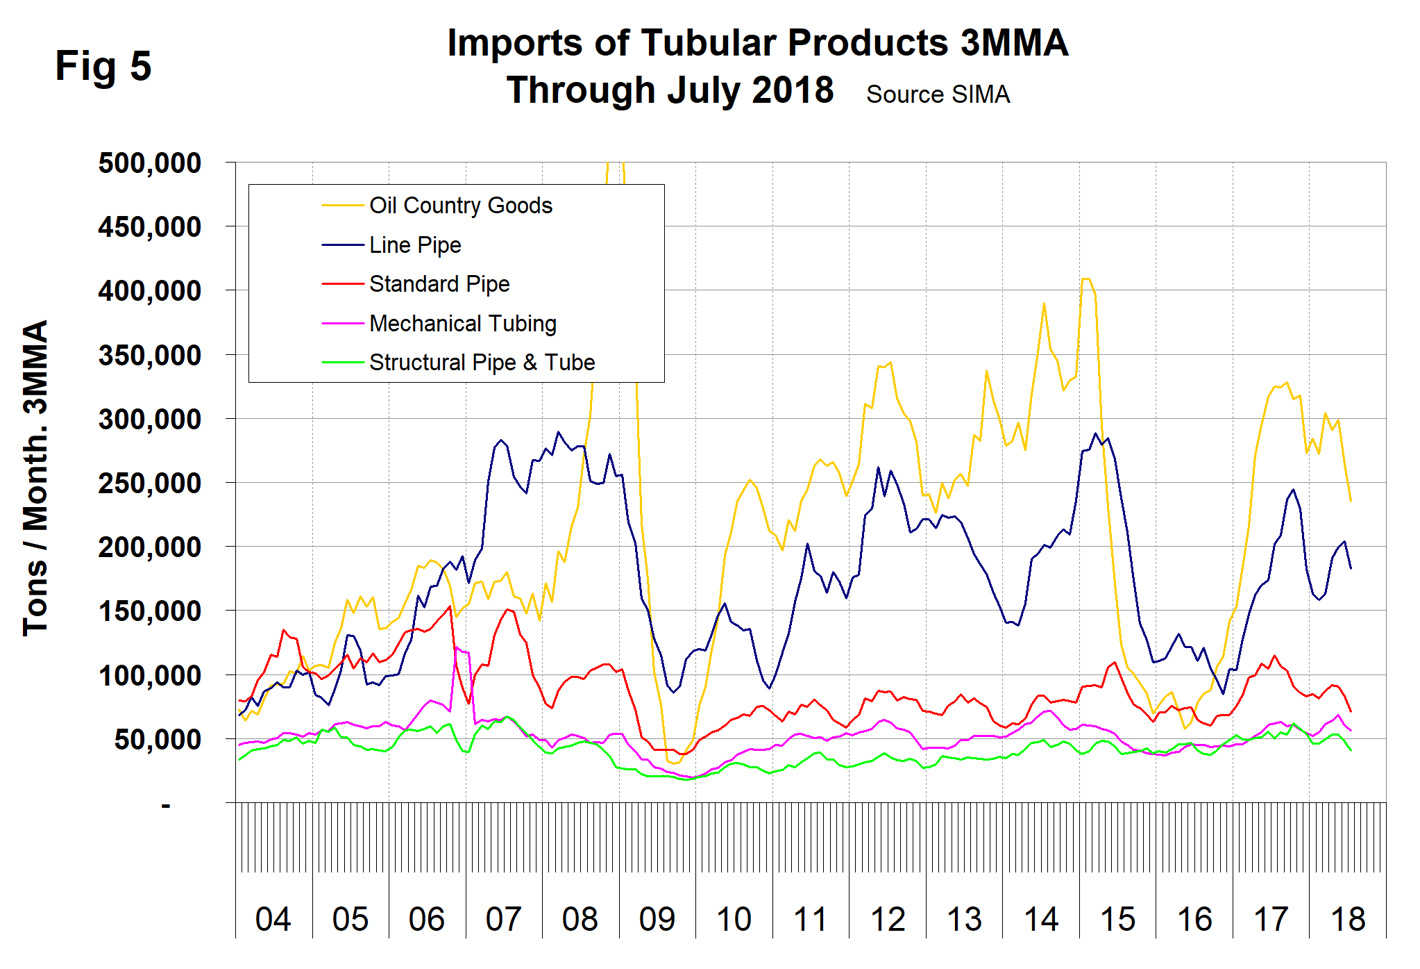
Table 3 shows that for tubular products the 3M/3M volume was down by 15.3 percent and the year-over-year volume was down by 22.1 percent. All individual products were down in both time frames. Figure 5 shows the history of tubular imports since 2004.
Explanation: SMU publishes several import reports ranging from this very early look using license data to the very detailed analysis of final volumes by product, by district of entry and by source nation, which is available in the premium member section of our website. The early look is based on three-month moving averages using the latest license data, either the preliminary or final data for the previous month and final data for earlier months. We recognize that the license data is subject to revisions, but believe that by combining it with earlier months in this way gives a reasonably accurate assessment of volume trends by product as early as possible. The main issue with the license data is that the month in which the tonnage arrives is not always the same month in which the license was recorded. In 2014, we conducted a 12-month analysis to evaluate the accuracy of the license data compared to final receipts. This analysis showed that the licensed tonnage of all carbon and low alloy products was 2.3 percent less than actual receipts, close enough to confidently include license data in this current update. The discrepancy declined continuously during the 12-month evaluation as a longer period was considered.
Statement from the Department of Commerce: The Steel Import Monitoring and Analysis (SIMA) system of the Department of Commerce collects and publishes data of steel mill product imports. By design, this information gives stakeholders valuable information on steel trade with the United States. This is achieved through two tools: the steel licensing program and the steel import monitor. All steel mill imports into the United States require a license issued by the SIMA office. The SIMA Licensing System is an online system for importers to register, apply for and receive licenses in a timely manner. In addition to managing the licensing system, SIMA publishes near-real-time aggregate data on steel mill imports into the United States. These data incorporate information collected from steel license applications and publicly released Census data. The data are displayed in tables and graphs for users to analyze. Additionally, SIMA provides data on U.S. steel mill exports, as well as imports and exports of select downstream steel products.


