

Prices

March 14, 2019
Foreign Steel Imports Still Falling
Written by Brett Linton
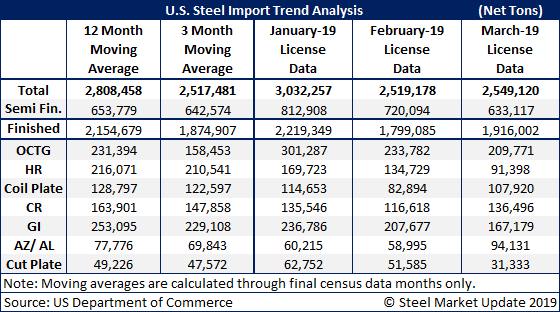
Total foreign steel imports are on the decline as license data from the U.S. Department of Commerce has February imports at 2.5 million net tons. Based on license data through March 12, it appears March imports will also be in that same vicinity. To put this into perspective, imports for February 2018 were 2,478,000 net tons and March 2018 was 3,333,000 net tons.
Semi-finished steels continue to be the largest single item being imported (by the domestic steel mills). We are seeing reductions in most flat rolled and plate products compared to the 3-month and 12-month moving averages.
Hot rolled imports have dropped significantly over the past few months. February licenses are indicating import levels of 134,729 net tons, down from January’s 169,723 net tons and well below both the 3-month and 12-month moving averages, which were 210,541 and 216,071, respectively. March is trending towards HRC imports of around 100,000 net tons, and we will have to do some research in the archives to see how far back we need to go to see imports down that low.
Cold rolled imports are down slightly from their 3-month and 12-month moving averages (see table below).
Galvanized is trending lower in February and March based on license data, while Galvalume is moving higher (seasonal issue with the product) and seems to be holding at levels similar to one year ago.
Galvanized Supplier Changes Year-Over-Year
SMU did a quick check of the galvanized imports to see if there have been any significant changes in the countries importing GI to the U.S. during the first few months of 2019 vs. one year ago.
Canada continues to be the largest exporter of galvanized to the United States despite the tariffs (probably automotive). Last year, the first three months averaged 90,000 net tons per month. This year, that number is approximately 66,000 net tons based on our analysis of the license data (and projecting March based on the first 12 days of licenses).
Which nation was a decent-sized supplier last year, but not so much this year? Turkey is essentially a non-player in 2019 as is Russia (zero in 2019), and Taiwan is about half what it was a year ago.
On the other side – which countries’ tonnages have grown in a big way compared to the first three months of 2018? Brazil is quadruple the tons it shipped one year ago. Austria is larger, as is Mexico, and South Africa had a couple of good months (January and February) but nothing showing for March to date.
Please note: The 2019 data shown in our table is based on U.S. DOC license data and are not the final Census numbers. This means there can be fluctuations (+/- 100,000 tons or so) in the January and February numbers. The March numbers show the trend based on licenses received through the 12th of March.


