

Market Data

September 29, 2019
SMU Steel Buyers Sentiment Index: Optimism Takes a Hit
Written by Tim Triplett
Steel Market Update’s Buyers Sentiment Index saw a big change this week—and not for the better—with Current Sentiment dropping by 23 points to a reading of +29 and Future Sentiment dropping by 20 points to a reading of +31. Even though the +29 and +31 readings are within the optimistic range of our index, both are the least optimistic measurements of buyer sentiment in nearly six and a half years, since mid-2013. At this time last year, both indexes registered +61.
SMU believes the negative reaction is based on a number of factors:
- The continuing decline in flat rolled and plate steel pricing after a short upward bounce.
- Stress related to questionable demand within some market sectors.
- Steel mills’ inability to control supply in relationship to demand.
- Unease with the current political situation in the United States.
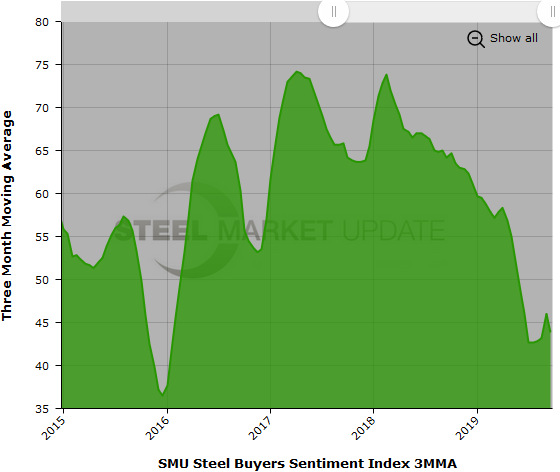
The goal of SMU’s Buyers Sentiment Index is to measure how buyers and sellers of steel feel about their company’s ability to be successful today (Current Sentiment Index), as well as three to six months into the future (Future Sentiment Index). Results are posted as both single data points and as three-month moving averages (3MMAs) to smooth out the trend.
Measured as a 3MMA, Current Sentiment is near its recent low at +43.83. The peak for the Current 3MMA was +74.17 in April 2017.
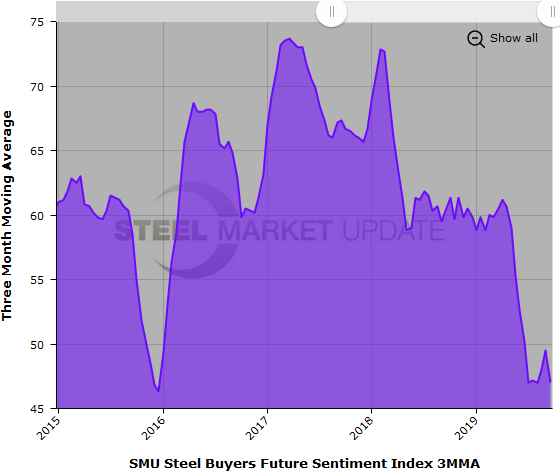
Future Sentiment
Respondents were asked to assess their chances for success in three to six months. Measured as a 3MMA, the Future Sentiment Index averaged +47.00 in the latest data. Future 3MMA peaked at 73.67 in March 2017.
Note that all the current readings are above zero and on the optimistic half of SMU’s scale. Therefore, industry sentiment overall remains more positive than negative, from a historical perspective. But the declining steel prices, signs of weakening demand and the conflict in Washington over trade and partisan politics appear to be weighing heavily on the attitudes of many steel executives.
What Our Respondents Had to Say
“Demand is starting to soften rapidly.” Manufacturer/OEM
“Our customers are beginning to experience a slowdown of incoming orders. Backlogs are decreasing at an alarming rate.” Manufacturer/OEM
“Margins continue to shrink, with prices sinking. There will be another six months of terrible margin pressure.” Service Center/Wholesaler
“I really don’t see any strong downward turn. I would like to see margins move higher, but every time we try, we find someone willing to sell 10 percent under the market.” Service Center/Wholesaler
“Business is good.” Service Center/Wholesaler
“Trade action is killing my business. All the uncertainty and risk has many customers not participating in traditional trade, instead shifting to non-tariffed sources of supply. It’s not simple to switch supply due to trade channels or qualification processes, which takes time.” Trading Company
“I don’t see any changes in the aggressive assault on traditional trade.” Trading Company
About the SMU Steel Buyers Sentiment Index
SMU Steel Buyers Sentiment Index is a measurement of the current attitude of buyers and sellers of flat rolled steel products in North America regarding how they feel about their company’s opportunity for success in today’s market. It is a proprietary product developed by Steel Market Update for the North American steel industry.
Positive readings will run from +10 to +100 and the arrow will point to the righthand side of the meter located on the Home Page of our website indicating a positive or optimistic sentiment. Negative readings will run from -10 to -100 and the arrow will point to the lefthand side of the meter on our website indicating negative or pessimistic sentiment. A reading of “0” (+/- 10) indicates a neutral sentiment (or slightly optimistic or pessimistic), which is most likely an indicator of a shift occurring in the marketplace.
Readings are developed through Steel Market Update market surveys that are conducted twice per month. We display the index reading on a meter on the Home Page of our website for all to see. Currently, we send invitations to participate in our survey to more than 500 North American companies. Our normal response rate is approximately 110-150 companies. Of those responding to this week’s survey, 37 percent were manufacturers and 45 percent were service centers/distributors. The balance was made up of steel mills, trading companies and toll processors involved in the steel business. Click here to view an interactive graphic of the SMU Steel Buyers Sentiment Index or the SMU Future Steel Buyers Sentiment Index.


