

Market Data
October 1, 2019
SMU Analysis: Key Market Indicators Through September
Written by Peter Wright
The net situation changed little from August but the Treasury 10/2 yield spread became slightly positive on Sept. 27 and the SMU Steel Buyers Sentiment Index suffered a serious setback on Sept. 15.
This report is designed to be a big picture summary of data on which we have reported in detail during the month. In it we summarize 36 data streams that describe the state of the steel market and provide forward guidance for steel buyers and sellers. See the end of this piece for an explanation of the Key Indicators concept. This will explain the difference between our view of the present situation, which is subjective, and our analysis of trends, which is based on the latest facts available.
![]()
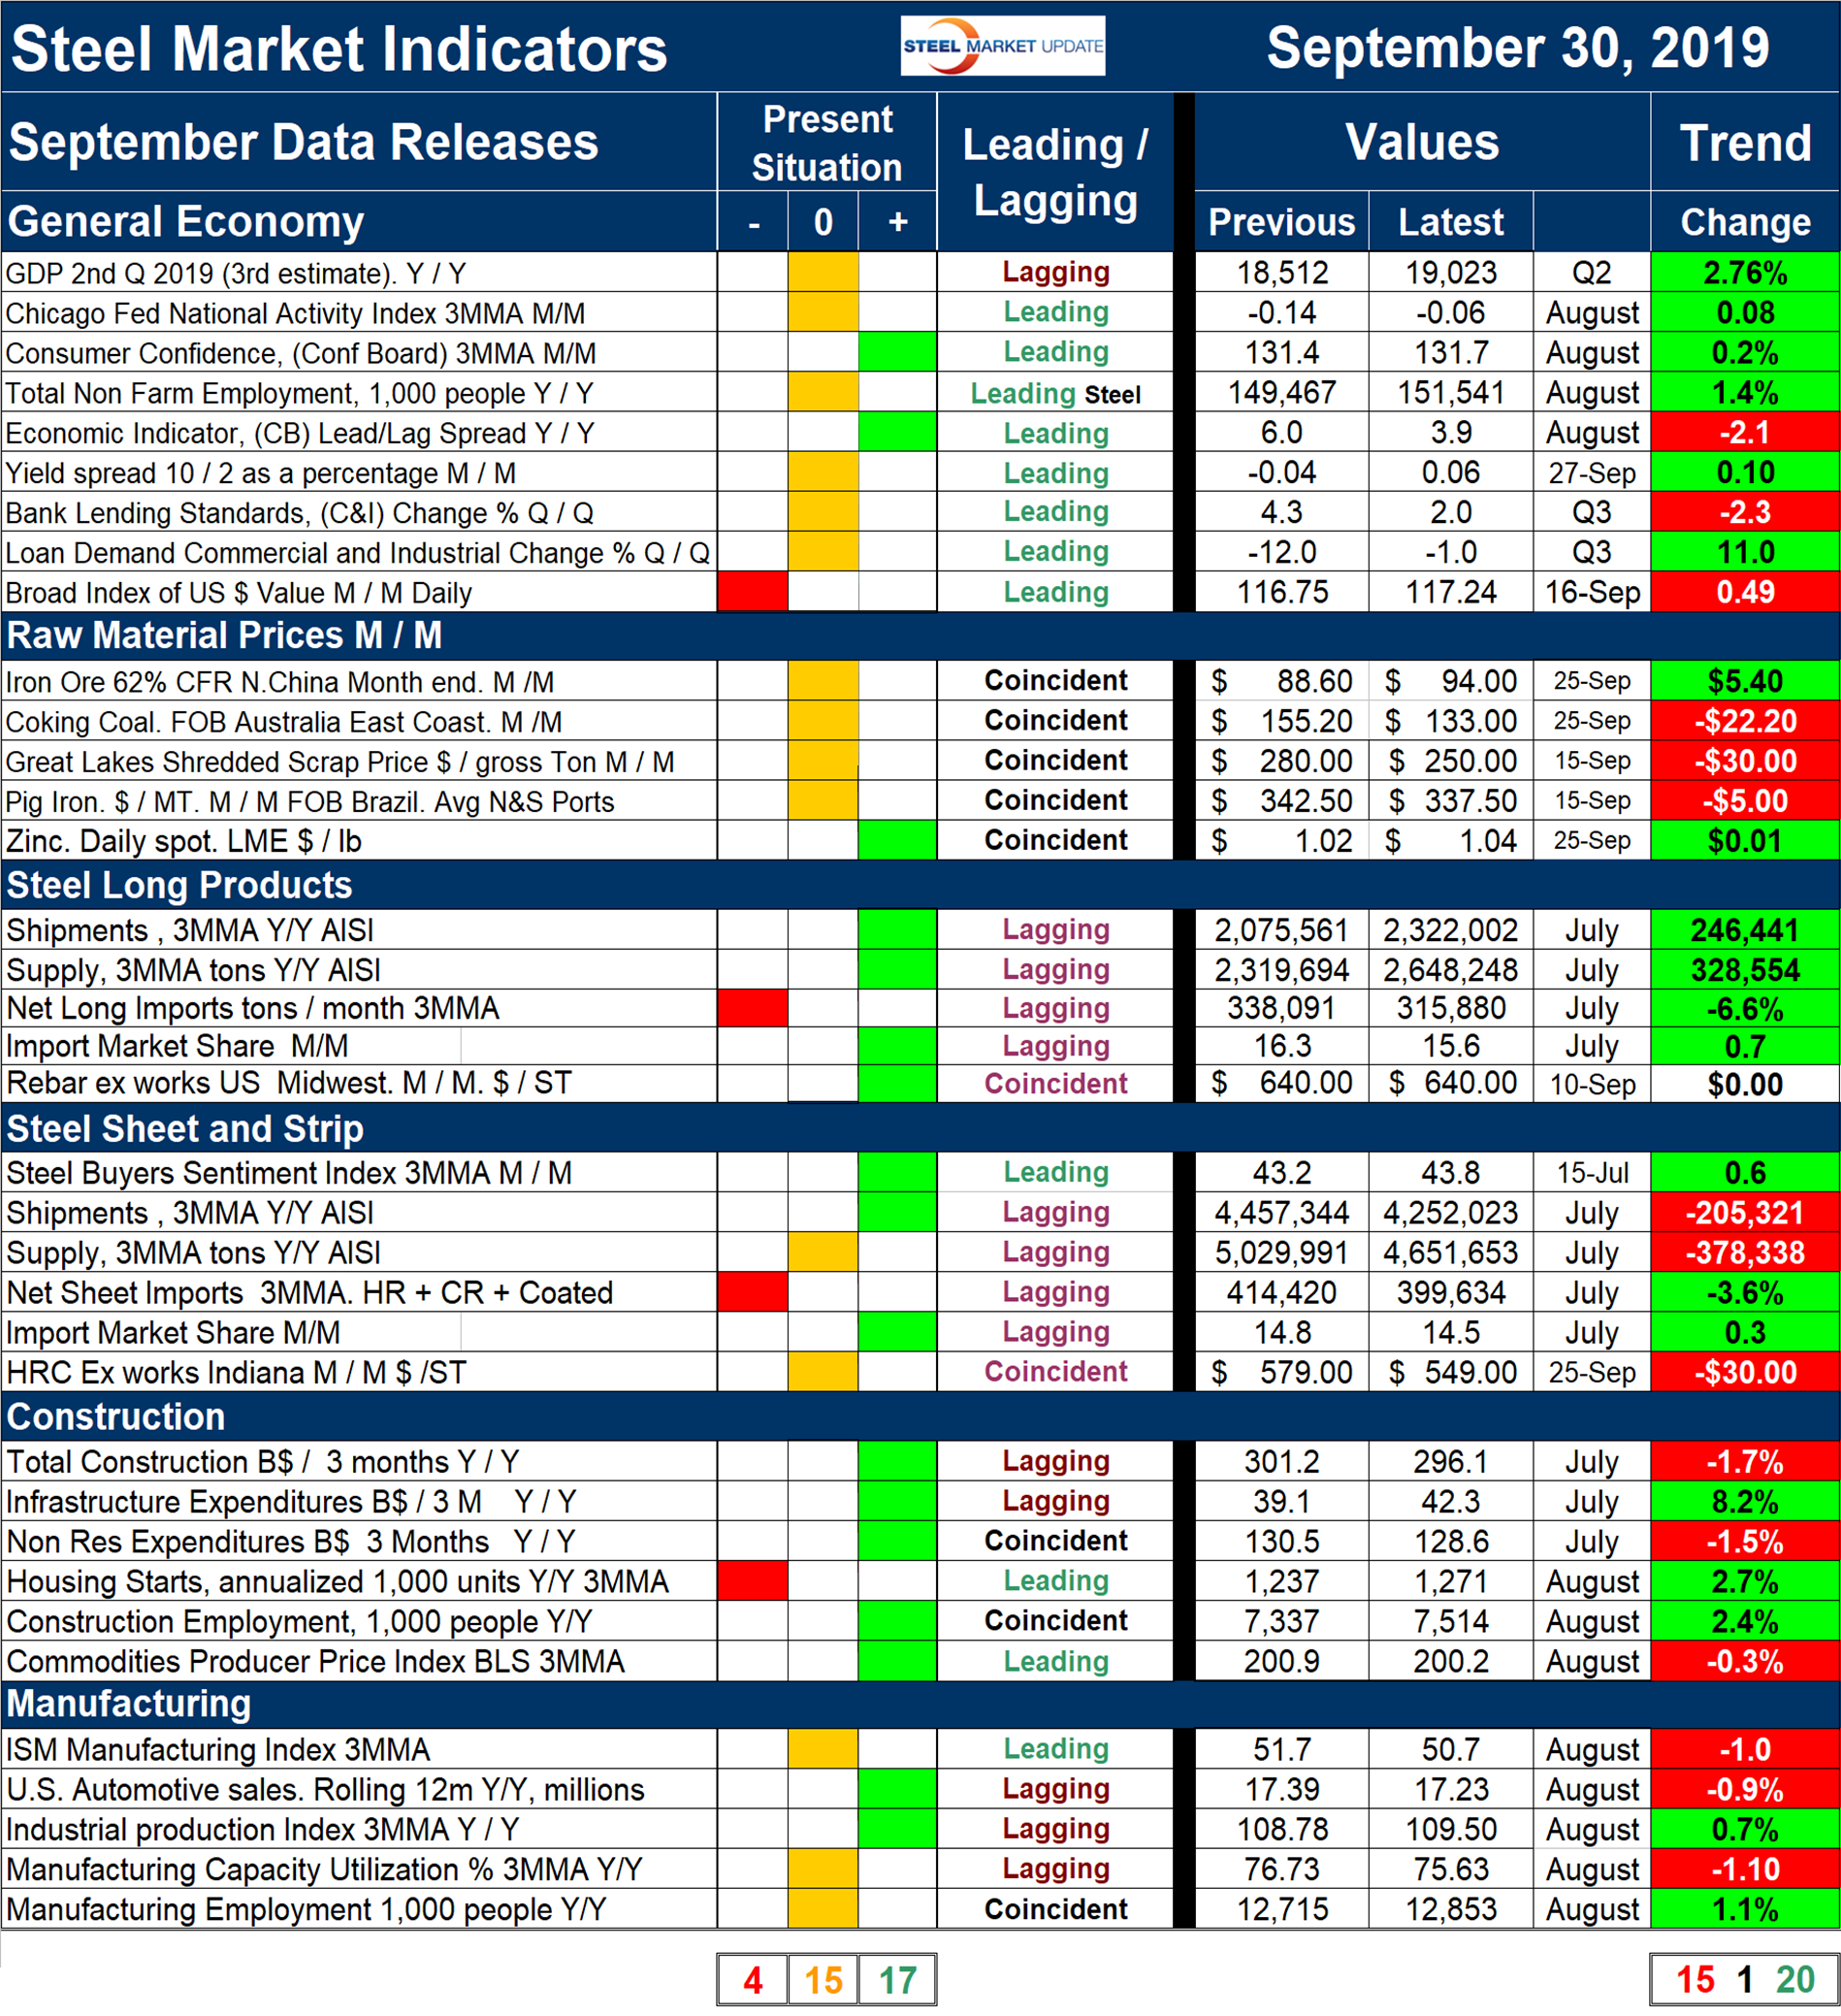
Please refer to Table 1 for our view of the present situation and the quantitative measure of trends. Readers should regard the color codes in the present situation column as a visual summary of the current market condition. The “Trend” columns of Table 1 are also color coded to give a quick visual appreciation of the direction the market is headed. All results are the latest available as of Sept. 30, 2019.
Present Situation
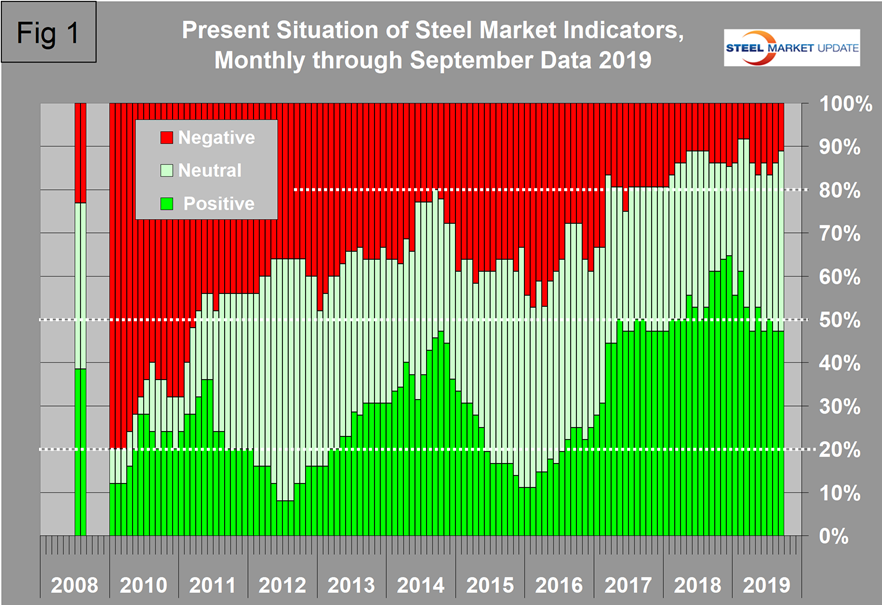
Our view of the September data is that the number of indicators we regard as strong has been hovering around 50 percent for the last seven months with only 11 percent being weak in September. The balance are in the historical mid-range (normal). Figure 1 shows the history of our view of the present situation data since January 2010 on a percentage basis and on the far left of the chart is the September 2008 situation immediately before the recession struck the steel business in September that year. Our view of the September data is that of the 36 indicators, 17 are currently positive, 15 are normal and four are negative. This was a decrease of one negative, and an increase of one normal since our August update. Our intent in using the word normal is to say that this indicator is in the mid-range of historical data. The only change in the September data was that the yield spread improved slightly and became positive.
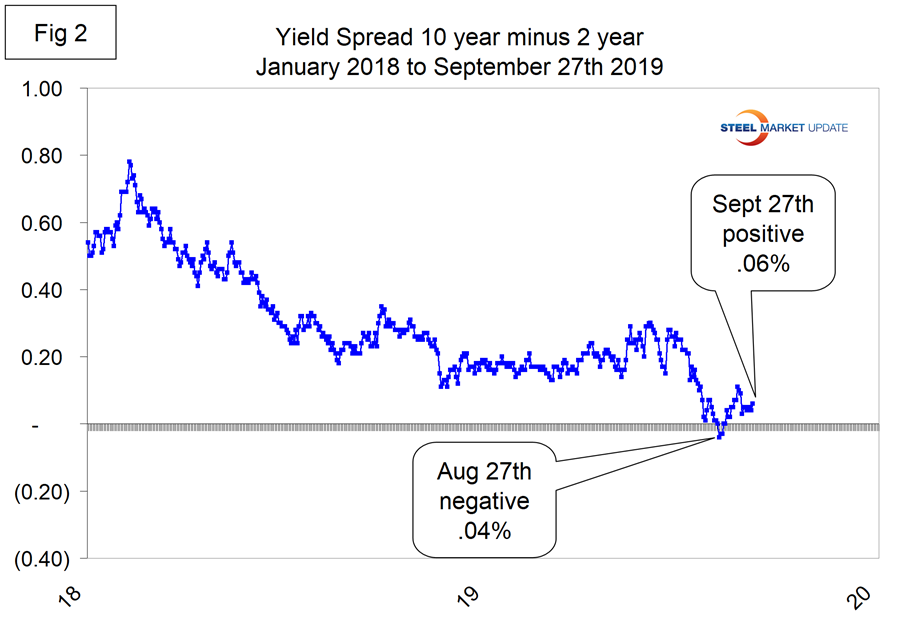
The Treasury yield spread, 10 year minus two year, dipped into negative territory for three days at the end of August. Historically, a negative yield spread has been a predictor of recession within 18 months. On Sept. 29 the value was positive 0.06 percent (Figure 2). The negative duration was so short and the negativity so small that maybe we have dodged the recession prediction for now. The last time the 10/2 spread was negative was June 6, 2007.
There were no other changes in our view of the present situation in September.
Trends
Most values in the trends columns are three-month moving averages (3MMA) to smooth out what can be very erratic monthly data. Trend changes in the individual sectors are described below together with some general comments. (Please note that in most cases this is not September data but data that was released in September for previous months.)
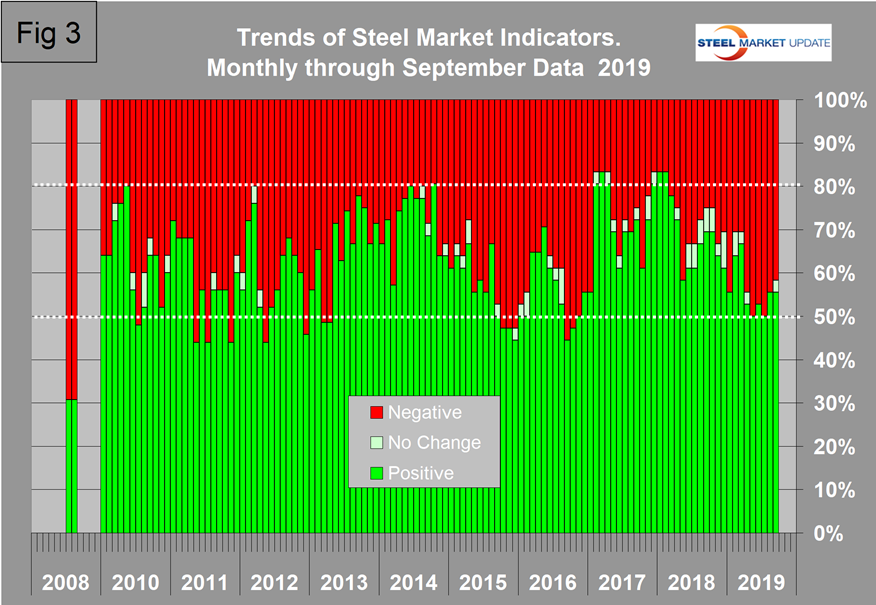
Figure 3 shows the trend of the trends and the pre-recession situation at the far left of the chart. In September 2019, 20 indicators were trending positive and 15 negative with one unchanged from August. Twelve indicators reversed direction in the September data resulting in a net decrease of one negative and one indicator was numerically unchanged. Four of those reversals were in the raw materials section where the price of coking coal continued its downward trend. Iron ore and zinc prices reversed direction and trended positive, and scrap and pig iron prices did the reverse. The import market share of both long and sheet products reversed direction and trended positive. The price of hot rolled coil ex works Indiana declined by $30 per ton after increasing by $26 in August. Three of the six construction indicators reversed direction and trended negative in September. These were total and nonresidential construction expenditures and the producer price index of commodities. In August all six of the construction indicators were trending positive; in September only three maintained that distinction. There were no trend reversals of the five manufacturing indicators, but only two trended positive in both August and September.
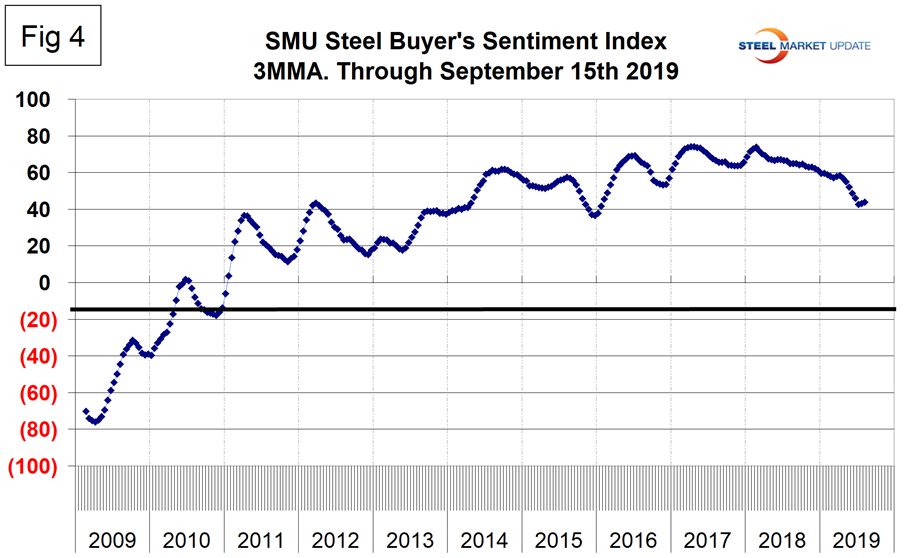
As a reality check for this report we include here Figure 4, which is SMU’s Steel Buyers Sentiment index. Readings are developed during the twice monthly SMU market surveys. SMU Steel Buyers Sentiment is a measure of the current attitude of North American buyers and sellers of flat rolled products regarding their company’s opportunity for success in today’s market. A reading above the neutral point of zero indicates that a preponderance of buyers have a positive attitude. The index has been deteriorating since mid-February last year. The mid-September value was still positive 43.8, down from a peak of 73.8 in February 2018, but up slightly from mid-August. This is a three-month moving average, which obscures the fact that the standalone mid-September result experienced a significant decline to 29.0, which was the least optimistic result in nearly six and a half years. This measure is more current than the majority of the 36 indicators considered in this study, so is definitely a cause for concern.
We believe a continued examination of both the present situation and direction is a valuable tool for corporate business planning. Figures 1 and 3 both show the pre-recession situation in September 2008. The trends analysis shows that the steel market was going over a cliff, but the actual values of the indicators at that time were still good with only 23 percent registering as historically negative.
Explanation: The point of this analysis is to give both a quick visual appreciation of the market situation and a detailed description for those who want to dig deeper. It describes where we are now and the direction the market is headed and is designed to describe the situation on a specific date. The chart is stacked vertically to separate the primary indicators of the general economy, of raw material prices, of both sheet and long product market indicators, and of construction and manufacturing indicators. The indicators are classified as leading, coincident or lagging as shown in the third column.
Columns in the chart are designed to differentiate between where the market is today and the direction it is pointing. Our evaluation of the present situation is subjectively based on our opinion of the historical value of each indicator. There is nothing subjective about the trends section, which provides the latest facts available on the date of publication. It is quite possible for the present situation to be predominantly red and trends to be predominantly green or vice versa depending on the overall situation and direction of the market. The present situation is subdivided into: below the historical norm (-), (OK), and above the historical norm (+). The “Values” section of the chart is a quantitative definition of the market’s direction. In most cases, values are three-month moving averages to eliminate noise. In cases where seasonality is an issue, the evaluation of market direction is made on a year-over-year comparison to eliminate this effect. Where seasonality is not an issue, concurrent periods are compared. The date of the latest data is identified in the third values column. Values will always be current as of the date of publication. Finally, the far-right column quantifies the trend as a percentage or numerical change with color code classification to indicate positive or negative direction.


