

Prices

October 10, 2019
SIMA: Steel Import License Data for September
Written by Peter Wright
In September, the licensed import volume of rolled steel products was the lowest since February 2011, according to Steel Market Update’s analysis of the latest Steel Import Monitoring and Analysis (SIMA) data.
Total rolled product imports in September declined by 15.5 percent year over year on a three-month moving average (3MMA) basis. This follows the 11.8 percent decline in August on the same basis.
This early look at September’s import volume is based on Commerce Department license data (see explanation below.) This import analysis includes all major steel sectors: sheet, plate, longs and tubulars, with a total of 18 subsectors. We now publish an import market share analysis for the same 18 steel product groups. All volumes in this analysis are reported in short tons. We use three-month moving averages rather than single-month results to smooth out monthly variability.
![]()
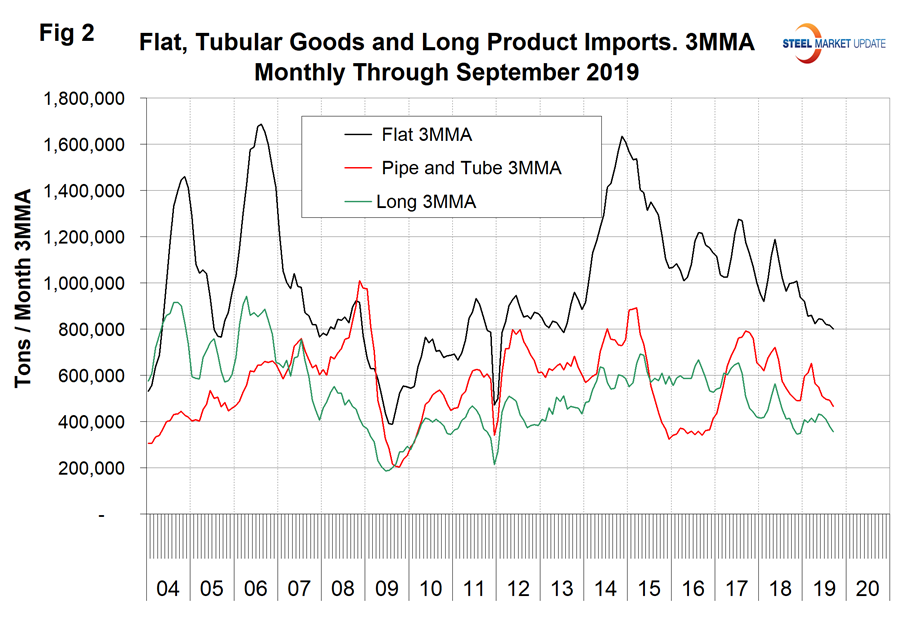
Imports of total rolled products in September were the lowest since February 2011 and the 3MMA was also the lowest since then. In the 12 months August 2018 through August 2019, total rolled product imports on a 3MMA basis were consistently in the range of 1.70 to 1.94 million tons. The September total rolled product volume broke out of that range to the downside at 1.64 million tons. Year over year on a 3MMA basis, sheet products were down by 18.0 percent, plate products were down by 28.4 percent, long products were down by 17.0 percent and tubulars were down by 10.7 percent. Imports of flat rolled, tubulars and longs all had a recent peak in May last year. Since then total flat rolled (sheet + plate) imports have consistently declined, which may be tariff driven. This is not so obvious for longs and tubulars where the decline since May 2018 has been less consistent.
Figure 1 shows the tonnage of total rolled steel and semi-finished imports through September on a 3MMA basis. Total rolled product volume has been on an erratically downward trend since mid-2017. Imports of semi finished have been very erratic on a monthly basis since last May with five months over a million tons and seven months under 400,000 tons in that time period. September volume was 385,000 tons. This is why we use a 3MMA calculation in our analyses, the result of which is the much smoother line for semis in Figure 1. On this basis since January last year, the range has been 492,000 to 884,000 tons with September below the average with 591,000 tons. Evidently the Section 232 legislation has had no effect on semifinished product imports.
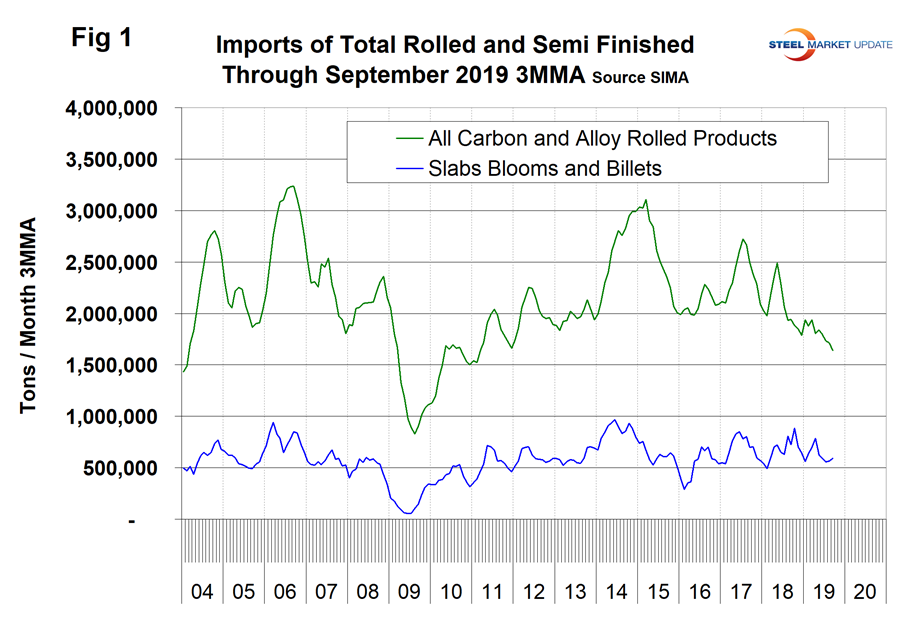
Figure 2 summarizes the import volume of flat rolled, tubular and long products since 2004 on a 3MMA basis. All three have been trending down since mid-2017.
There are three tables in this report. In each of them we show the 3MMA of the tonnage in September 2019 and September 2018 with the year-over-year change. We then calculate the percentage change in volume in the most recent three months with the previous three months. This month we are comparing July through September with April through June (3M/3M). The next column to the right shows the year-over-year change as a percentage. Declines are color coded green and increases are coded red. Finally, in the far-right column, we subtract the 12-month change from the three-month change. This is a way of describing the magnitude of the recent trend as a percentage. It is not unusual for the color code of the trend to be the opposite of the two time frame analyses.
Table 1 describes the imports of all major sectors of the sheet and plate markets. In the flat rolled sectors shown in Table 1, total sheet products were down by 18.0 percent and total plate products were down by 28.4 percent, both year over year. Within the sheet group, hot rolled was down the most and electrogalvanized the least. CTL plate was down by 10.7 percent and coiled plate down by 34.4 percent. Figures 3 and 4 show the history of sheet and plate product imports since January 2004.
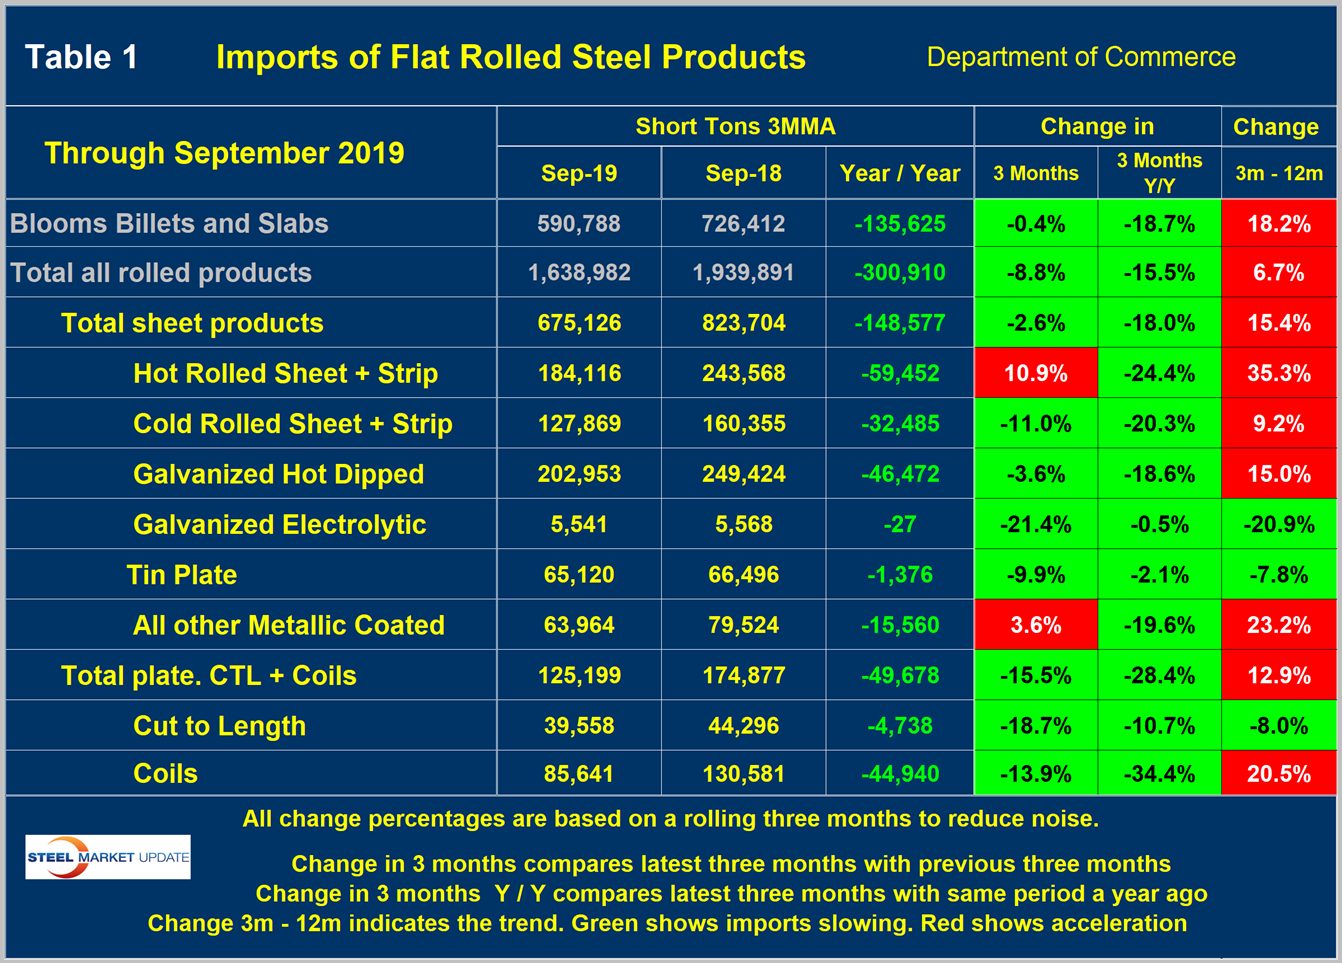
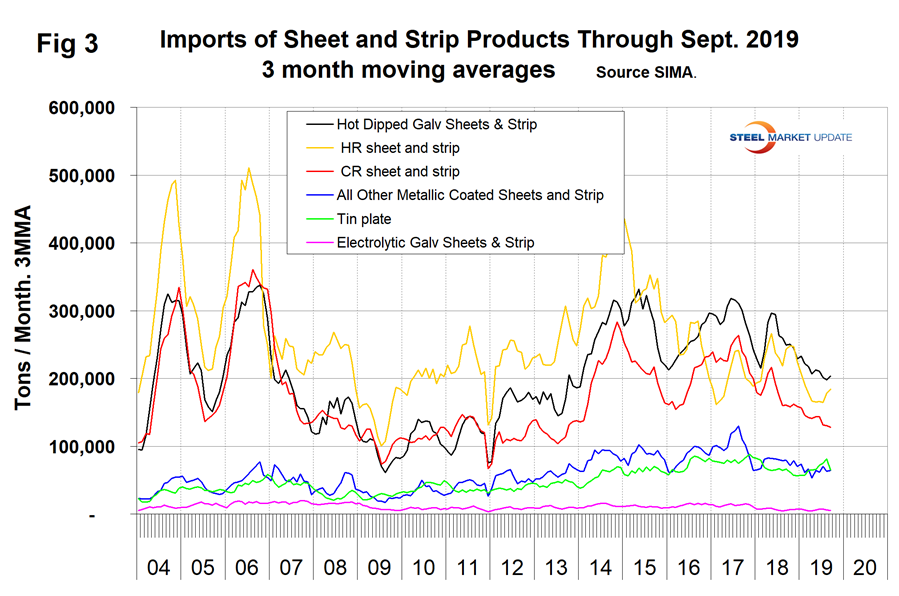
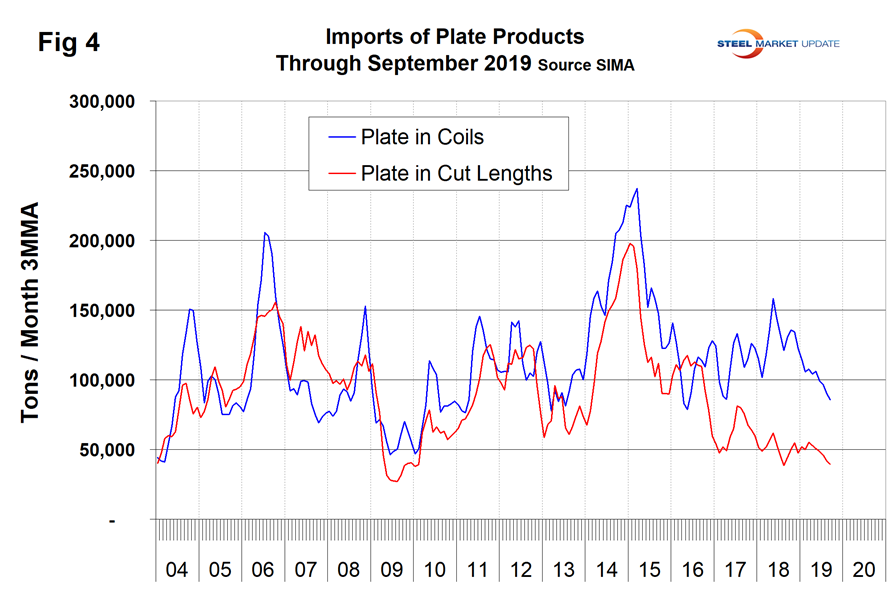
Table 2 shows the same analysis for long products where the year-over year volume was down by 14.0 percent in total. All products except light shapes and heavy structurals were down year over year. Figure 5 shows the history of long product imports.
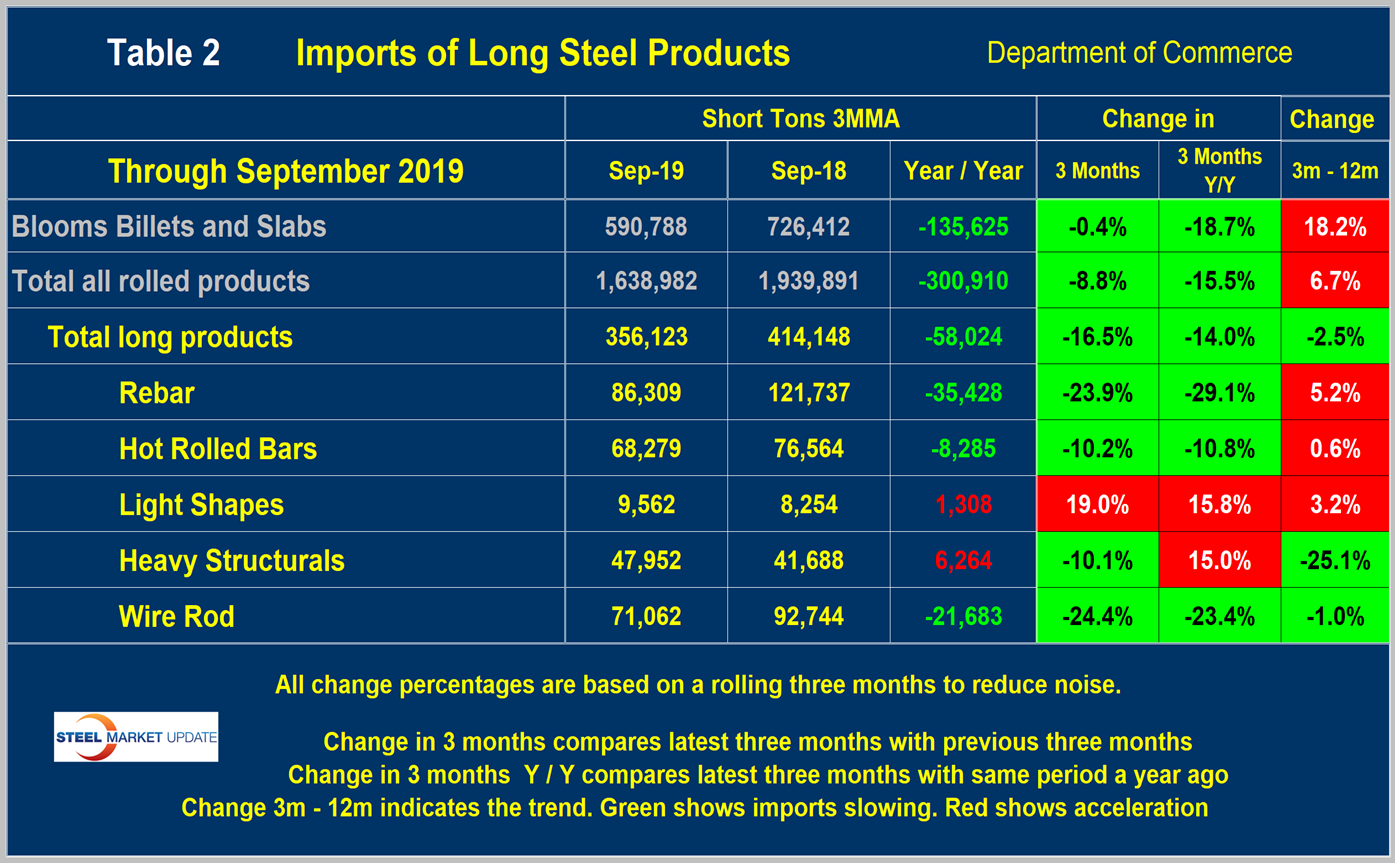
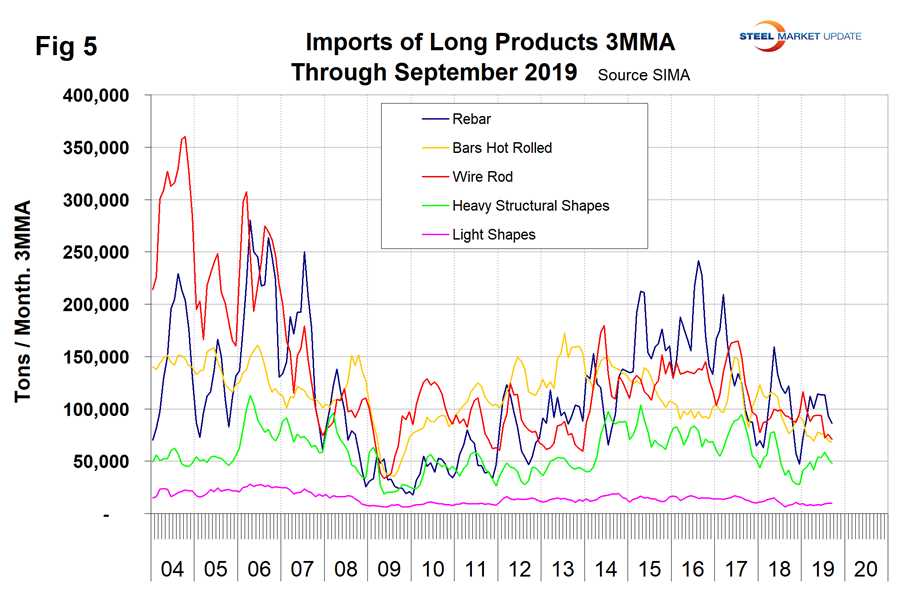
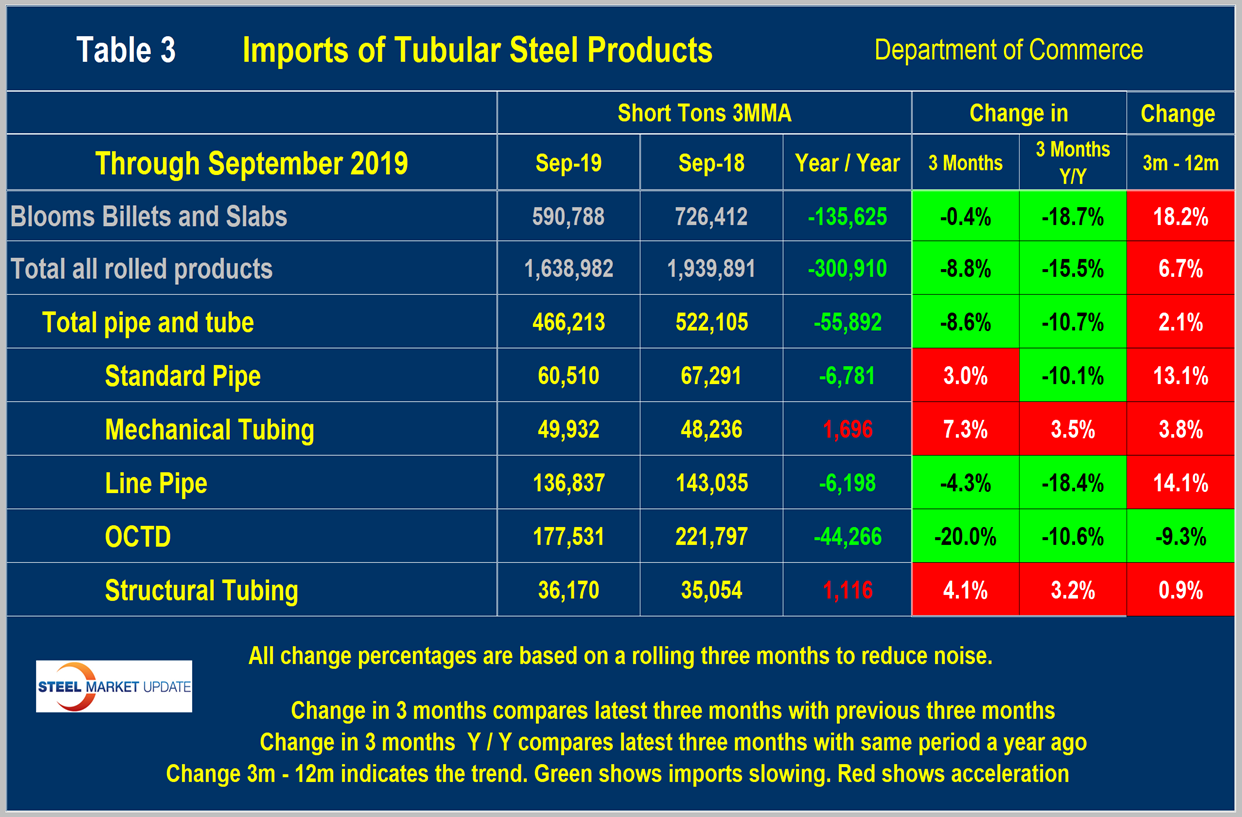
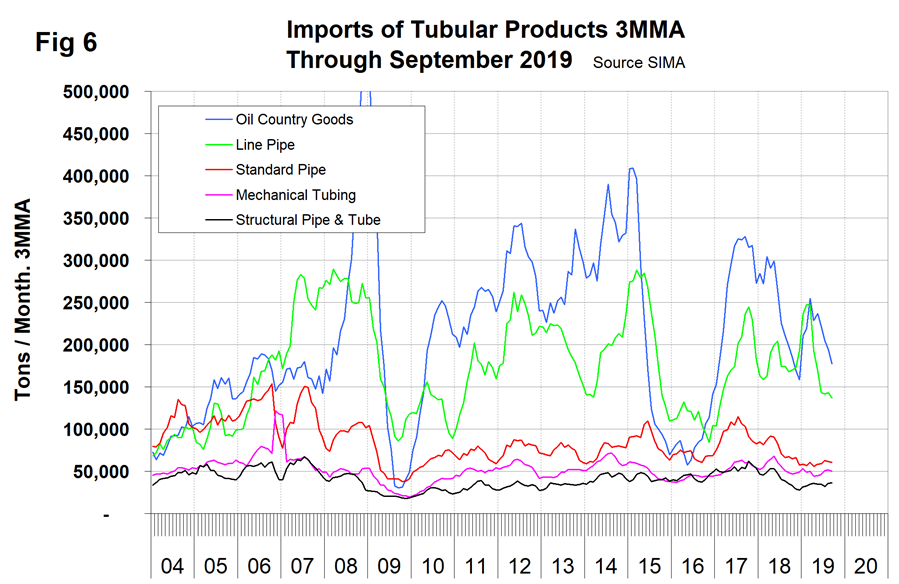
Table 3 shows that for tubular products in total the volume was down by 10.7 percent year over year with mechanical tubing and structural tubing being the only products to experience an increase. Once again line pipe was down the most. Figure 6 shows the history of tubular imports since January 2004.
Explanation: SMU publishes several import reports ranging from this very early look using license data to the very detailed analysis of final volumes by product, by district of entry and by source nation, which is available in the Premium member section of our website. The early look is based on three-month moving averages using the latest license data, either the preliminary or final data for the previous month and final data for earlier months. We recognize that the license data is subject to revisions but believe that by combining it with earlier months in this way gives a reasonably accurate assessment of volume trends by product as early as possible. The main issue with the license data is that the month the tonnage arrives is not always the same month in which the license was recorded. In 2014, we conducted a 12-month analysis to evaluate the accuracy of the license data compared to final receipts. This analysis showed that the licensed tonnage of all carbon and low alloy products was 2.3 percent less than actual receipts, close enough to confidently include license data in this current update. The discrepancy declined continuously during the 12-month evaluation as a longer period was considered.
Statement from the Department of Commerce: The Steel Import Monitoring and Analysis (SIMA) system of the Department of Commerce collects and publishes data of steel mill product imports. By design, this information gives stakeholders valuable information on steel trade with the United States. This is achieved through two tools: the steel licensing program and the steel import monitor. All steel mill imports into the United States require a license issued by the SIMA office. The SIMA Licensing System is an online system for importers to register, apply for and receive licenses in a timely manner. In addition to managing the licensing system, SIMA publishes near-real-time aggregate data on steel mill imports into the United States. These data incorporate information collected from steel license applications and publicly released Census data. The data are displayed in tables and graphs for users to analyze. Additionally, SIMA provides data on U.S. steel mill exports, as well as imports and exports of select downstream steel products.


