

Market Data

October 13, 2019
SMU Steel Buyers Sentiment Index: Signs of an Anxious Market
Written by Tim Triplett
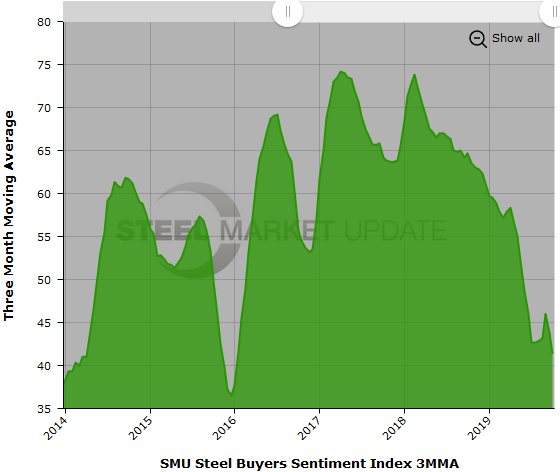
Steel Market Update’s Buyers Sentiment Index declined again this week to its lowest levels since 2013. Both Current and Future Sentiment have been trending steadily downward since April. The Current Sentiment reading of +26 is half the +52 recorded just one month ago and more than 40 points below levels at this time last year.
The goal of SMU’s Buyers Sentiment Index is to measure how buyers and sellers of steel feel about their company’s ability to be successful today (Current Sentiment Index), as well as three to six months into the future (Future Sentiment Index). Results are posted as both single data points and as three-month moving averages (3MMAs) to smooth out the trend.
Measured as a 3MMA, Current Sentiment is at +41.33, it lowest reading since January 2016.
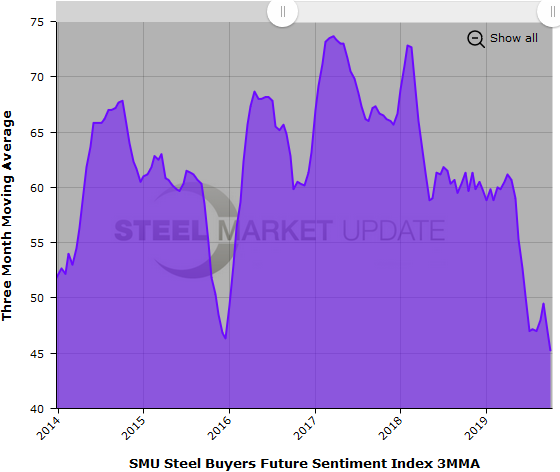
Future Sentiment
Buyers feel only slightly more positive about their prospects three to six months in the future. Future Sentiment as a single data point registered +35 in the latest data, down 16 points over the past month. The Future Sentiment 3MMA is +45.17, its lowest since July 2013.
To bring further perspective to these numbers, all the current readings are above zero and on the optimistic half of SMU’s scale, therefore more positive than negative from a historical view. Over the dozen years SMU has been tracking industry sentiment, readings have ranged from highs of +78 to lows of -85 during the Great Recession.
Not counting the years prior to 2011 that were impacted by the historic recession and thus were highly anomalous, quarterly sentiment has moved within a 60-point range, from roughly +14 to +74. Therefore, the recent 26-point drop is significant.
Although sentiment has been considerably more pessimistic at times in the past, the prevailing attitude among steel executives is somewhat troubling. While SMU has only anecdotal evidence, the timing of the latest dip in sentiment suggests that the current political strife in Washington is weighing heavily on the minds of most Americans, including steel executives. Add to that concerns about steel demand and declining steel prices, and the fourth quarter is getting off to a bearish start.
What Respondents Had to Say
“Trade uncertainties continue to make imports difficult, but now actual economic slowdown is affecting my key customers who have lower demand.” Trading Company
“Demand continues lower.” Service Center/Wholesaler
“Business is declining and margins are shrinking.” Manufacturer/OEM
“Demand is very concerning this early in Q4. Orders are down, and with expectations of steel pricing continuing to move lower, service centers are moving steel at very low prices to keep inventory turns high.” Manufacturer/OEM
“People are full of inventory, their business is slowing and prices are falling. It’s a bad trio!” Service Center/Wholesaler
“I don’t see the situation improving much, unless some event or stimulus improves demand, which is doubtful.” Trading Company
“Fourth-quarter orders will be much slower than previous quarters.” Manufacturer/OEM
“Outlook’s excellent, unless tariffs kill the markets.” Steel Mill
About the SMU Steel Buyers Sentiment Index
SMU Steel Buyers Sentiment Index is a measurement of the current attitude of buyers and sellers of flat rolled steel products in North America regarding how they feel about their company’s opportunity for success in today’s market. It is a proprietary product developed by Steel Market Update for the North American steel industry.
Positive readings will run from +10 to +100 and the arrow will point to the righthand side of the meter located on the Home Page of our website indicating a positive or optimistic sentiment. Negative readings will run from -10 to -100 and the arrow will point to the lefthand side of the meter on our website indicating negative or pessimistic sentiment. A reading of “0” (+/- 10) indicates a neutral sentiment (or slightly optimistic or pessimistic), which is most likely an indicator of a shift occurring in the marketplace.
Readings are developed through Steel Market Update market surveys that are conducted twice per month. We display the index reading on a meter on the Home Page of our website for all to see. Currently, we send invitations to participate in our survey to more than 500 North American companies. Our normal response rate is approximately 110-150 companies. Of those responding to this week’s survey, 36 percent were manufacturers and 46 percent were service centers/distributors. The balance was made up of steel mills, trading companies and toll processors involved in the steel business. Click here to view an interactive graphic of the SMU Steel Buyers Sentiment Index or the SMU Future Steel Buyers Sentiment Index.


