Market Data

October 15, 2019
Service Center Inventories and Shipments Report for September
Written by Estelle Tran
Steel Market Update’s analysis of flat rolled and plate inventories and shipments for the month of September:
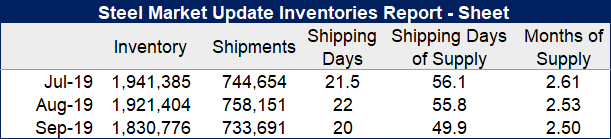
Flat Rolled = 49.9 Shipping Days of Supply
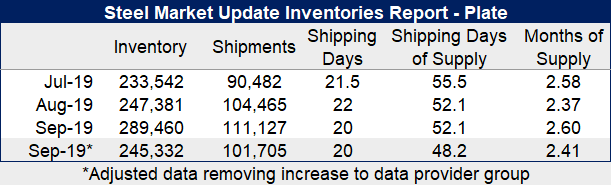
Plate Steels = 52.1 Shipping Days of Supply (48.2 adjusted)
Flat Rolled
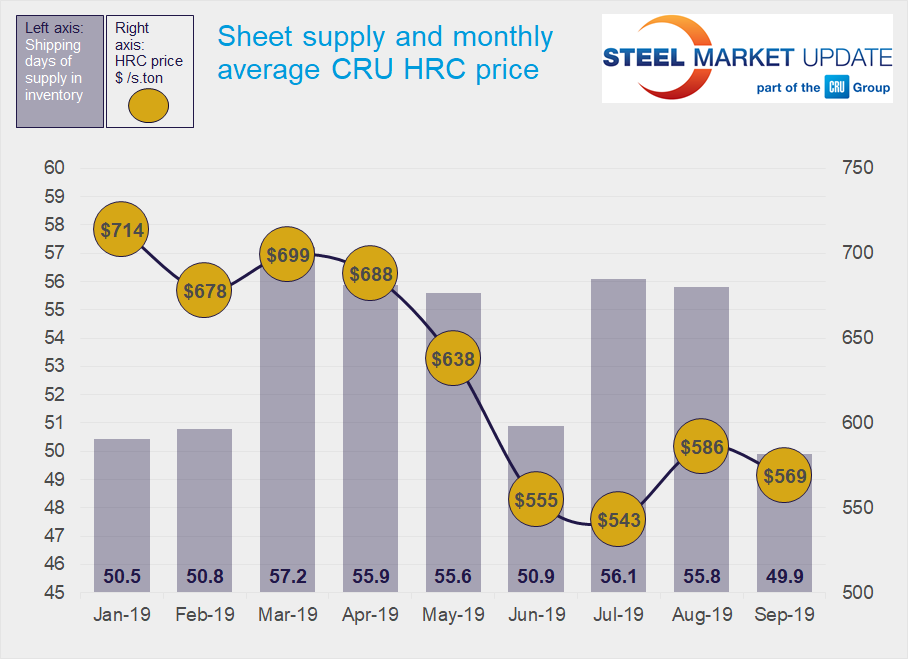
Service center inventories of flat-rolled steel dropped significantly in September, which the decrease in on-order volumes in August foretold. Service centers carried 49.9 shipping days of supply in September, down from 55.8 days in August. This translates to 2.5 months of inventory on hand in September, down from 2.53 in August.
There were 20 shipping days in September compared to 22 in August. While overall shipments went down in September, the daily shipping rate increased 9 percent month on month. There was no material change in the number of flat rolled data providers in September.
The on-order flat rolled volumes continue to fall with prices, and with inventories dwindling, the on-order volume represented a larger percentage of inventories in September.
The percentage of inventories committed to contracts decreased to 54.7 percent in September from 56.1 in August.
With sheet prices falling and mill lead times shortening, it is no surprise that service center inventory levels have dropped. At other points in the year when inventories fell to around 50 days of supply, mill price increases followed. However, given that there is no uptick in scrap or sheet demand seen in the very near term, it may be a little longer before the sheet price slide reverses.
Plate
Plate inventories appear to have grown in the final report, but the September plate figures account for an increase in the number of data providers. The shipping days of supply appear to be flat at 52.1, but with the incremental data taken out, the adjusted September figure would be 48.2 – down from 52.1 in August. Service centers carried 2.6 months of supply on hand at the end of September, though adjusted for the number of data providers, this would be 2.41 – compared to 2.37 in August. Plate inventories are still shrinking and are at the lowest levels seen this year.
Plate volumes on order dropped significantly in September, which reaffirms the ongoing concern that plate prices still have room to fall.
The percentage of stocked plate committed to contracts is hovering in the 36-37 percent range.