

Market Data

December 4, 2019
Global Steel Production Contracted in October
Written by Peter Wright
Global steel production contracted in October for the first time since March 2016, according to Steel Market Update’s analysis of OECD and WSA data.
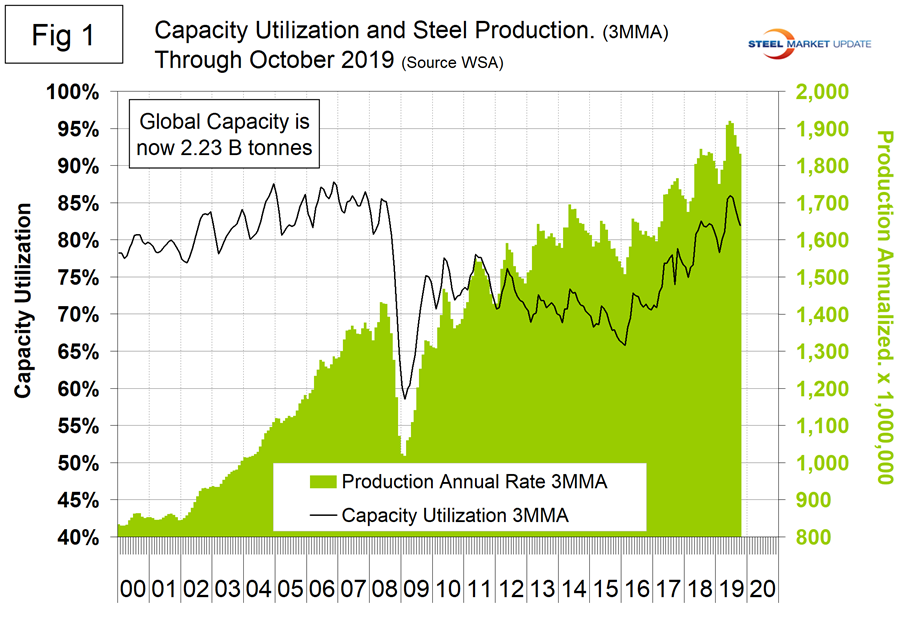
Figure 1 shows annualized monthly global steel production on a three-month moving average (3MMA) basis and capacity utilization since January 2000. Based on OECD data (see below), capacity utilization in October on a 3MMA basis was 81.4 percent, down from 86.0 percent in June. On a tons-per-day basis, production in October was 4.887 million metric tons, down from June’s all-time high of 5.298 million metric tons.
On average, global production on a tons-per-day basis peaked in the early summer in the years 2010 through 2016, but in 2017 and 2018 the second half downtrend was delayed until the fourth quarter. This year seems to have reverted to the norm with peak production in June. Figure 2 shows the average tons per day of production for each month since 2011. On average, October declined by 1.72 percent from September. This year October decreased by 2.98 percent.
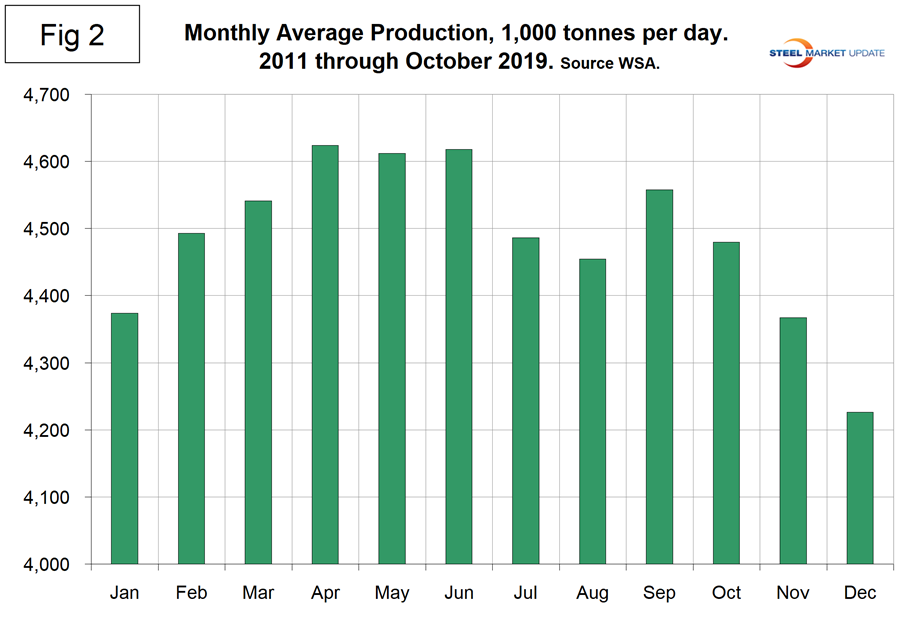
Figure 3 shows the year-over-year growth rate of the 3MMA of global production since January 2005. Growth in three months through October was negative 0.3 percent, down every month from 5.8 percent in April and May. This was the first negative growth month since March 2016. China had positive growth in October. The rest of the world growth of steel production was negative 4.5 percent in three months through October.
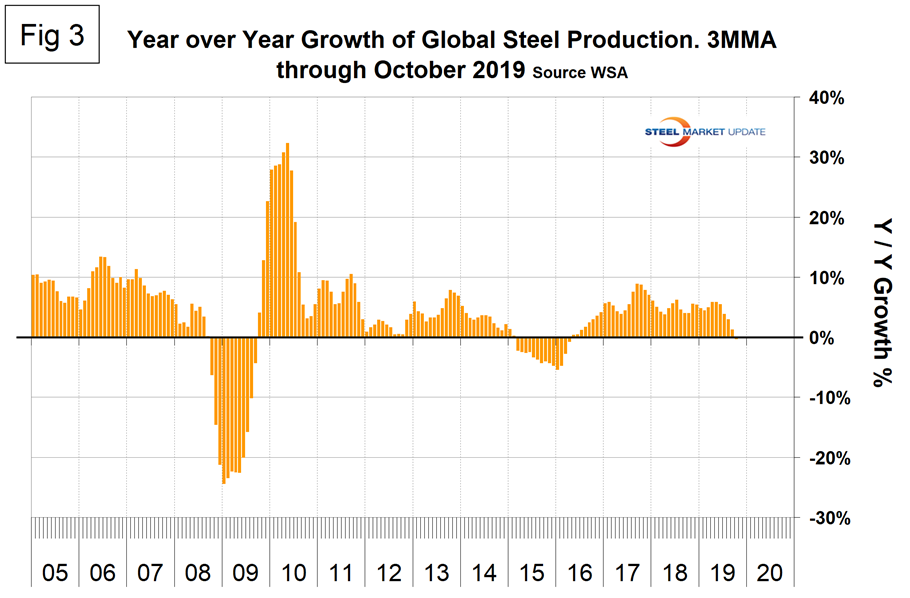
Table 1 shows global production broken down into regions, the production of the top 10 nations in the single month of October, and their share of the global total. It also shows the latest three months and 12 months of production through October with year-over-year growth rates for each period. Regions are shown in white font and individual nations in beige. The world overall had negative growth of 0.3 percent in three months and positive 3.5 percent in 12 months through October. When the three-month growth rate is lower than the 12-month growth rate, as it was each month in July through October, we interpret this to be a sign of negative momentum. On the same basis in October, China grew by 3.4 percent and 7.8 percent, and therefore also had negative momentum. All regions including Asia had negative growth in three months through October year-over-year. Table 1 shows that North America was down by 3.5 percent in the last three months. Within North America, production was down by 2.2 percent in the U.S., down by 4.5 percent in Canada and down by 7.6 percent in Mexico (Canada and Mexico are not shown in Table 1).
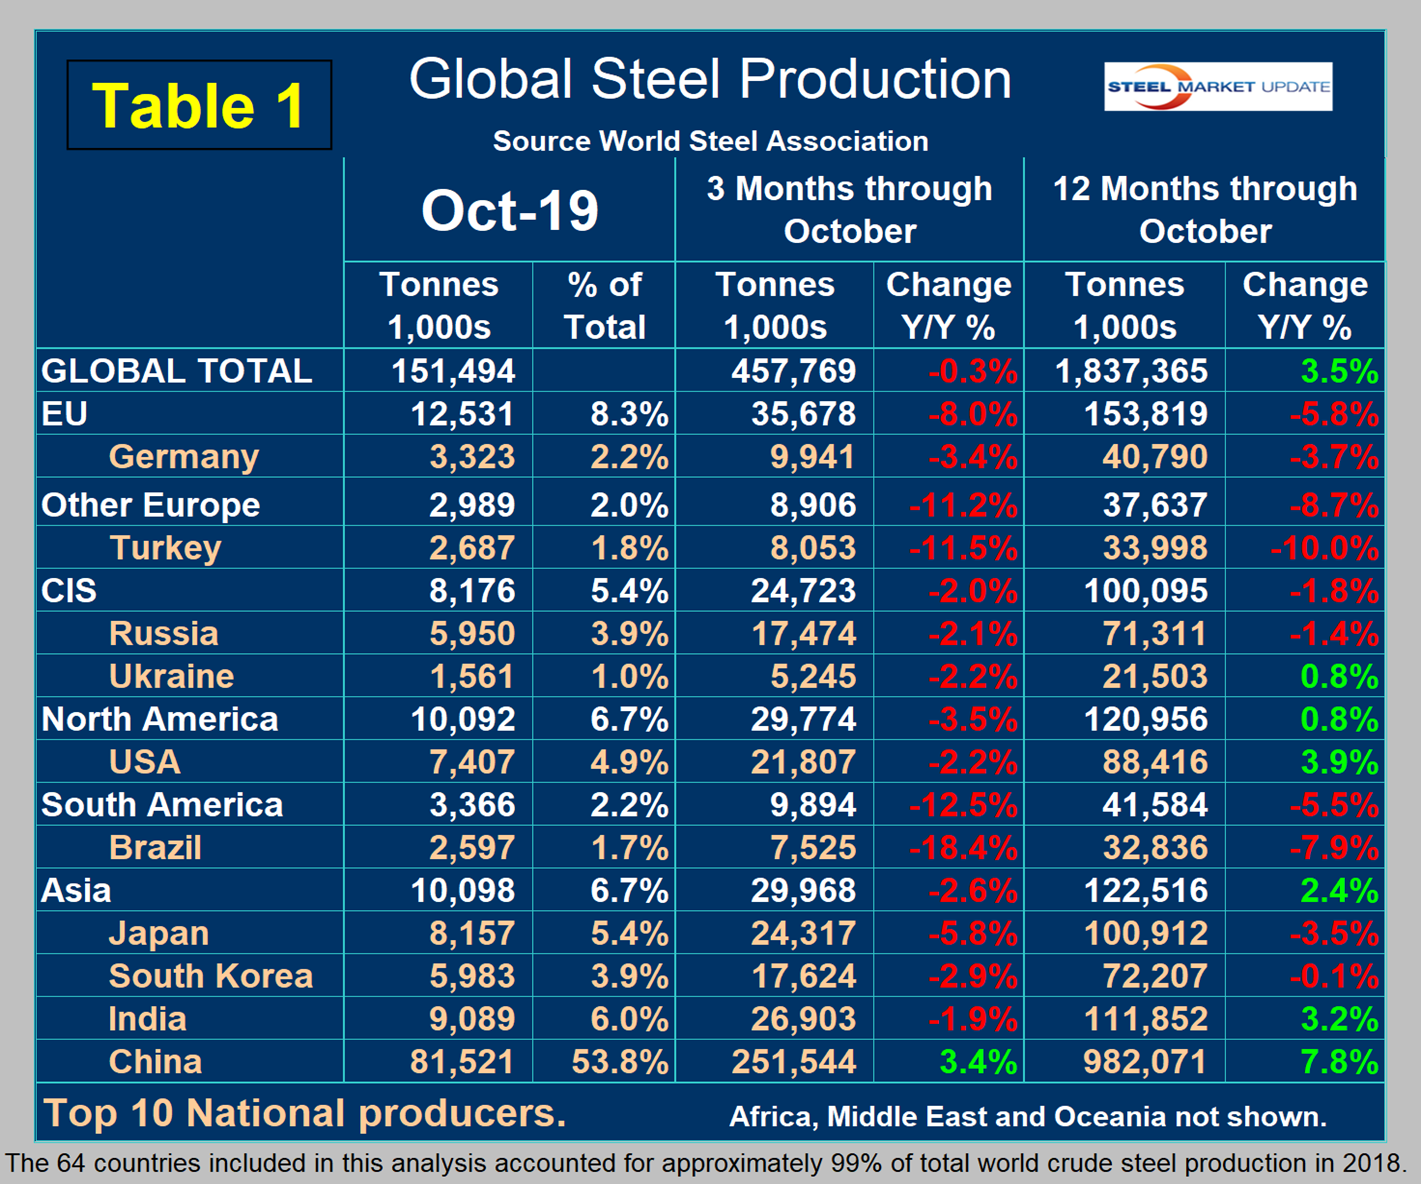
In the 12 months of 2018, 119.9 million metric tons were produced in North America of which 72.3 percent was produced in the U.S., 10.9 percent in Canada and 16.8 percent in Mexico. Based on the OECD data, U.S. capacity in 2018 was 112.6 million metric tons with a capacity utilization of 76.9 percent.
Figure 4 shows China’s production since 2005. As just stated, global steel production was down by 0.3 percent in three months through October year-over-year and China was up by 3.4 percent, both with negative momentum. The updated OECD data shows China’s capacity in 2018 to be 1,023,400,000 metric tons, while the WSA reported China’s production last year to be 924,752,000 metric tons, which yields a capacity utilization of 90.4 percent. That calculation doesn’t work for 2019 production because we don’t know the current capacity.
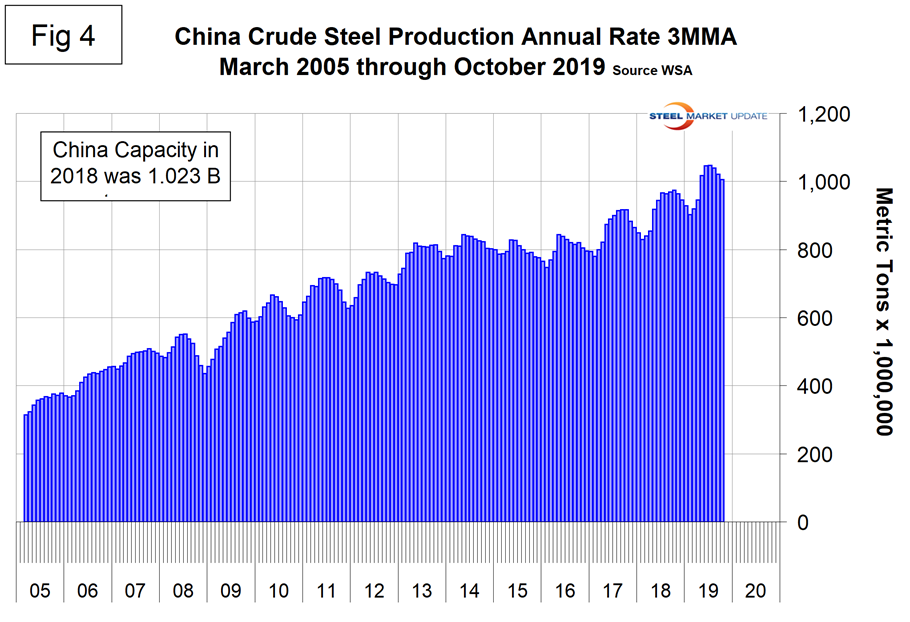
Figure 5 shows the growth of Chin’s steel production since January 2013 and Figure 6 shows the growth of global steel excluding China. China’s domination of the global steel market is increasing and in each month May through October had an annualized production rate of over one billion metric tons.
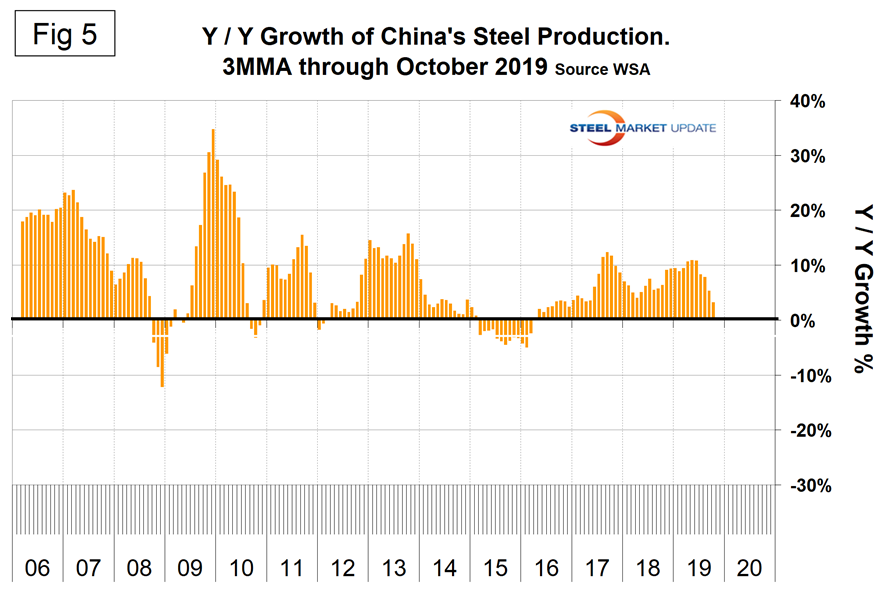
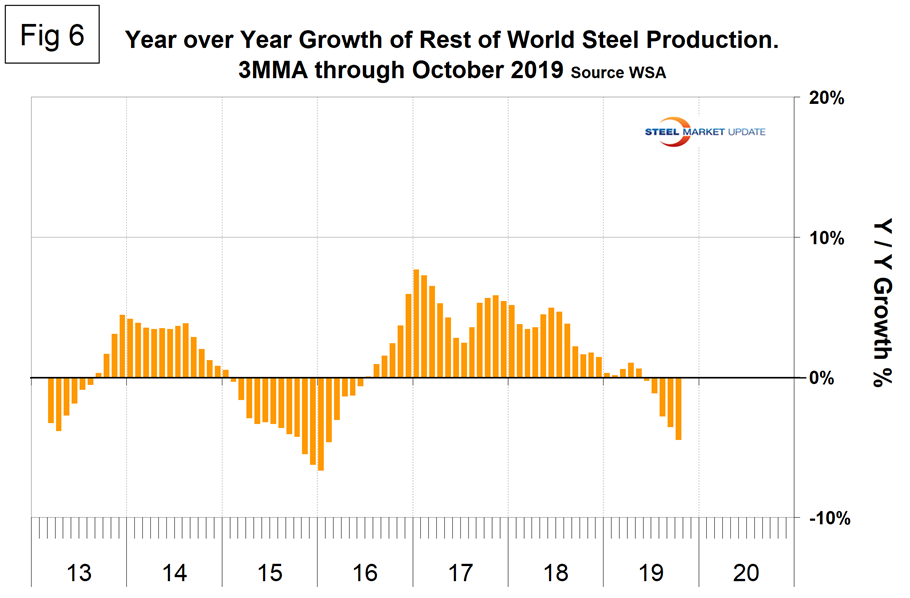
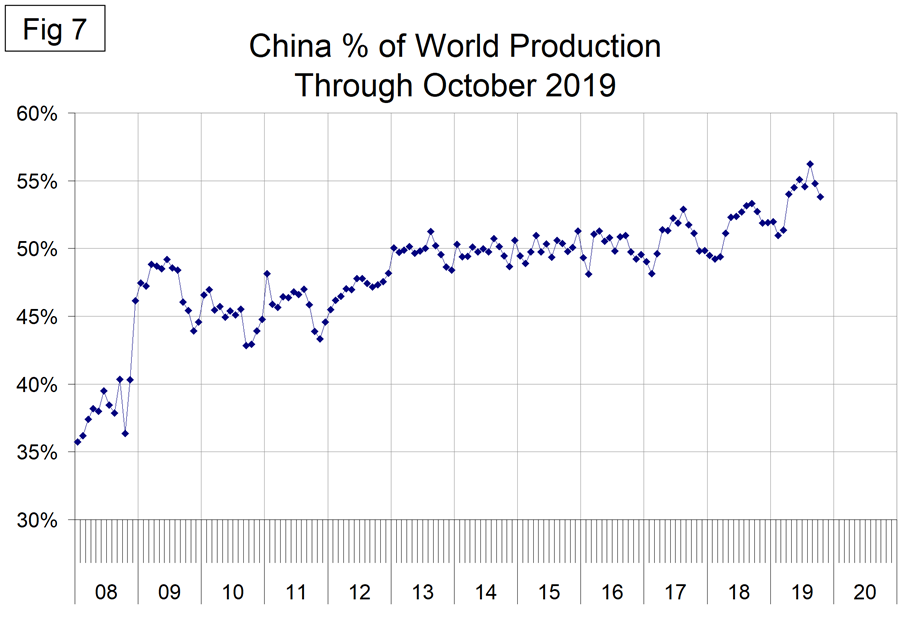
Figure 7 shows the growth of China’s share of global steel production, which in October was 53.8 percent, down from the all-time high of 56.2 percent in August.
The October 2019 WSA Short Range Outlook (SRO) for apparent steel consumption in 2019 and 2020 is shown by region in Figure 8.
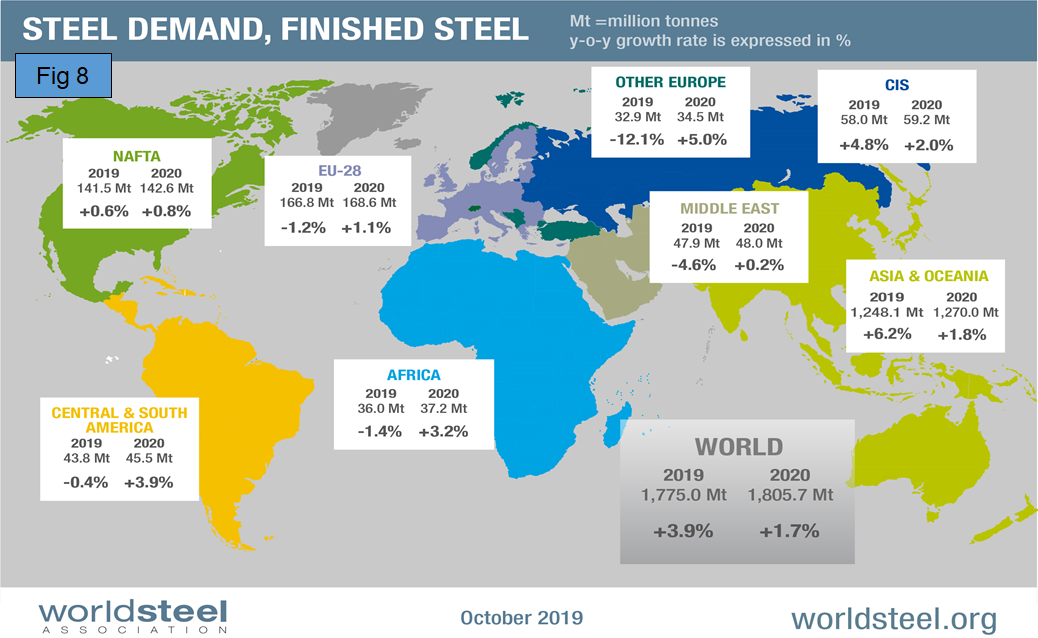
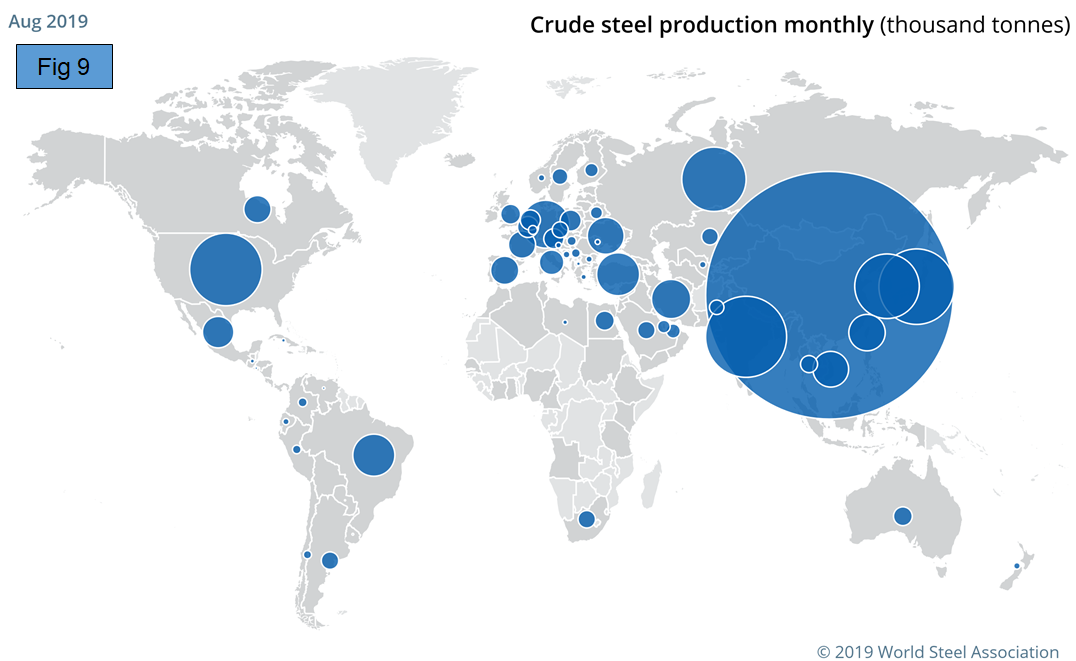
Figure 9 is a schematic from the WSA showing the relative production of the major steel producing nations in August.
SMU Comment: This analysis is based on data made public monthly by the World Steel Association. It is our impression that the WSA has been overly optimistic recently about future global steel production. China is slowing but the rest of the world is slowing faster. The U.S. had one of the least negative growth rates in three months through October on a year-over-year basis.
The WSA represents approximately 85 percent of the world’s steel production, including over 160 steel producers, national and regional steel industry associations, and steel research institutes. (Note at the bottom of Table 1 WSA says this represents 99 percent of steel production, so presumably there are reports of production by countries that include non-members.) The OECD has taken over responsibility for tracking global steel capacity. Their data shows that global capacity declined each year 2016 through 2018. Capacity in 2018 was 2.234 billion metric tons, down from 2.322 billion tons in 2015.


