

Market Data
December 20, 2019
SMU Energy Analysis for December
Written by Peter Wright
Crude oil prices broke out to the upside in December, but the rig count continues to decline.
U.S. exports of crude oil and petroleum products, including gasoline, diesel, jet fuel, naphtha, and many others, exceeded imports in September by 89,000 barrels a day, the Energy Information Administration (EIA) reported on Nov. 28. Thus, the U.S. became a “net exporter” of crude oil and petroleum products for the first time on a monthly basis in the EIA’s data going back to 1973. If another oil embargo came along, the U.S. would just shrug it off. When the price of oil rose due to this embargo, U.S. drillers would ramp up production, and within months the world would be awash in U.S. oil. In other words, the U.S. cannot be blackmailed anymore over oil, as in the past.
![]()
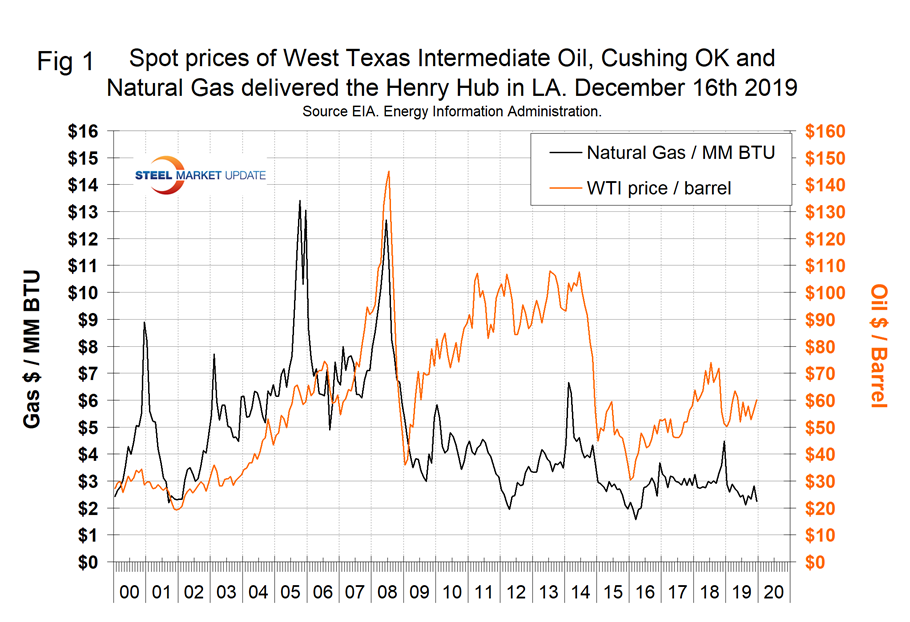
The spot price of West Texas Intermediate (WTI) FOB Cushing, Okla., was rangebound from mid-June through Nov. 8 ranging from $51.14 on Aug. 7 to $57.04 on Nov. 5. The price broke out to the high side on Dec. 16 when it reached $60.21; the only exception was a one-day spike on Sept. 16 when it reached $63.10. That was the extent of the reaction to the attack on the Saudi oil fields. On Dec. 16, WTI was $60.21 and Brent traded at $68.04 per barrel. The total number of operating rigs exploring for oil has declined by 284, or 26 percent, since the end of last year. The prices of oil and natural gas drive the consumption of energy-related steel products including oil country tubular goods, pipe fittings and well head equipment, among others. Welded tubular goods (not including OCTG) consumed about 5.5 million tons of hot rolled sheet in 2018.
Figure 1 shows EIA historical oil and gas prices on a mid-month basis from January 2000 through Dec.16, 2019. On Dec. 13, natural gas at the Henry Hub in Oklahoma was priced at $2.24 per MMBtu, (million British Thermal Units.), down from $2.81 on Nov. 8. Natural gas is priced to continue making inroads against coal as an electric power generator. The electric power sector is the primary consumer of natural gas in the United States. Its share in the annual demand structure was 31.4 percent in September, ahead of industrial processes at 24.0 percent, residential at 14.5 percent and total exports at 12.2 percent.
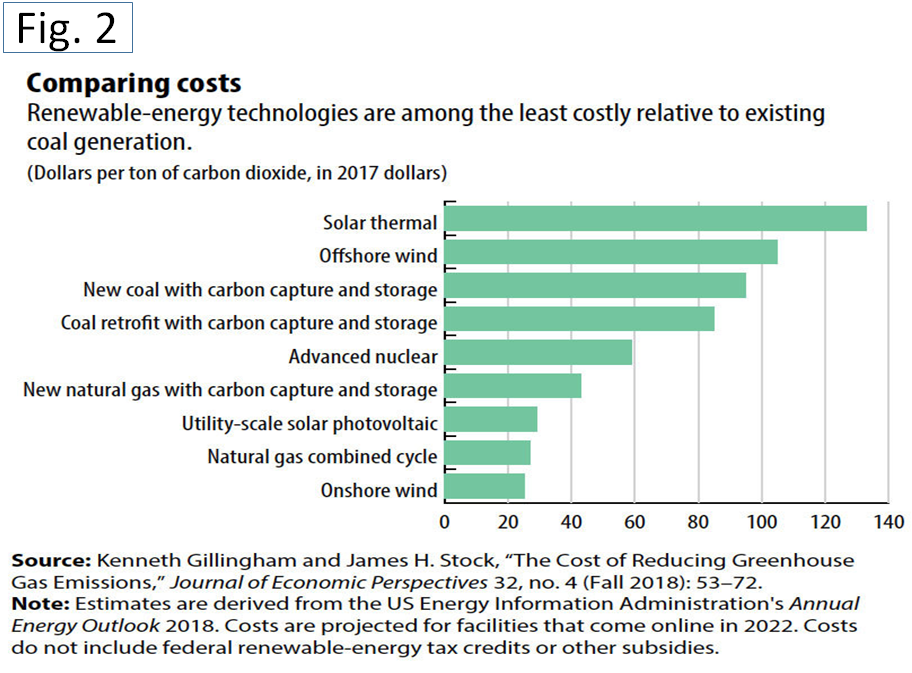
On Dec. 16, the IMF released a paper by Ken Gillingham on the environment and economics. In it he estimated the unsubsidized costs of various technologies to reduce greenhouse gas emissions based on a review of recent economic literature and the Energy Information Administration’s Annual Energy Outlook 2018. The costs are expressed in relation to existing coal generation, which is a useful benchmark because coal is the most carbon-intensive fuel. In many countries, Gillingham reported, policymakers will have to decide whether to close existing coal plants on the path toward decarbonization. These estimates are averages from the United States, and one should be cautious in applying them elsewhere. The most striking takeaway is that renewable-energy technologies are among the least costly. (This result can be applied outside the United States, because markets for most renewable technologies are global.) In fact, the cost of wind and solar may be even lower when implicit or explicit subsidies are included. However, these estimates do not account for the intermittency of renewable energy generation—after all, the sun does not shine and wind does not blow all the time. At high levels of use, renewables must be complemented with storage technologies such as pumped hydroelectric storage or batteries, or with a form of generation that can quickly fill the gap when the supply of wind or solar power falters. In the United States, a low-cost, low-carbon alternative to coal is a power plant that incorporates both gas and steam turbines to increase efficiency. Known as natural gas combined-cycle generation, this solution takes advantage of the copious supply of inexpensive fracked shale gas. One caveat, Gillingham said: The estimated cost of $27 per ton assumes that no methane leaks from wells, pipelines, or storage facilities. Natural gas, which is mainly methane, produces about half as much carbon dioxide as burning coal. But methane is itself a potent greenhouse gas, and it currently leaks from production wells, storage tanks, pipelines, and urban distribution pipes. Increasing its usage, as a strategy for decarbonizing the electricity supply, will also increase the potential for such “fugitive” methane emissions, although there is great uncertainty about how much to expect. Recent studies have documented the difficulty in even measuring today’s leakage levels. Figure 2 shows the cost of eliminating one ton of carbon dioxide by various processes compared to coal.
The EIA short-term energy forecast of Dec. 10 stated: “Brent crude oil spot prices averaged $63 per barrel (b) in November, up $3/b from October. EIA forecasts Brent spot prices will average $61/b in 2020, down from a 2019 average of $64/b. EIA forecasts that West Texas Intermediate (WTI) prices will average $5.50/b less than Brent prices in 2020. EIA expects crude oil prices will be lower on average in 2020 than in 2019 because of forecast rising global oil inventories, particularly in the first half of next year. On Dec. 6, the Organization of the Petroleum Exporting Countries (OPEC) and a group of other oil producers announced they were deepening production cuts originally announced in December 2018. The group is now targeting production that is 1.7 million barrels per day (b/d) lower than in October 2018, compared with the former target reduction of 1.2 million b/d. OPEC announced that the cuts would be in effect through the end of March 2020. However, EIA assumes that OPEC will limit production through all of 2020, amid a forecast of rising oil inventories. EIA forecasts OPEC crude oil production will average 29.3 million b/d in 2020, down by 0.5 million b/d from 2019.
On Dec. 13, the EIA reported that U.S. commercial crude oil inventories (excluding those in the Strategic Petroleum Reserve) increased by 24.2 million barrels since the beginning of October to reach 447 million barrels on Dec. 13. Including the SPR, total inventory on that date was 1.08 billion barrels. Figure 3 shows the inventory level, including the strategic petroleum reserve and the year-over-year change.
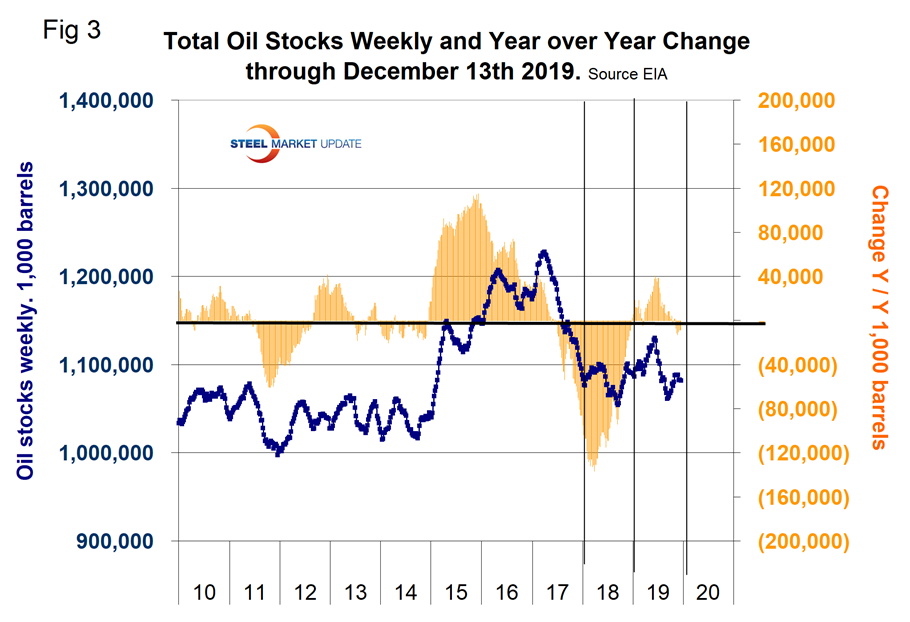
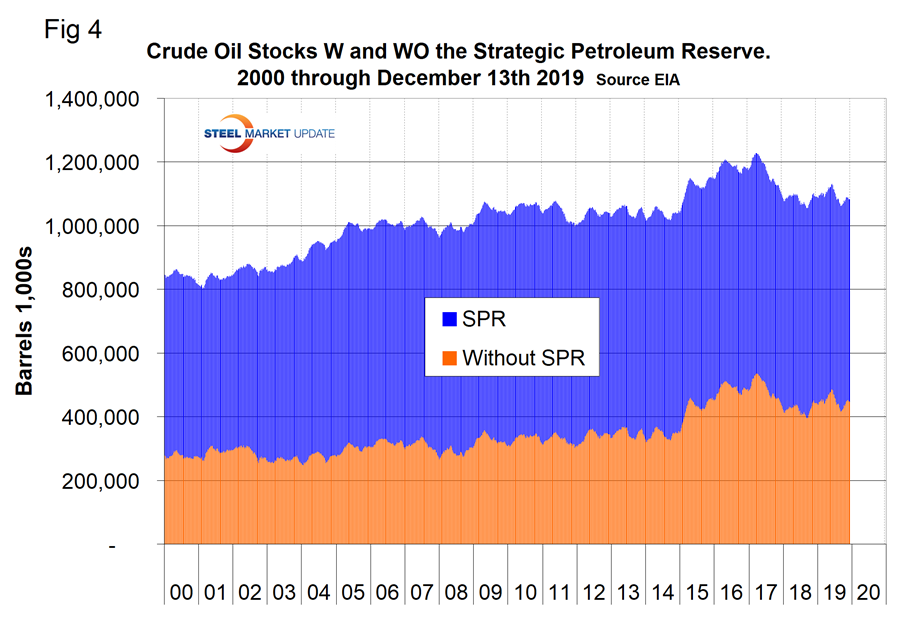
Figure 4 breaks total crude inventory into the working portion and the strategic petroleum reserve.
The total number of operating rigs in the U.S. on Dec. 13 was 799, down by 284 since the last week of 2018 or 26.0 percent. Oil rigs were down by 218 and gas by 69. Figure 5 shows the total number of operating rigs in the U.S. and the weekly change. On Nov. 30, Wolf Richter, an energy equity specialist, reported that so far in 2019 at least 33 oil and gas drillers in the U.S. have filed for bankruptcy. Since January 2015, over 200 have filed for bankruptcy. Others are now jostling for position at the bankruptcy filing counter. Investors who jumped into this in 2016, thinking they’d picked the bottom, grabbed falling knives and got seriously hurt, including those of fracking billionaires.
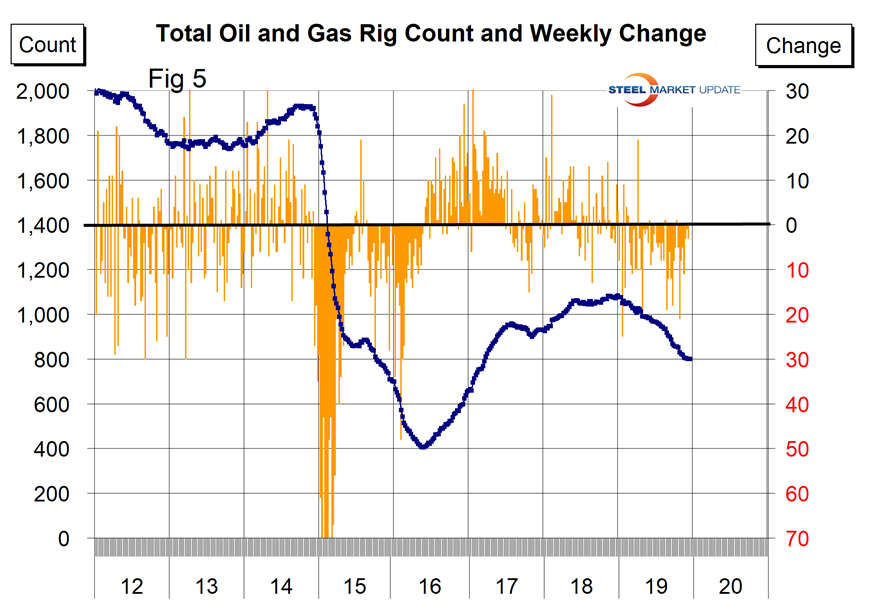
The oil rig count had a low point of 316 on June 27, 2016, and stood at 667 on Dec. 13, 2019.
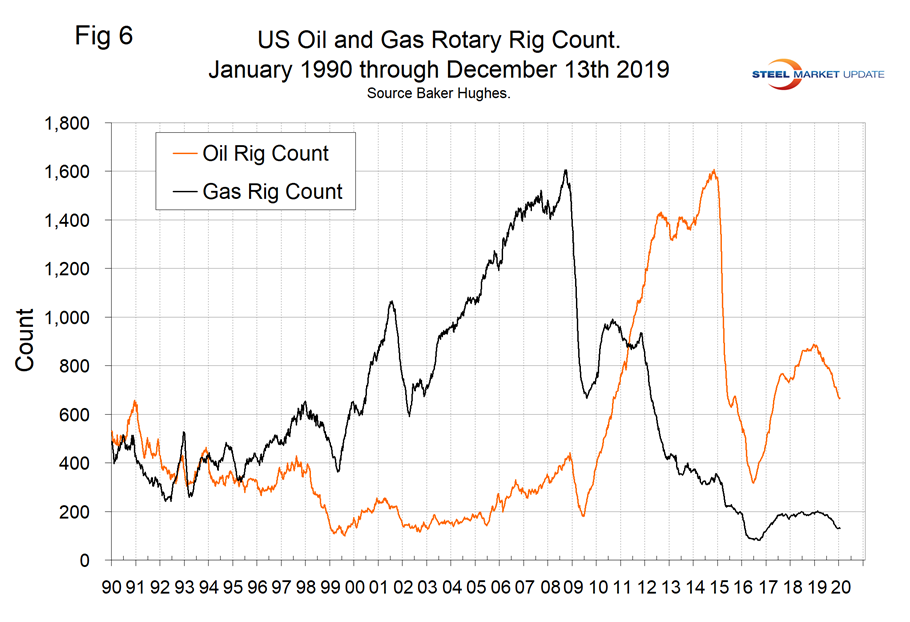
The U.S. gas rig count rose from its low point of 81 on Aug. 5, 2016, to 202 on Jan. 11, 2019, before falling back to 129 on Dec. 13, 2019. The year-over-year growth rate of total U.S. operating rigs was negative 25.4 percent in the latest data with oil down by 23.6 percent and gas down by 34.8 percent. Figure 6 shows the Baker Hughes U.S. Rotary Rig Counts for oil and gas equipment in the U.S. (explanation below).
On a regional basis in the U.S., the big three states for operating rigs are Texas, Oklahoma and North Dakota. Figure 7 shows the land rig count in those states since 2000.
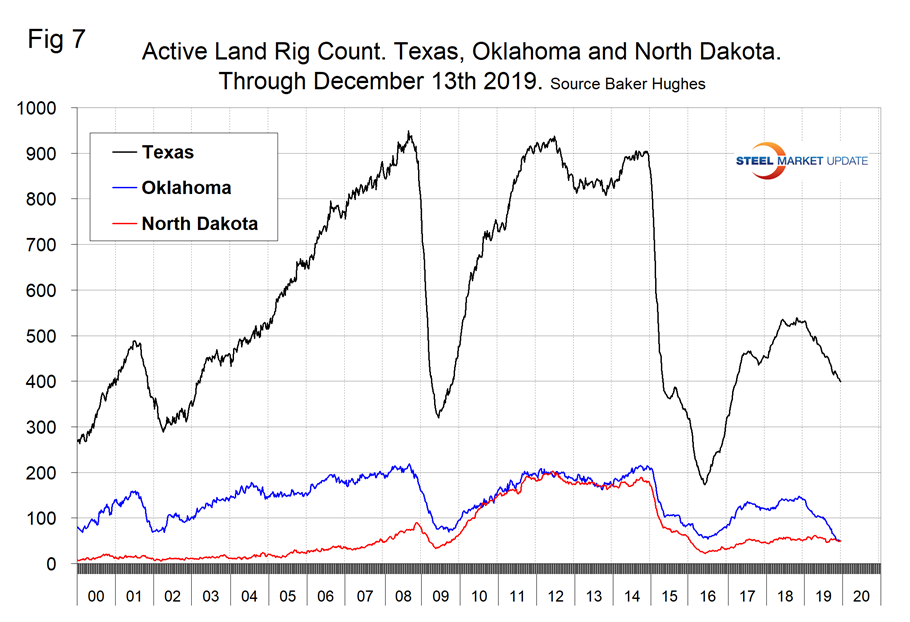
Figure 8 illustrates the monthly U.S. oilfield production of crude from January 1970 through September 2019 (latest data available) in thousands of barrels per month. The historical high was October 1970 at 310.4 million barrels. Production steadily declined to half that level in the late 2000s before the fracking revolution. December 2017 broke the record that had stood for 47 years with 311.2 million barrels produced. August 2019 set another record of 383.3 million barrels with production in September declining slightly to 374 million barrels.
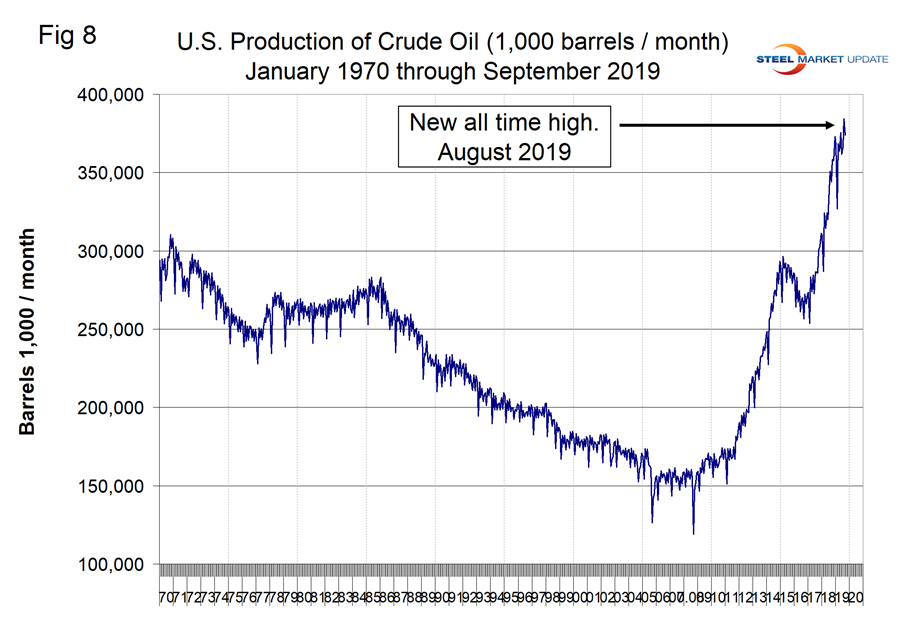
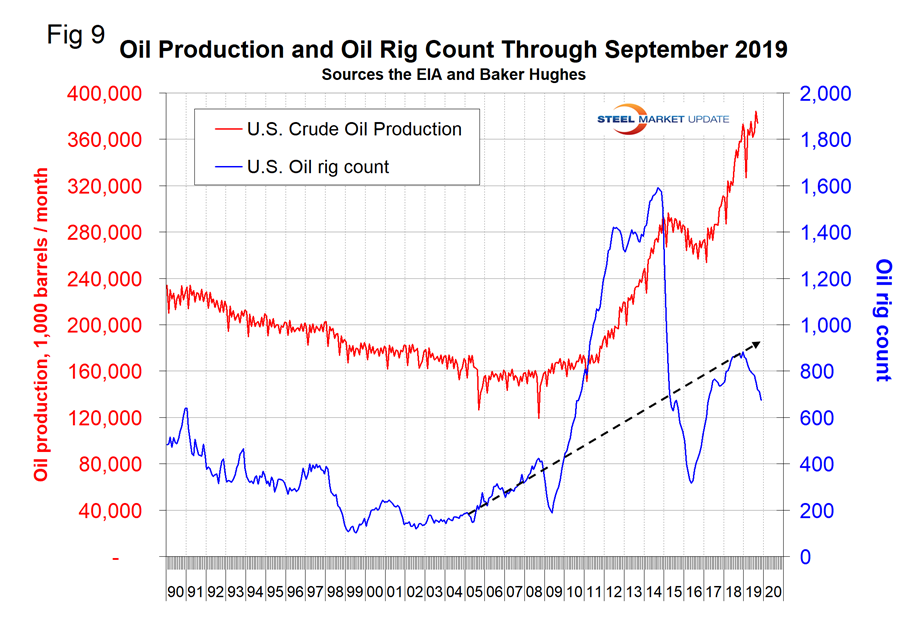
Figure 9 compares oil production and the oil rig count and shows how the increase in exploratory wells drove production from 2009 through late 2014 when the oil price collapsed. Production and rig count have been moving in opposite directions for all of 2019 as previously drilled and capped wells are put into production.
Baker Hughes Rotary Rig Count: This is a weekly census of the number of drilling rigs actively exploring for or developing oil or natural gas in the United States. Rigs are considered active from the time they break ground until the time they reach their target depth and may be establishing a new well or sidetracking an existing one. The Baker Hughes Rotary Rig count includes only those rigs that are significant consumers of oilfield services and supplies.


