

Market Data

January 23, 2020
Steel Mill Lead Times: Leveling Off?
Written by Tim Triplett
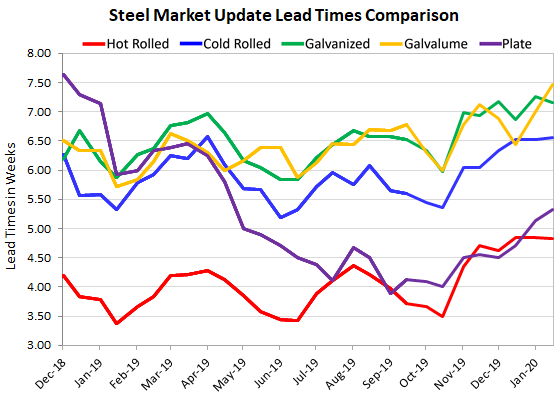
Lead times for hot rolled and cold rolled steel have flattened out, seeing little change in the past month, as measured by Steel Market Update. Lead times for steel delivery are an indicator of demand at the mill level. The longer the lead time, the busier the mill.
Lead times in general are about a week longer than they were at this time last year, signaling healthier demand. The average lead time for hot rolled steel has leveled out at nearly five weeks, cold rolled at six and a half weeks and coated steels a bit more than seven weeks. Plate lead times are now longer than five weeks.
Comparing the data, the average lead time for spot orders of hot rolled last week was 4.83 weeks, versus 4.84 in mid-December. Cold rolled last week was at 6.56 weeks, up from 6.52 the month prior. Galvanized was at 7.15, up from 6.86, while Galvalume was at 7.46 weeks. The average plate lead time last week was 5.33 weeks, slightly longer than the 5.13 in SMU’s survey last month.
Lead times had been extending as some buyers rushed to place orders ahead of the next price increase by the mills. The leveling out of lead times suggests order books are still good at the steel mills, the question is whether inventories have been replenished and when will the market start to take a breather? SMU will be watching to see what happens next.
Note: These lead times are based on the average from manufacturers and steel service centers who participated in this week’s SMU market trends analysis. Our lead times do not predict what any individual may get from any specific mill supplier. Look to your mill rep for actual lead times. Our lead times are meant only to identify trends and changes in the marketplace. To see an interactive history of our Steel Mill Lead Times data, visit our website here.


