

Market Data

January 31, 2020
Global Steel Production Through December
Written by Peter Wright
China increased steel production by three million metric tons in December.
Figure 1 shows annualized monthly global steel production on a three-month moving average (3MMA) basis and capacity utilization since January 2000. Based on OECD data (see below), capacity utilization in December on a three-month moving average (3MMA) basis was 80.9 percent, down from 86.3 percent in June. On a tons-per-day basis, production in December was 4.907 million metric tons, down from June’s all-time high of 5.322 million metric tons.
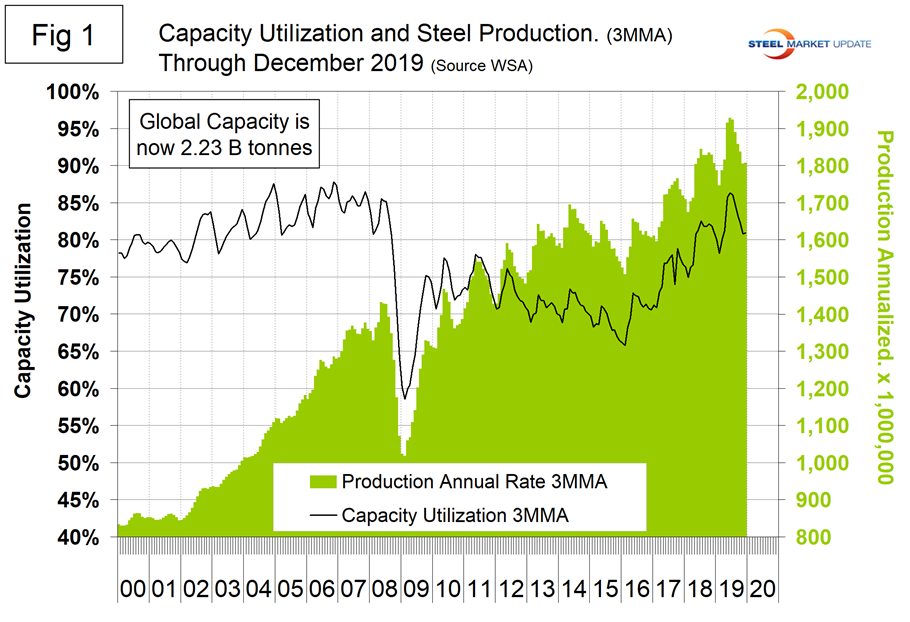
Figure 2 shows the average tons per day of production for each month since January 2011. December is historically the month with the lowest production. On average, December declined by 2.87 percent from November. In 2019 December declined by 0.46 percent, therefore in the big picture was better than normal. The big picture is China and then everybody else, which is a huge divide when it comes to steel industry performance.
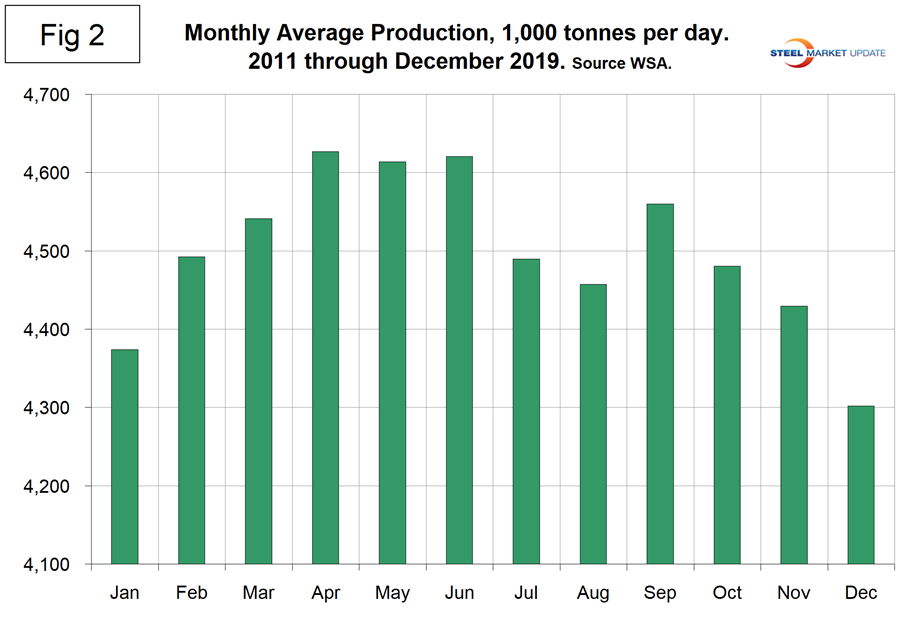
Figure 3 shows the year-over-year growth rate of the 3MMA of global production since January 2005. Growth in three months through December on a year-over-year basis was positive 0.1 percent, up from negative 1.3 percent in November, which was the first negative growth month since March 2016.
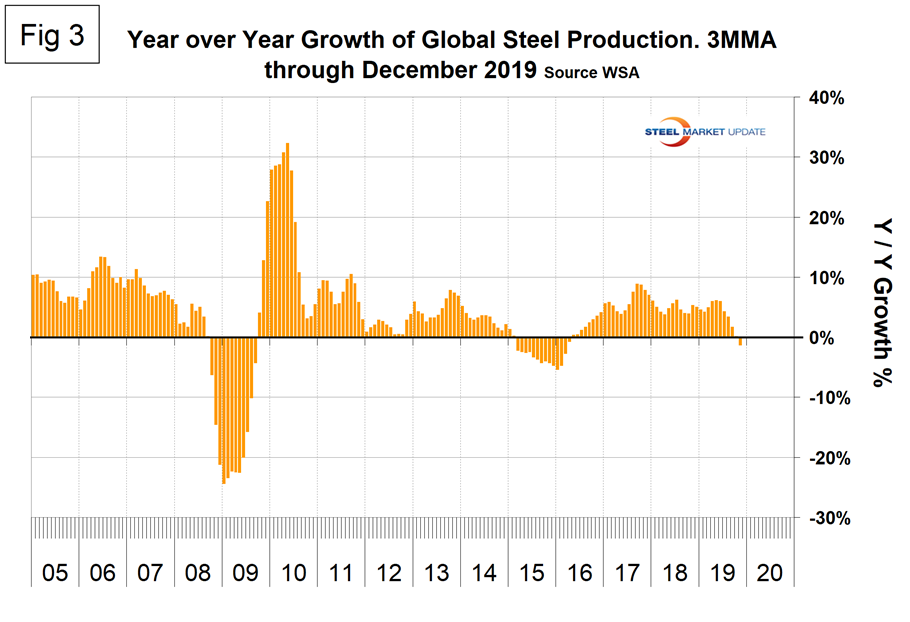
In three months year over year through December, China had positive growth of 4.8 percent. Steel production growth for the rest of the world was negative 5.1 percent.
On Jan. 20, the IMF published a paper on the global economic outlook through 2021. They summarized as follows: “Global growth is projected to rise from an estimated 2.9 percent in 2019 to 3.3 percent in 2020 and 3.4 percent for 2021—a downward revision of 0.1 percentage point for 2019 and 2020 and 0.2 for 2021 compared to those in the October World Economic Outlook. The downward revision primarily reflects negative surprises to economic activity in a few emerging market economies, notably India, which led to a reassessment of growth prospects over the next two years. In a few cases, this reassessment also reflects the impact of increased social unrest.”
Table 1 shows global production broken down into regions, the production of the top 10 nations in the single month of December, and their share of the global total. It also shows the latest three months and 12 months of production through December with year-over-year growth rates for each period. Regions are shown in white font and individual nations in beige. The world overall had positive growth of 0.1 percent in three months and positive 3.1 percent in 12 months through December. When the three-month growth rate is lower than the 12-month growth rate, as it was each month in July through December, we interpret this to be a sign of negative momentum. On the same basis in December, China grew by 4.8 percent and 7.6 percent, therefore also had negative momentum. All regions except Asia had negative growth in three months through December year-over-year. Table 1 shows that North America was down by 3.9 percent in the last three months. Within North America, production was down by 2.9 percent in the U.S., down by 6.5 percent in Canada and down by 7.2 percent in Mexico. (Canada and Mexico are not shown in Table 1.)
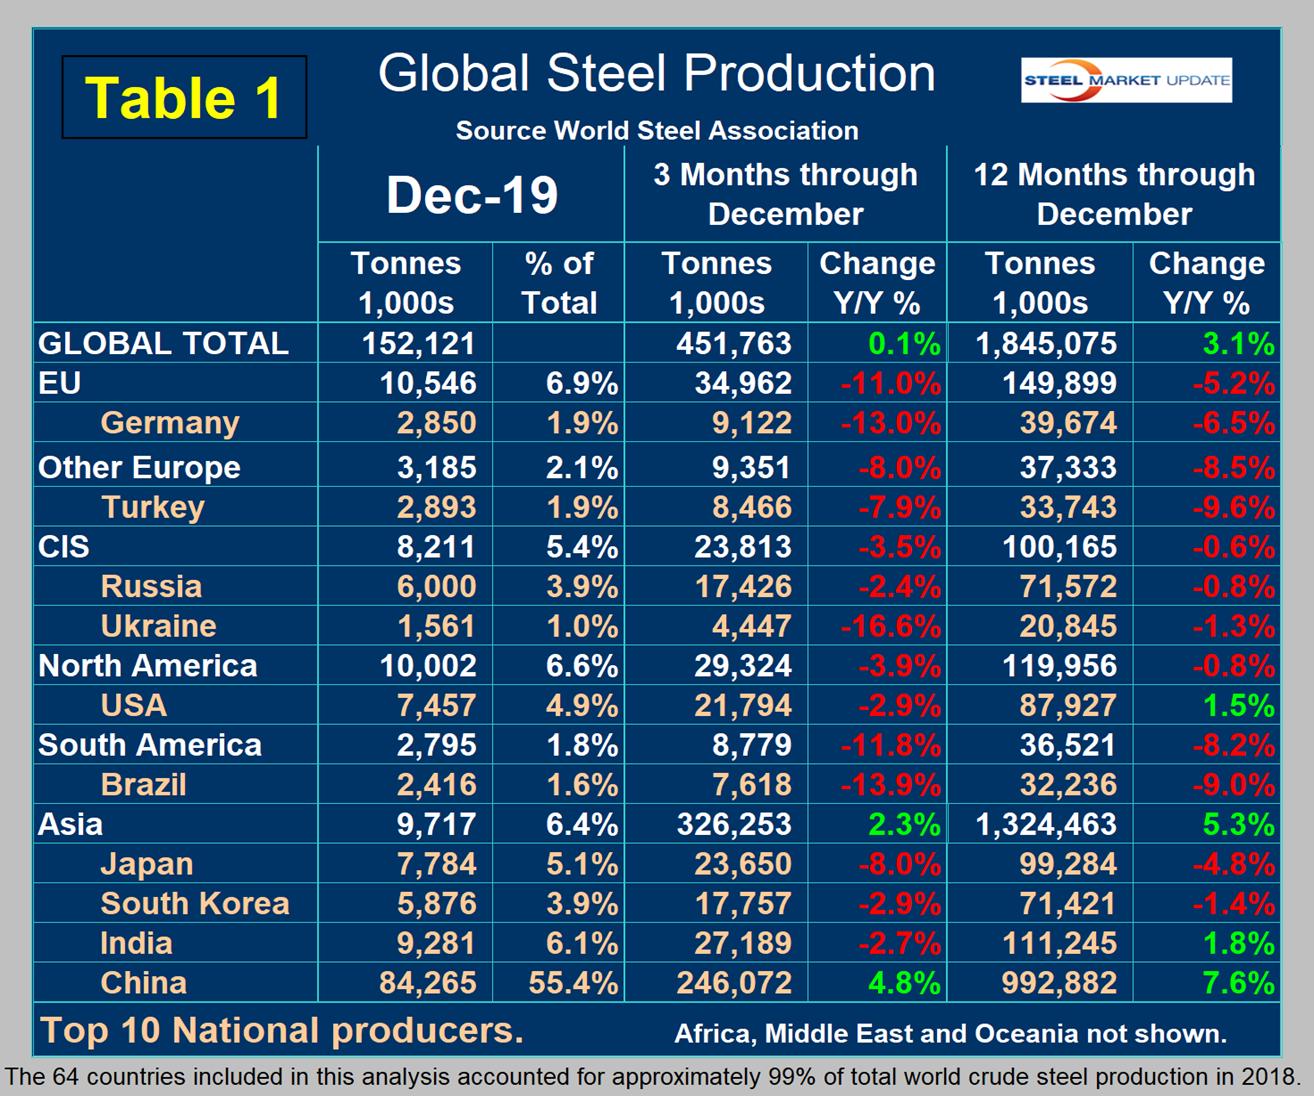
In the 12 months of 2019, 119.965 million metric tons were produced in North America of which 73 percent was produced in the U.S., 11 percent in Canada and 16 percent in Mexico. Based on the OECD data, U.S. capacity in 2018 was 112.6 million metric tons with a capacity utilization of 76.9 percent. We don’t yet have the OECD capacity data for 2019.
Figure 4 shows China’s production since 2005. Production increased by three million tons in December to the highest level since August. The latest OECD data shows China’s capacity in 2018 to be 1,023,400,000 metric tons, and the WSA reported China’s 2018 production to be 924,752,000 metric tons, which yields a capacity utilization of 90.4 percent. We can’t make that calculation for 2019 production because we don’t know the current capacity.
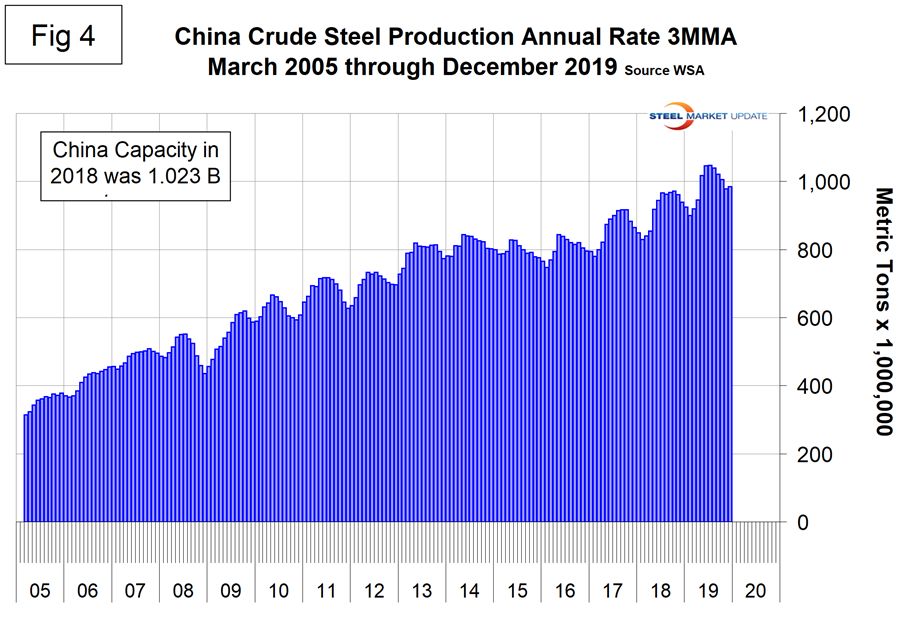
Figure 5 shows the growth of China’s steel production since January 2013 and Figure 6 shows the growth of global steel excluding China. China’s domination of the global steel market is increasing.
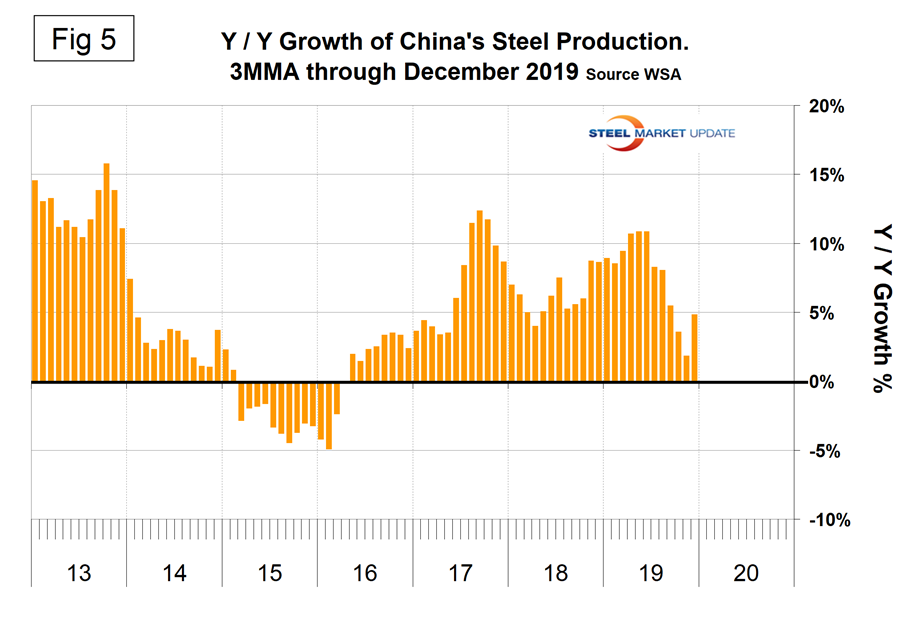
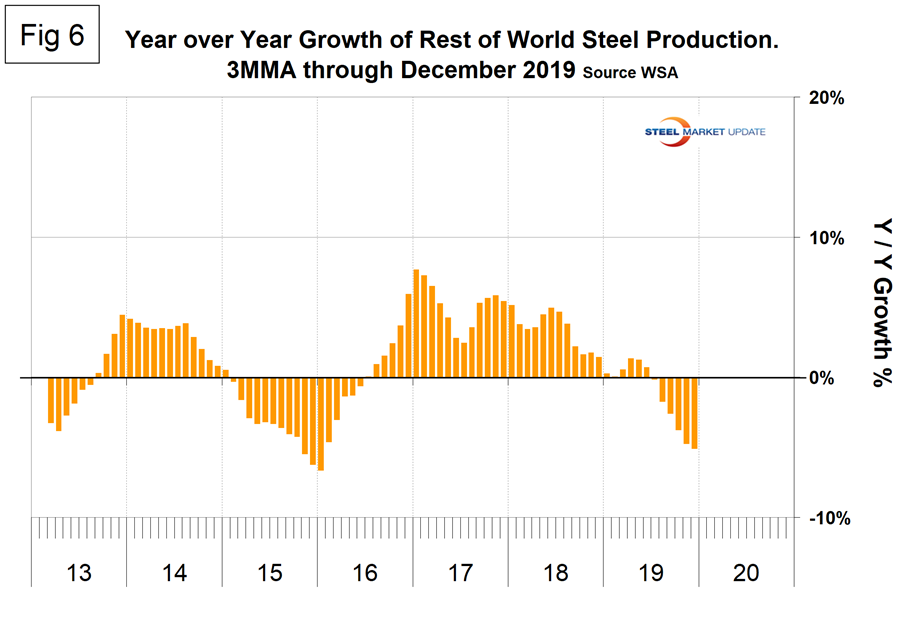
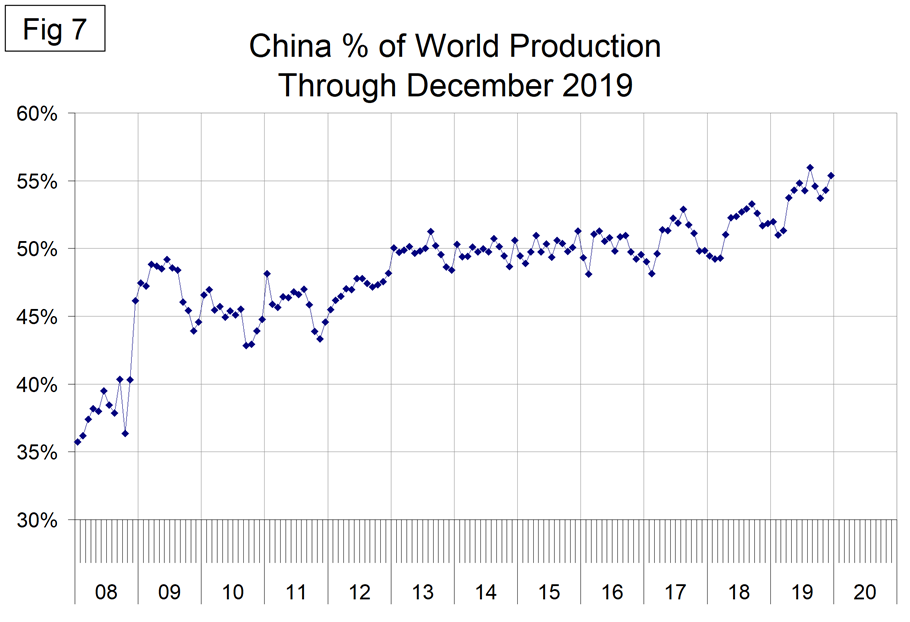
Figure 7 shows the growth of China’s share of global steel production, which in December was 55.4 percent, down from the all-time high of 56.2 percent in August.
The October 2019 WSA Short Range Outlook (SRO) for apparent steel consumption in 2019 and 2020 is shown by region in Figure 8.
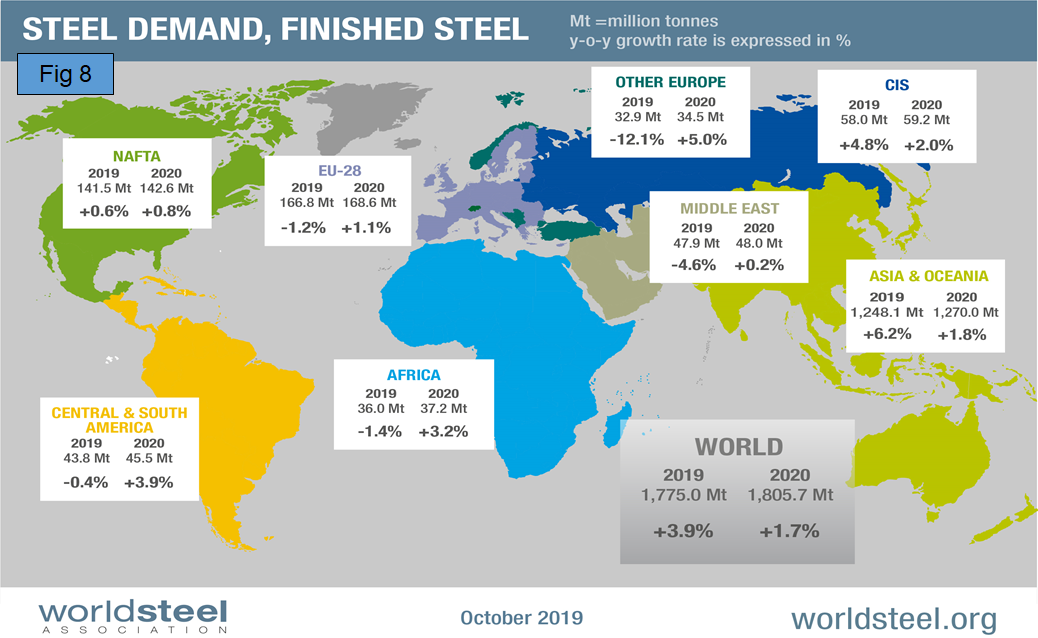
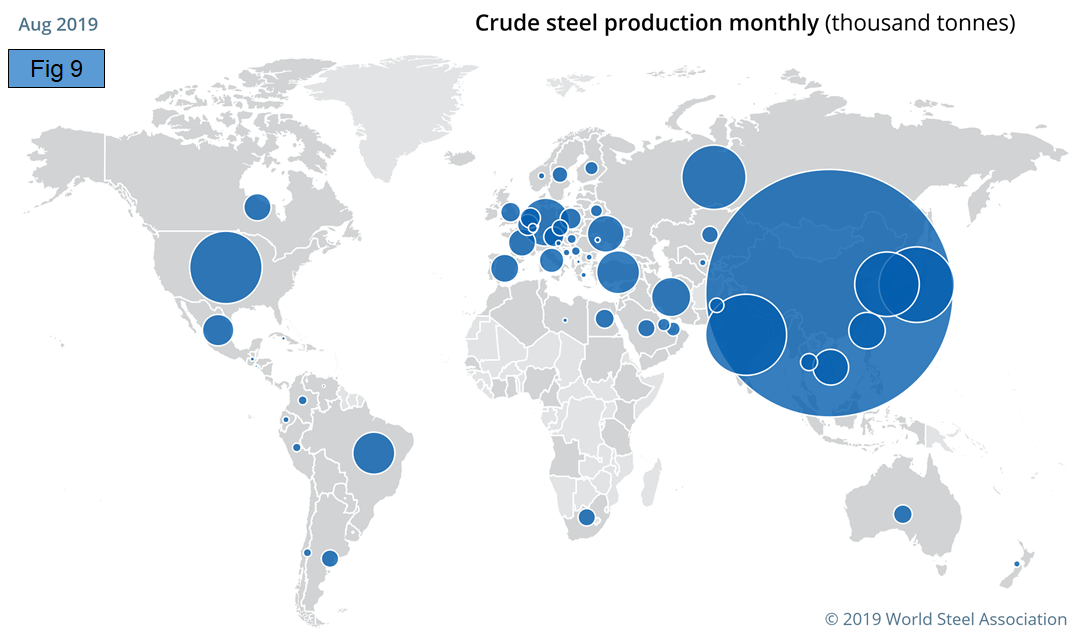
Figure 9 is a schematic from the WSA showing the relative production of the major steel producing nations in August.
SMU Comment: The global economy is slowing as globalization is increasingly examined for convergence with national aspirations. Global steel production is negatively influenced by these sentiments. The decline in production of the world excluding China is accelerating. This analysis is based on data made public monthly by the World Steel Association, which seems to have been overly optimistic recently about future global steel production.
The WSA represents approximately 85 percent of the world’s steel production, including over 160 steel producers, national and regional steel industry associations, and steel research institutes (note at the bottom of Table 1 WSA says this represents 99 percent of steel production, so presumably there are reports of production by countries that include non-members). The OECD has taken over responsibility for tracking global steel capacity. Their data shows that global capacity declined each year 2016 through 2018. Capacity in 2018 was 2.234 billion metric tons, down from 2.322 billion tons in 2015.


