

Premium

February 10, 2020
SIMA: Steel Import License Data for January
Written by Peter Wright
Imports of steel rolled products have declined every month since May 2018, year over year, with the greatest decline in January 2020, according to government data. Total rolled product imports in January were down by 35.5 percent on a three-month moving average (3MMA) basis. This follows the 27.8 percent decrease in November on the same basis.
This early look at January’s import volume is based on Commerce Department license data (see explanation below.) This import analysis includes all major steel sectors: sheet, plate, longs and tubulars, with a total of 18 subsectors. We now publish an import market share analysis for the same 18 steel product groups. All volumes in this analysis are reported in short tons. We use three-month moving averages rather than single-month results to smooth out monthly variability.
Imports of total rolled products in January were the lowest since February 2010 on both a single-month and on a 3MMA basis. In the 12 months August 2018 through August 2019, total rolled product imports on a 3MMA basis were consistently in the range of 1.70 to 1.94 million tons. In the months September through January, total rolled product volumes broke out of that range to the downside at 1.65, 1.54, 1.38, 1.32 and 1.25 million tons, respectively. Year over year on a 3MMA basis, sheet products were down by 27.6 percent, plate products were down by 38.2 percent, long products were down by 33.3 percent and tubulars were down by 45.8 percent. Imports of flat rolled, tubulars and longs all had a recent peak in May 2018. Since then total flat rolled (sheet + plate) imports have consistently declined, which may be tariff-driven. This is not so obvious for longs and tubulars where the decline since May 2018 has been less consistent.
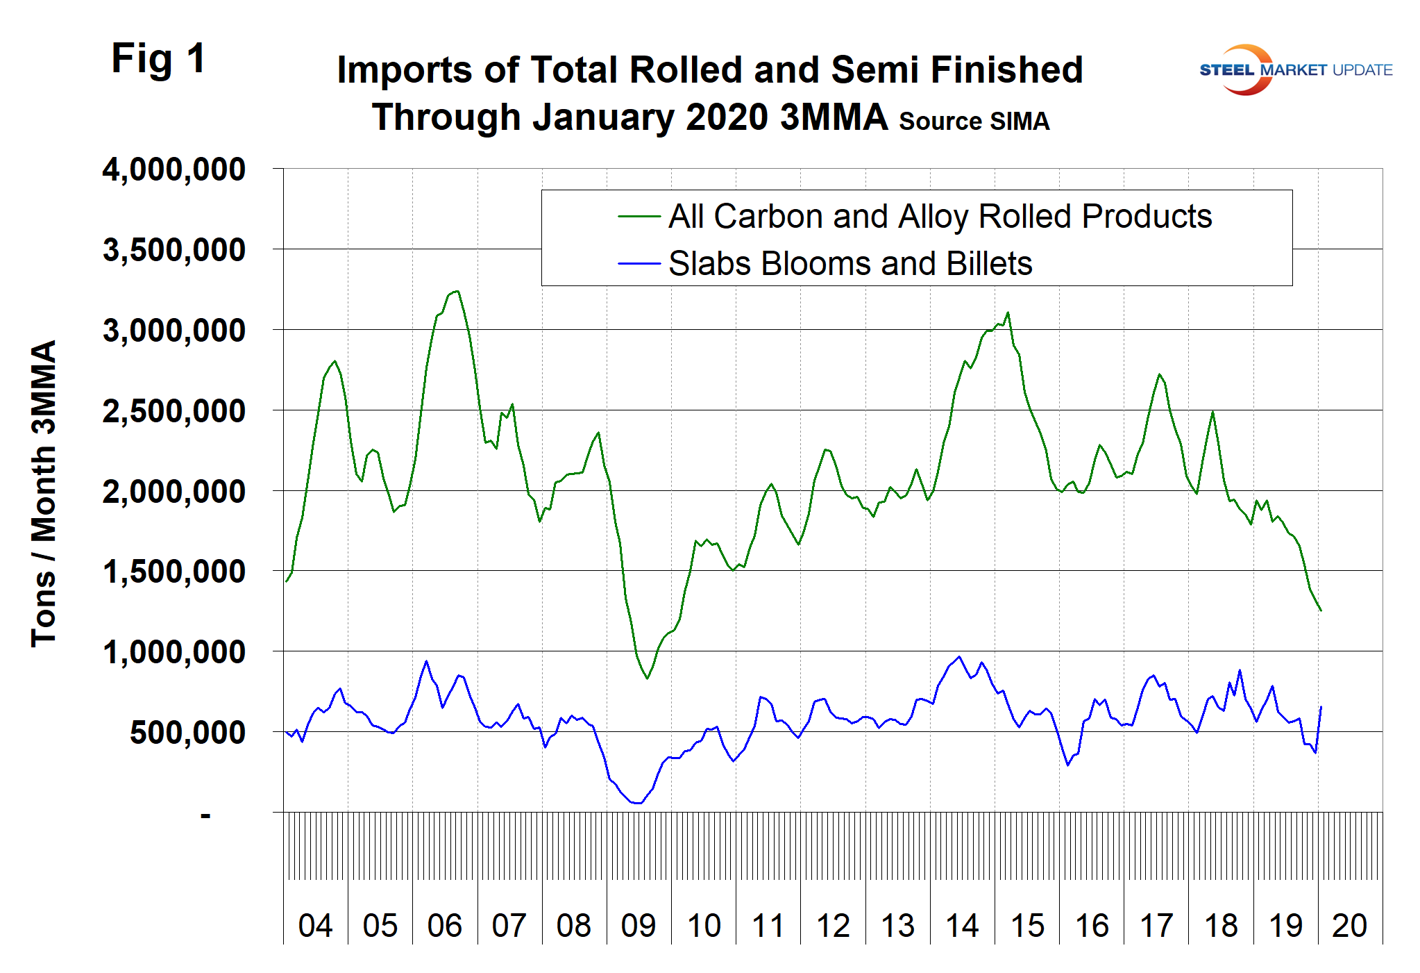
Figure 1 shows the tonnage of total rolled steel and semi-finished imports through January on a 3MMA basis. For the first time in our recording history the imports of semifinished in January exceeded those of total rolled products. For some reason, most likely quota related, a large volume of semifinished imports was moved from December to January in the SIMA statistics.
Semifinished imports—including slabs from Brazil, South Korea and Argentina—are subject to quarterly quota limits imposed by the Trump administration, in lieu of Section 232 tariffs. As one steel executive explained to SMU, there is now a disconnect between applications for import licenses and when the material actually clears customs, which skews the import data. “Due to the timing of the quota openings/closings, most of the entries essentially sit around on the ground in an FTZ/bonded facility and only customs clear when the quota opens up. This creates a significant delay between license and entry for slabs from Brazil. On Jan. 1 when the quota opens, if all tons that are on the ground are submitted for clearance, only 82 percent will get the green light. The quota for Q1 is already oversubscribed with physical slab. This is the new normal.”
Total rolled product volume has been on an erratically downward trend since mid-2017. Imports of semifinished have been very erratic since July 2018, ranging from a low of 0.21 million tons in August 2019 to a high of 1.55 million tons in this latest data for January 2020. This is why we use a 3MMA calculation in our analyses, the result of which is the much smoother line for semis in Figure 1.
However, this is one instance where we miss short-term trends by using a 3MMA. Figure 1a clearly shows the erratic ups and downs in the import data for semifinished material caused by the quotas in the last two years.
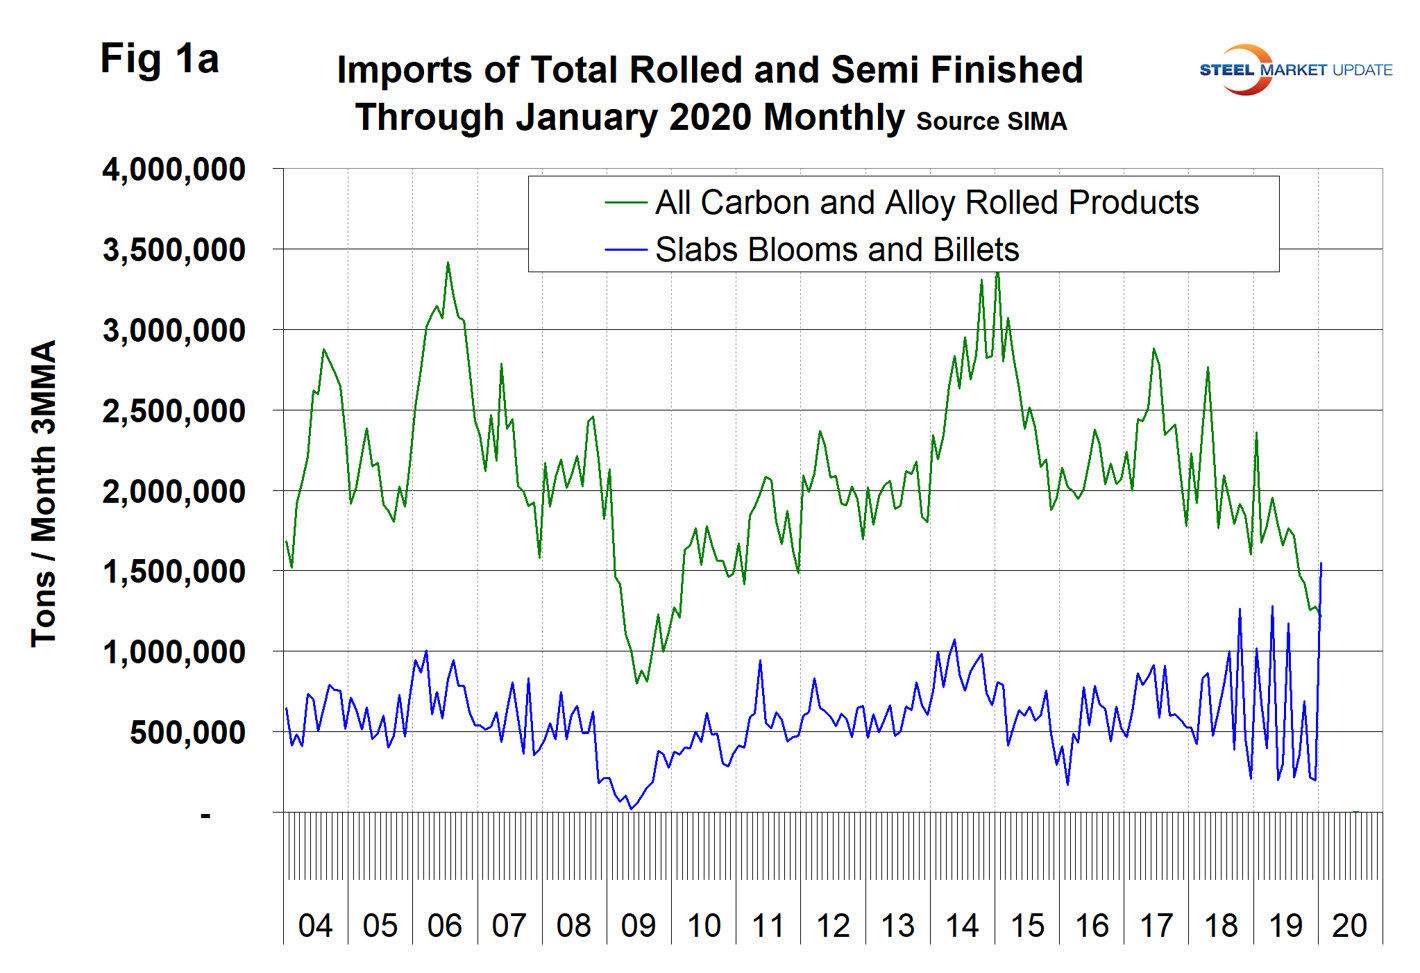
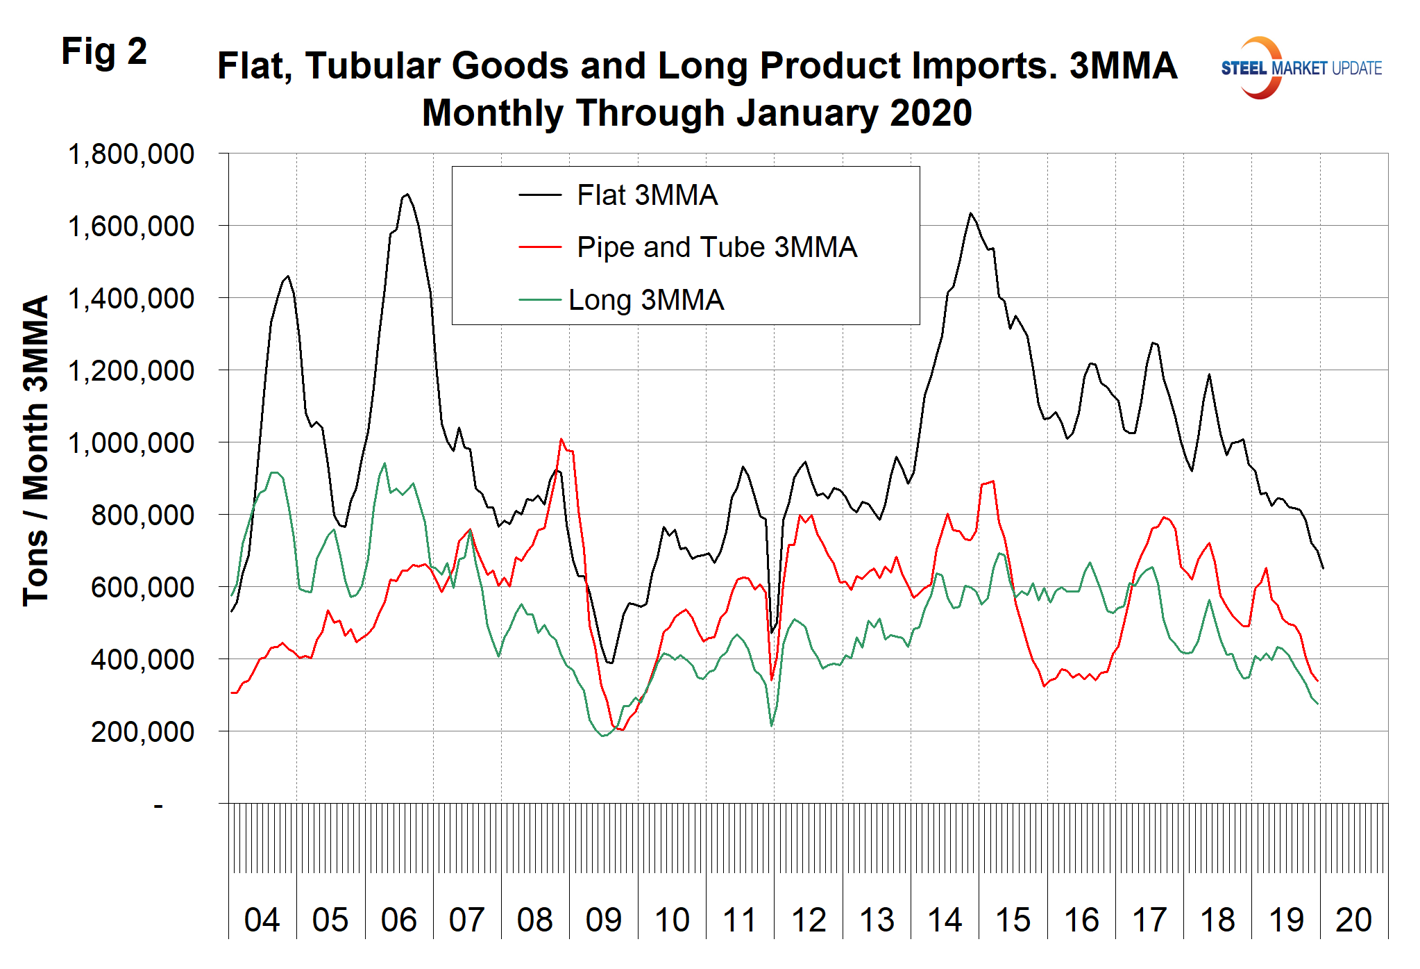
Figure 2 summarizes the import volume of flat rolled, tubular and long products since 2004 on a 3MMA basis. All three have been trending down since mid-2017.
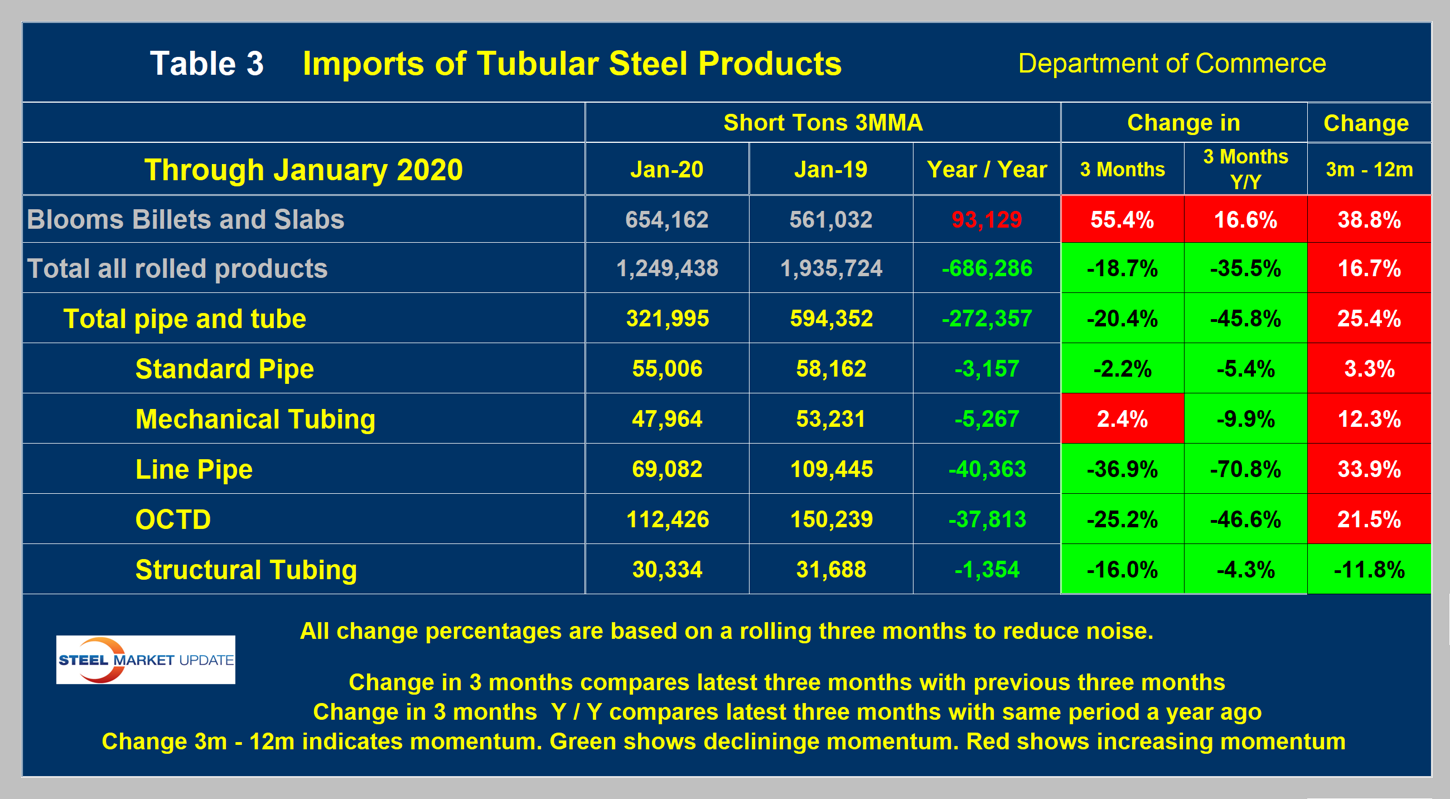
There are three tables in this report. In each of them we show the 3MMA of the tonnage in January 2020 and January 2019 with the year-over-year change. We then calculate the percentage change in volume in the most recent three months with the previous three months. This month we are comparing November through January with August through October (3M/3M). The next column to the right shows the year-over-year change as a percentage. Declines are color coded green and increases are coded red. Finally, in the far-right column, we subtract the 12-month change from the three-month change. This is a way of describing the magnitude of the recent momentum as a percentage. It is not unusual for the color code of the momentum to be the opposite of the two time frame analyses, which it was in January.
Table 1 describes the imports of all major sectors of the sheet and plate markets. In the flat rolled sectors shown in Table 1, total sheet products were down by 27.6 percent and total plate products were down by 38.2 percent, both year over year. All individual products in the sheet and plate groups were down year over year. In the sheet sector other metallic coated (mainly Galvalume) was down the most and cold rolled down the least. This ignores electrogalvanized because of its low volume. In the plate sector, cut to length was down by 38.5 percent and coiled down by 38.1 percent. Figures 3 and 4 show the history of sheet and plate product imports since January 2004.
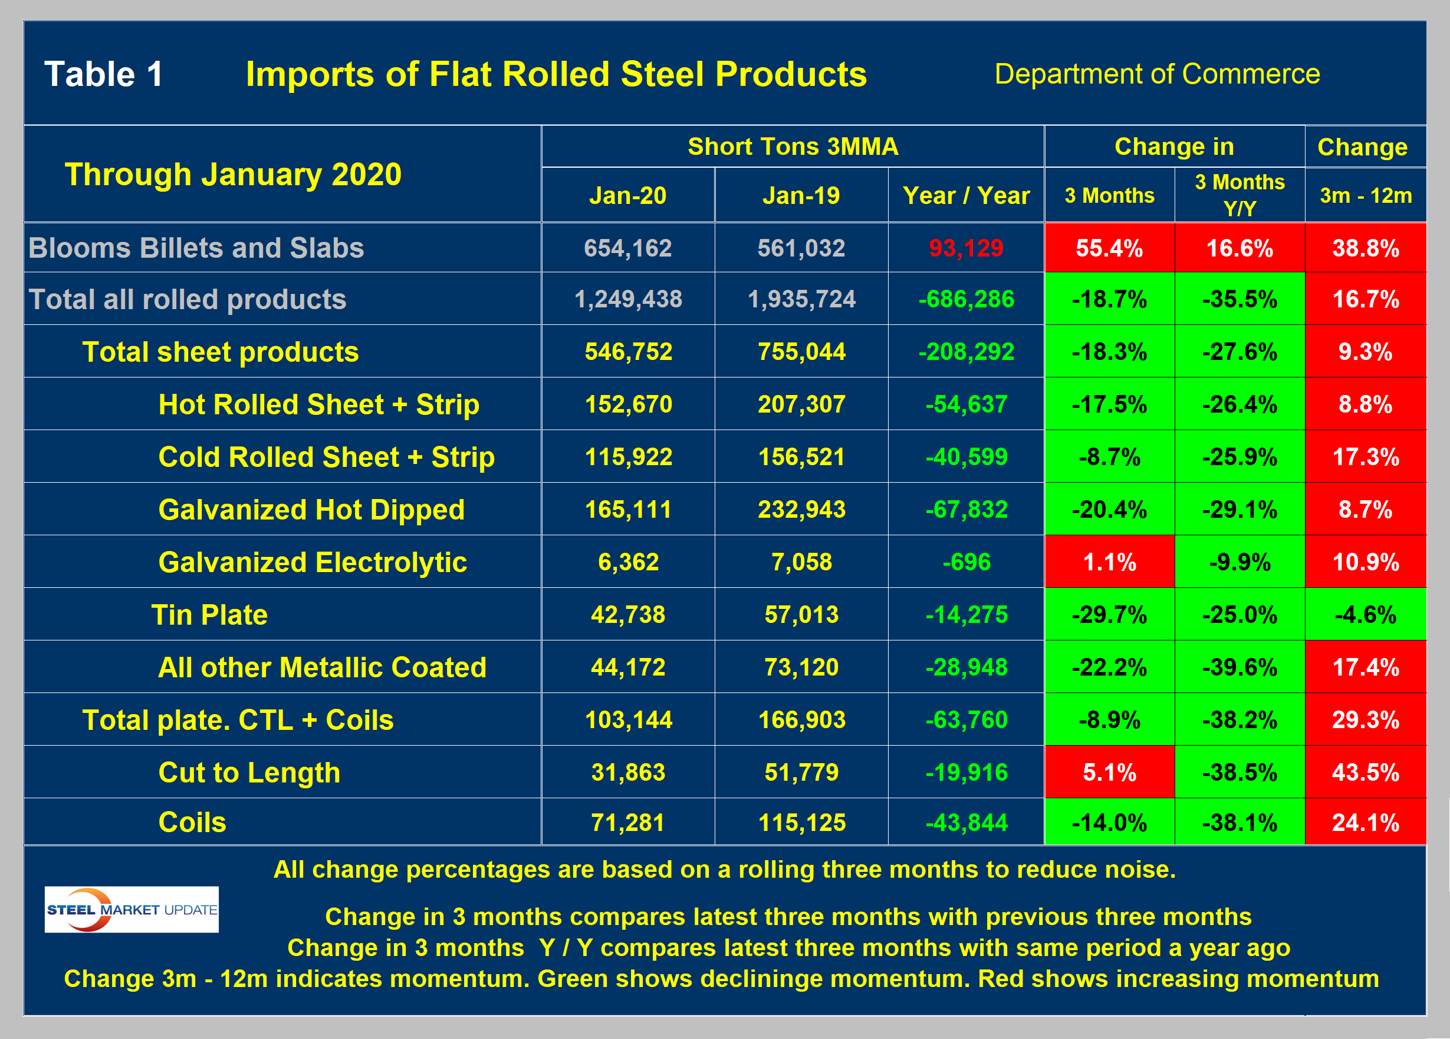
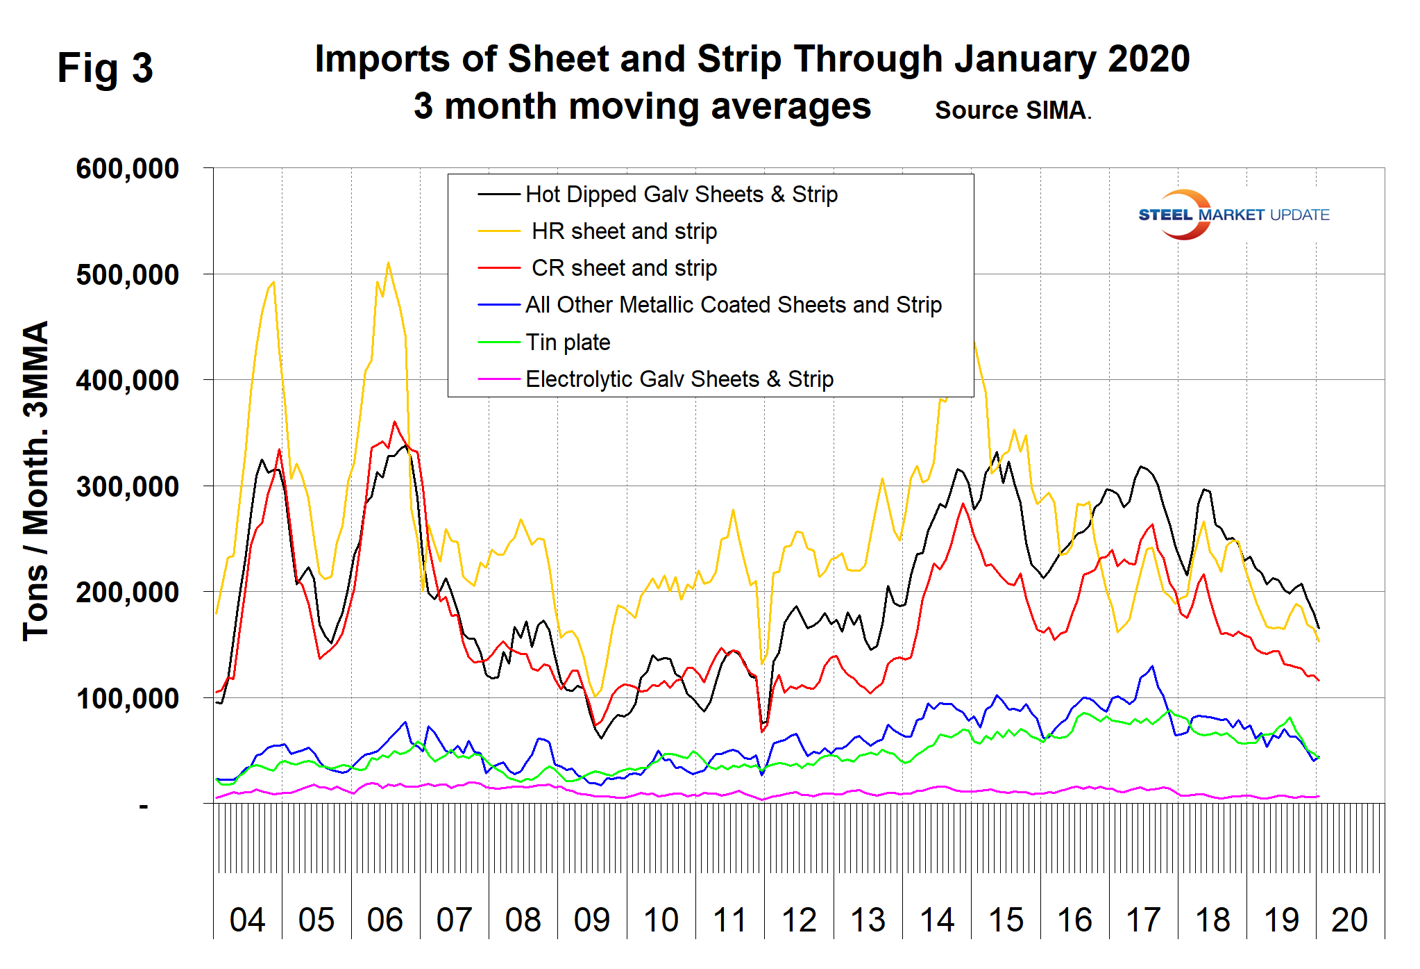
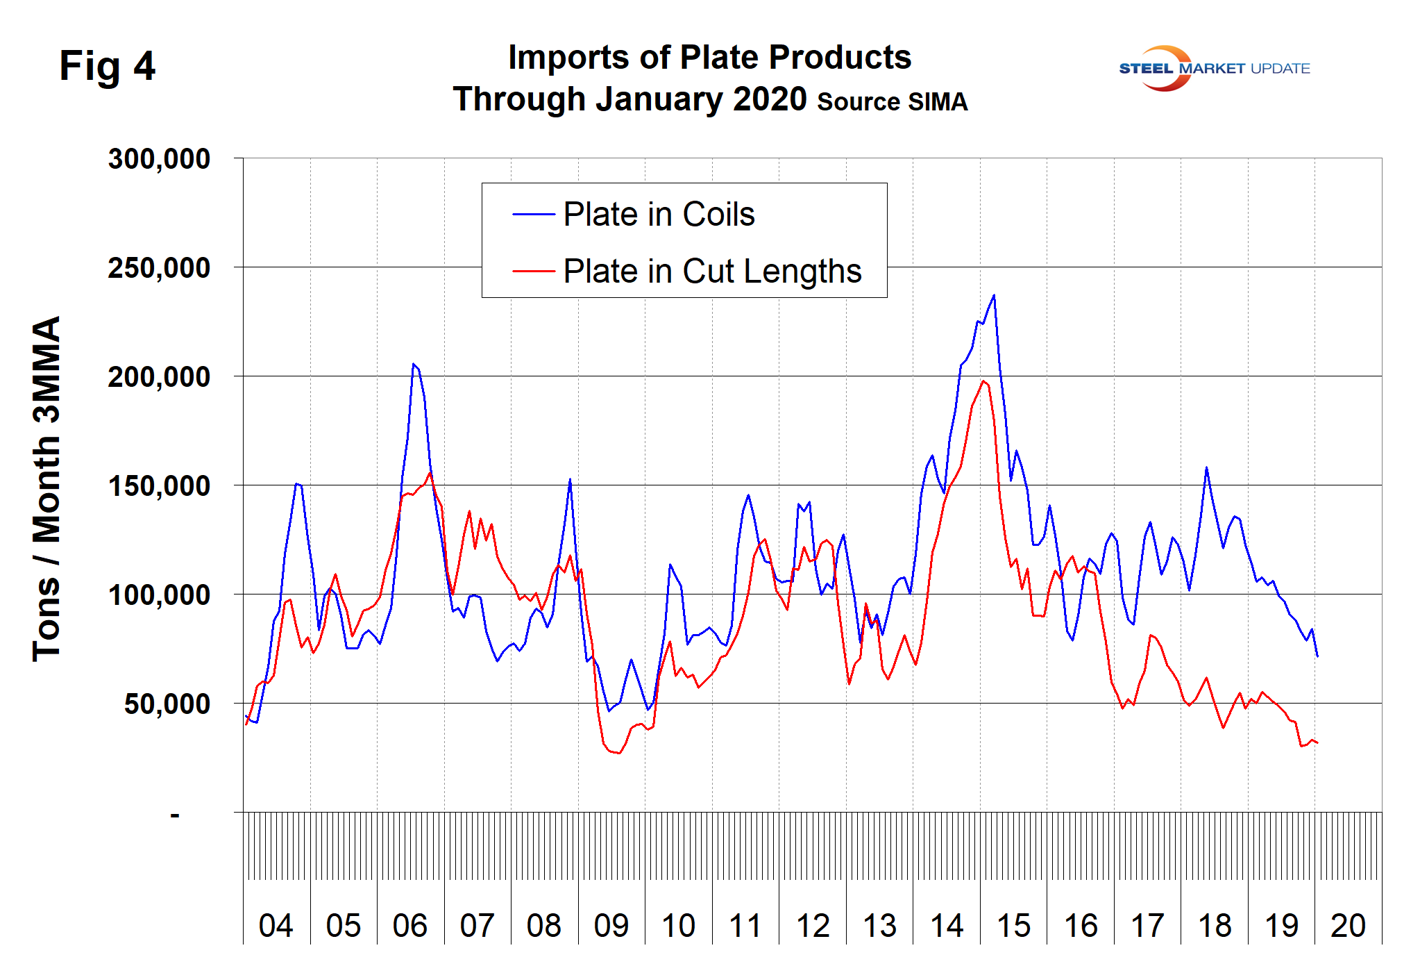
Table 2 shows the same analysis for long products where the year-over year volume was down by 33.3 percent in total. All products were down year over year with wire rod down the most and light shapes down the least. Figure 5 shows the history of long product imports.
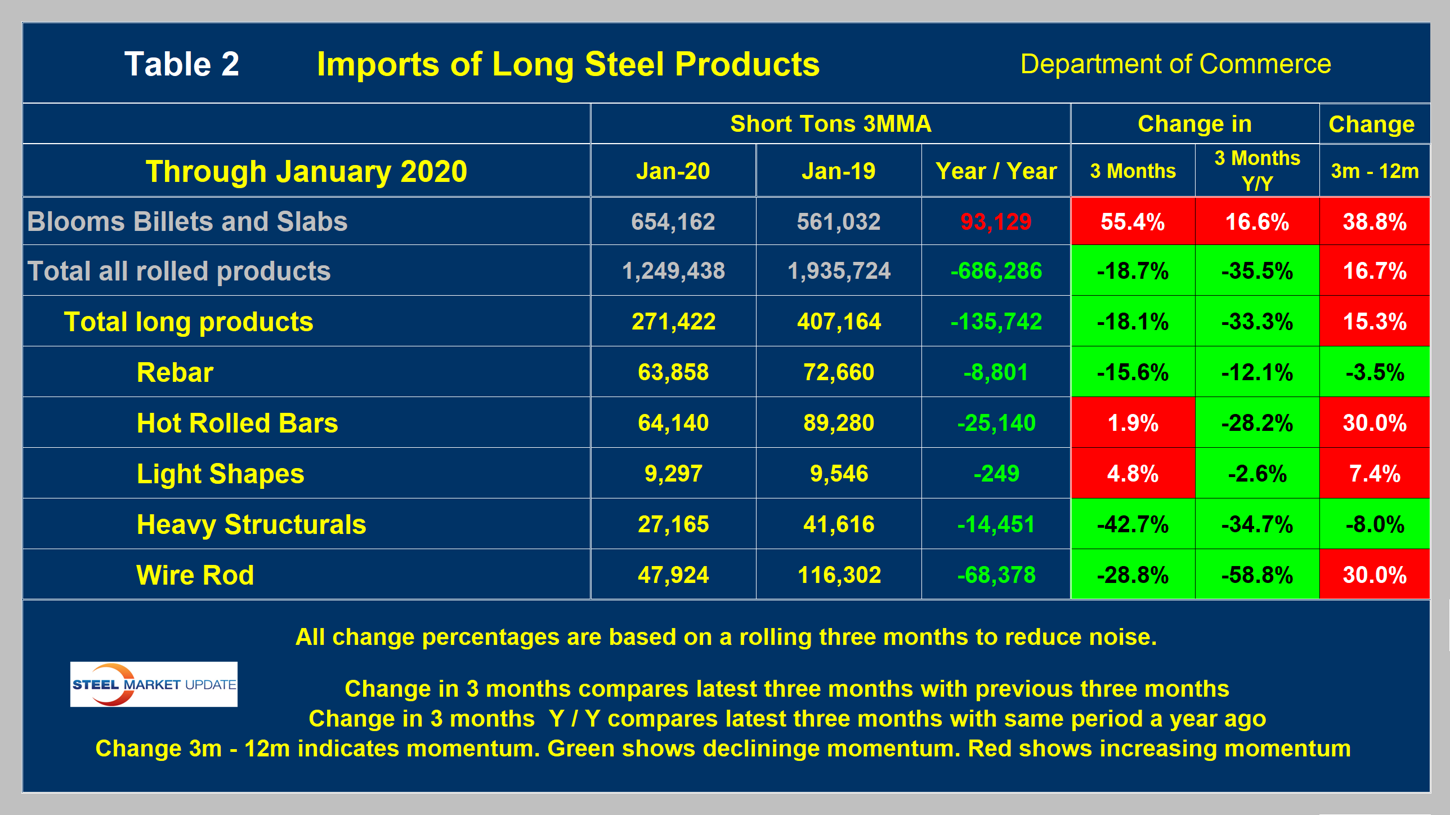
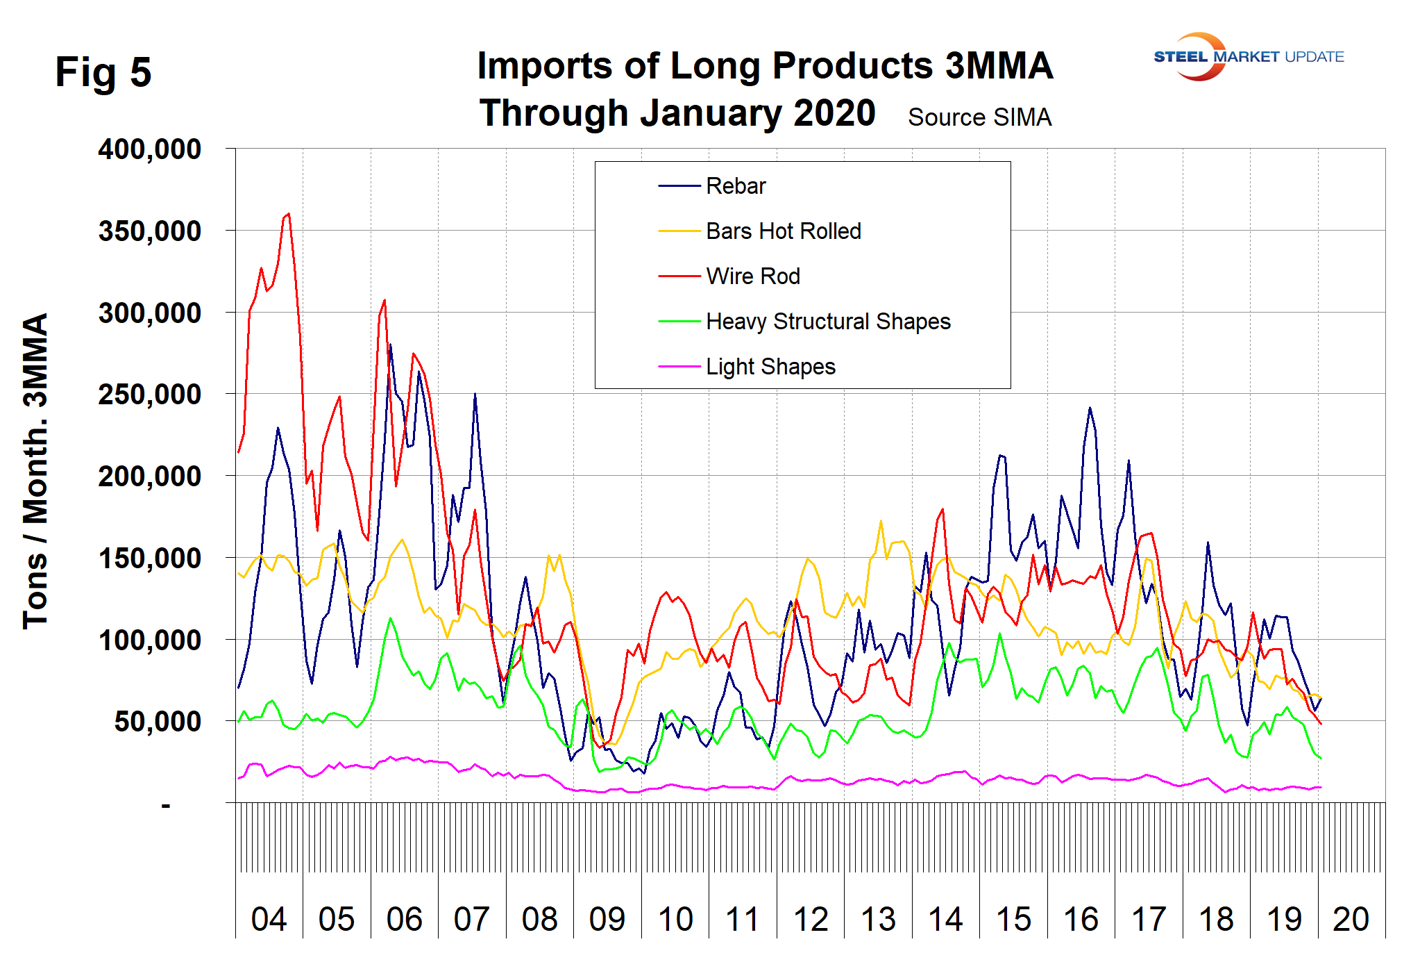
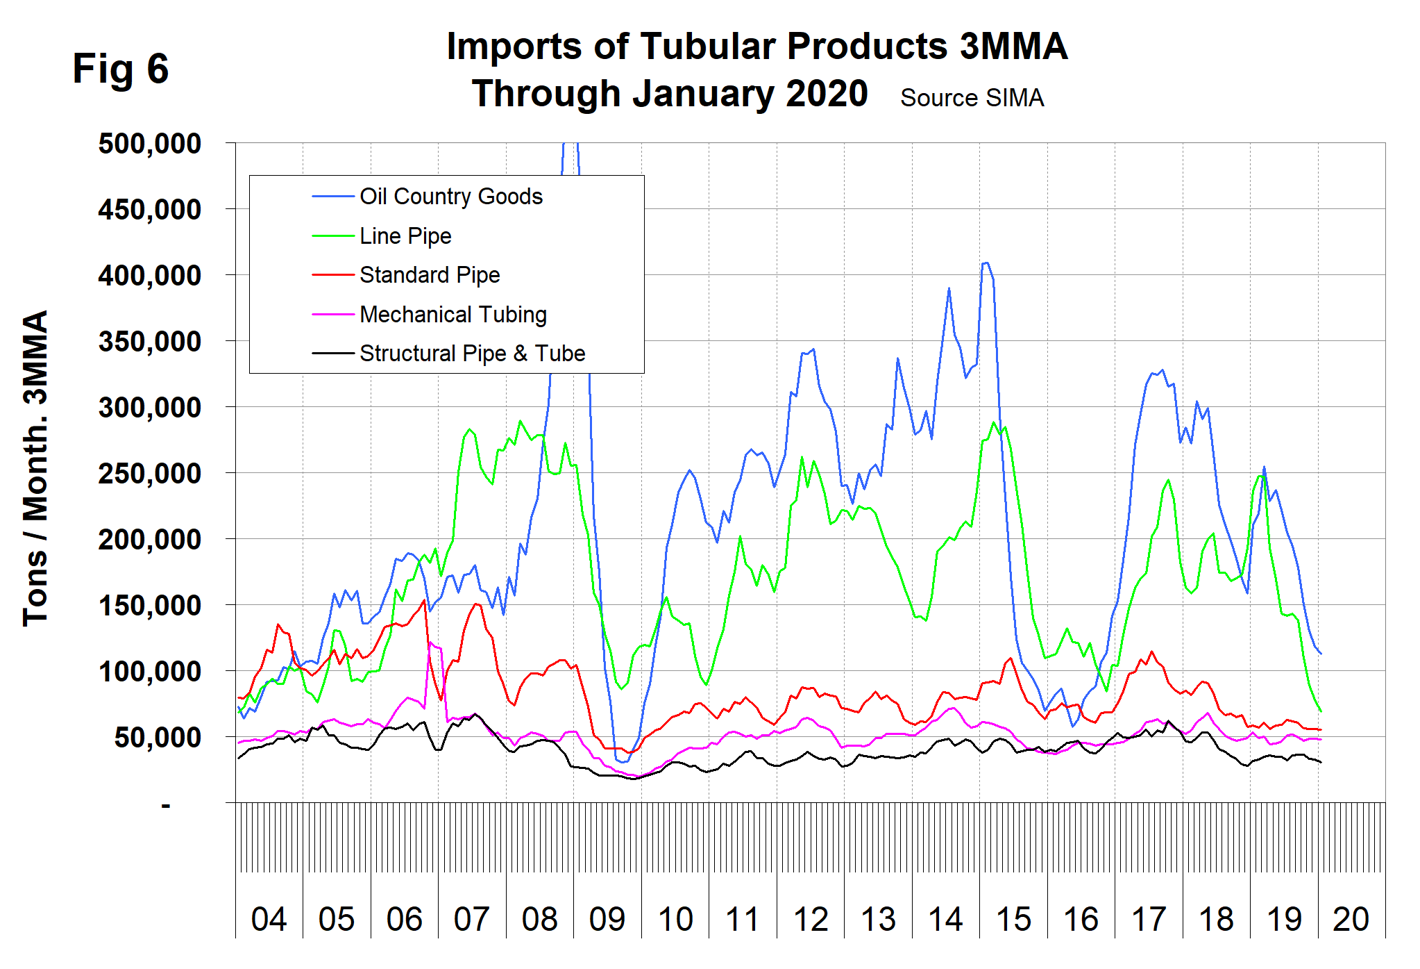
Table 3 shows that for tubular products in total the volume was down by 45.8 percent year over year with line pipe down the most and structural tubing down the least. Line pipe declined by 70.8 percent. Figure 6 shows the history of tubular imports since January 2004.
Explanation: SMU publishes several import reports ranging from this very early look using license data to the very detailed analysis of final volumes by product, by district of entry and by source nation, which is available in the Premium member section of our website. The early look is based on three-month moving averages using the latest license data, either the preliminary or final data for the previous month and final data for earlier months. We recognize that the license data is subject to revisions but believe that by combining it with earlier months in this way gives a reasonably accurate assessment of volume trends by product as early as possible. The main issue with the license data is that the month the tonnage arrives is not always the same month in which the license was recorded. In 2014, we conducted a 12-month analysis to evaluate the accuracy of the license data compared to final receipts. This analysis showed that the licensed tonnage of all carbon and low alloy products was 2.3 percent less than actual receipts, close enough to confidently include license data in this current update. The discrepancy declined continuously during the 12-month evaluation as a longer period was considered.
Statement from the Department of Commerce: The Steel Import Monitoring and Analysis (SIMA) system of the Department of Commerce collects and publishes data of steel mill product imports. By design, this information gives stakeholders valuable information on steel trade with the United States. This is achieved through two tools: the steel licensing program and the steel import monitor. All steel mill imports into the United States require a license issued by the SIMA office. The SIMA Licensing System is an online system for importers to register, apply for and receive licenses in a timely manner. In addition to managing the licensing system, SIMA publishes near-real-time aggregate data on steel mill imports into the United States. These data incorporate information collected from steel license applications and publicly released Census data. The data are displayed in tables and graphs for users to analyze. Additionally, SIMA provides data on U.S. steel mill exports, as well as imports and exports of select downstream steel products.

