Market Data

February 26, 2020
Domestic Mills Take Market Share Back from Imports
Written by Peter Wright
Domestic mills won back market share from imports in 2017, 2018 and 2019. Even though the steel market contracted by 1.9 percent in 2019, shipments by U.S. mills to domestic locations increased by 2.9 percent as imports declined.
Table 1 shows 13 years of history of total steel supply to the U.S. market in short tons broken down into shipments from domestic mills and imports, excluding semi-finished. The hot rolled steel market totaled 106.5 million tons in 2019. Supply declined in the steel recession of 2015 and 2016, increased in 2017 and 2018, and declined by 1.9 percent in 2019. In 2019, imports excluding semis totaled 20.1 million short tons, down from 28.3 million in 2017 and 24.6 million in 2018.
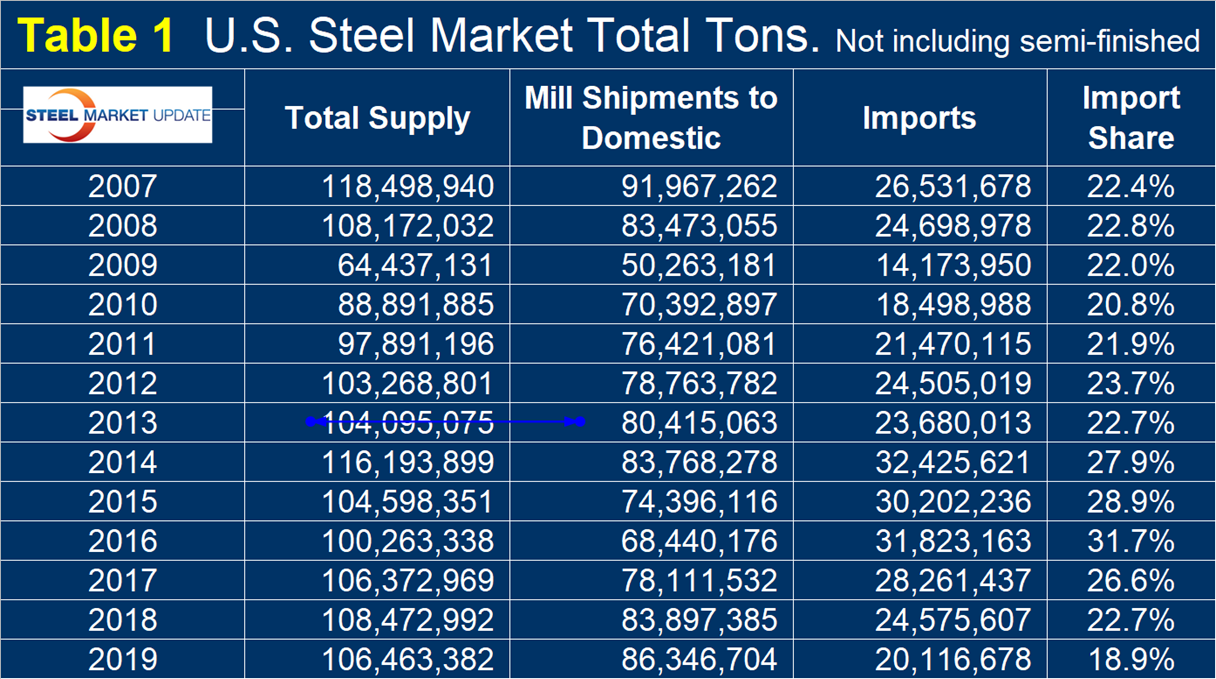
Table 2 shows the year-over-year change annually since 2006. In 2019, the total market was down 1.9 percent, but the domestic mills took share from imports. Compared to 2018, mill shipments to domestic locations were up by 2.9 percent, while imports were down by 18.1 percent.
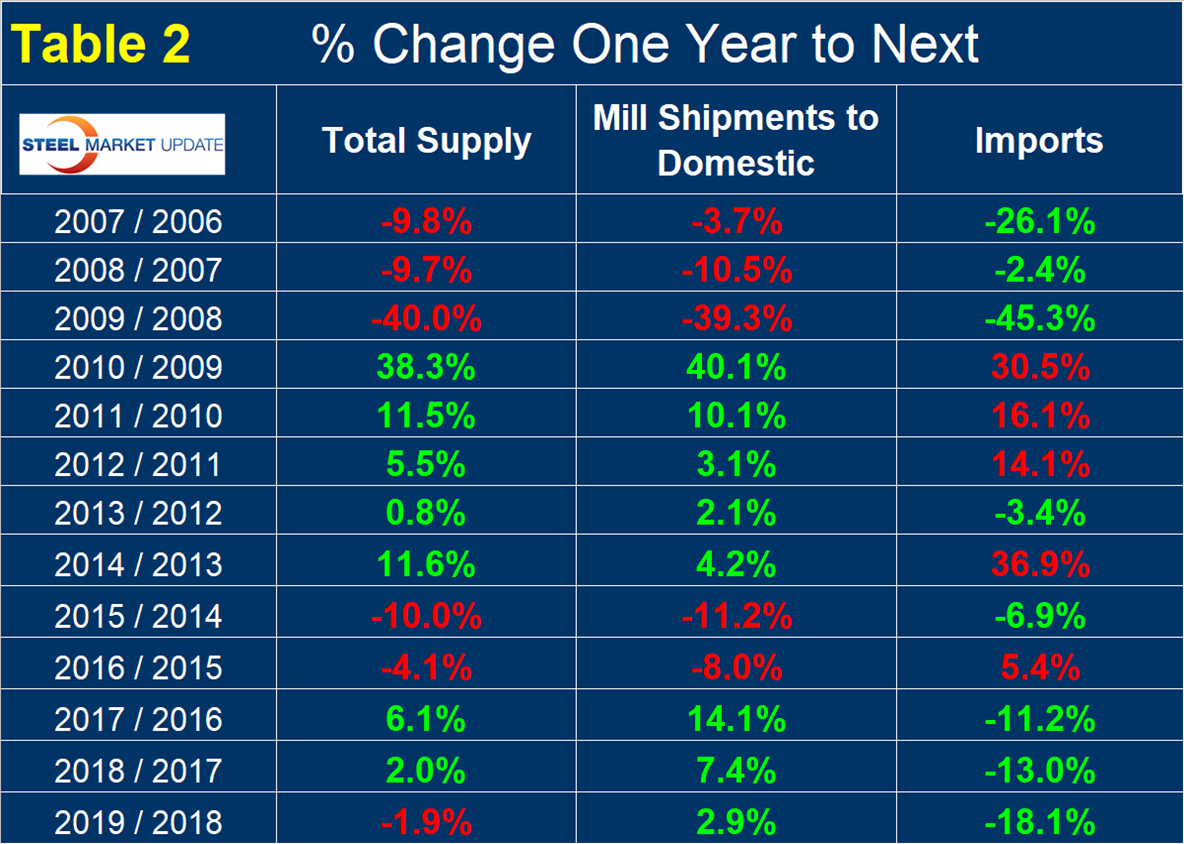
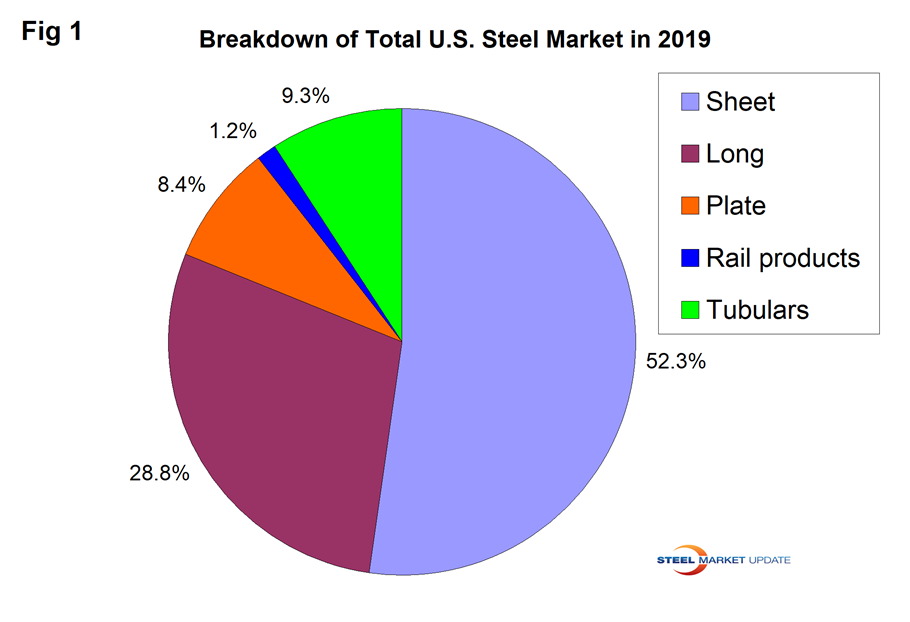
Figure 1 shows the relative size of the major sectors compiled from data from the American Iron and Steel Institute and the U.S. International Trade Commission. Sheet products comprised 52.3 percent of the market. Plate accounted for 8.4 percent, longs were 28.8 percent, tubulars were 9.3 percent and rail products 1.2 percent.
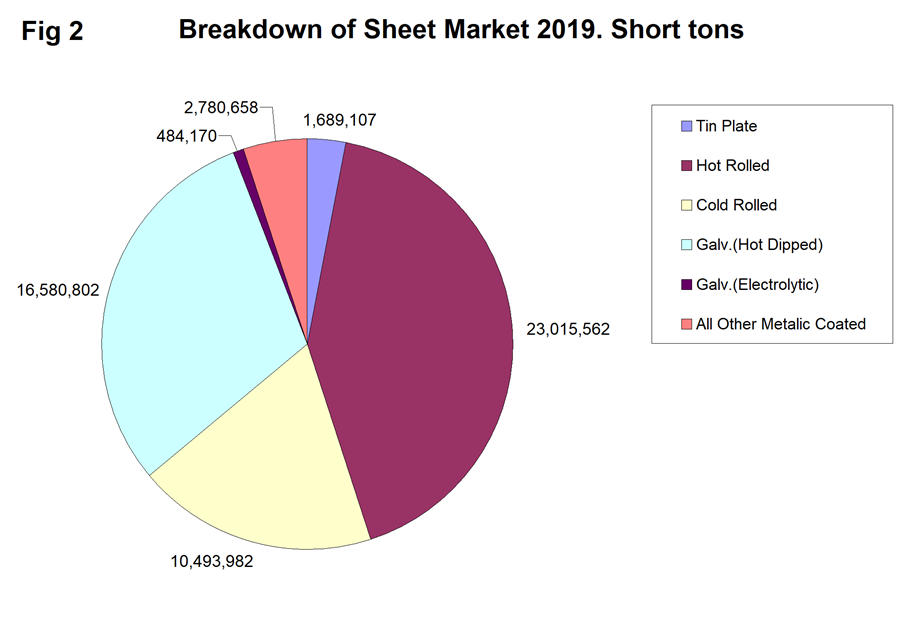
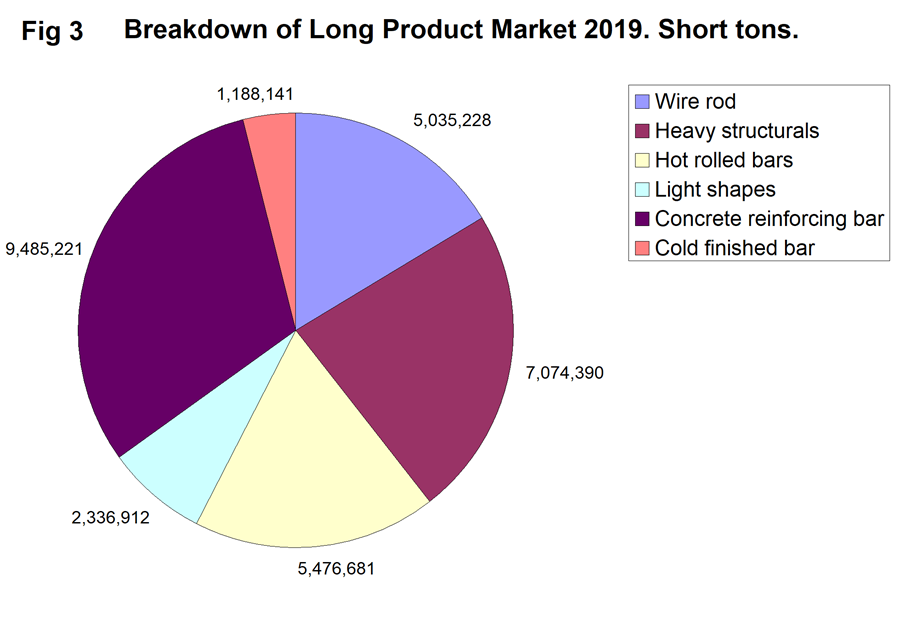
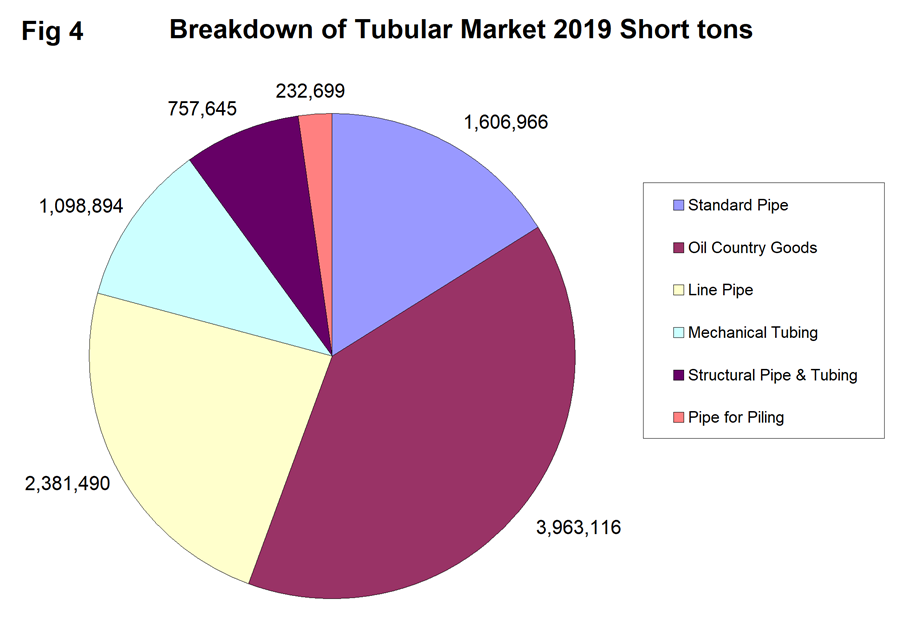
Figures 2, 3 and 4 break the sheet, longs and tubular sectors into tons by product.
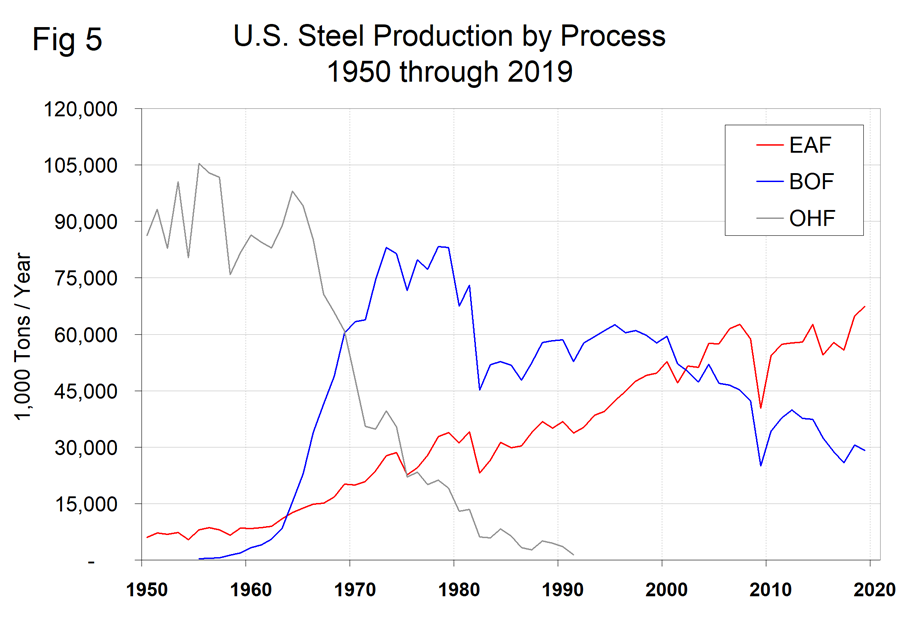
In 2019, the growth of the EAF sector continued at the expense of the integrated mills. Figure 5 shows the history of U.S. steel production by process since 1950. In 1969 the BOF overtook the open heath furnace as the primary producer and 34 years later in 2003, the BOF lost that status to the EAF. In 2009, 69.8 percent of U.S production was by the EAF, up from 68.0 percent in 2018. This trend is expected to continue for the foreseeable future and in addition to natural market trends will be accelerated by climate change considerations.