

Market Data

February 26, 2020
Global Steel Production Through January
Written by Peter Wright
If the coronavirus leads to a global pandemic, it will severely disrupt steel production.
Figure 1 shows annualized monthly global steel production on a three-month moving average (3MMA) basis and capacity utilization since January 2000. Based on OECD data (see below), the 3MMA for capacity utilization in January was 83.0 percent, down from 88.2 percent in May. On a tons-per-day basis, production in January was 4.932 million metric tons, down from June’s all-time high of 5.322 million metric tons.
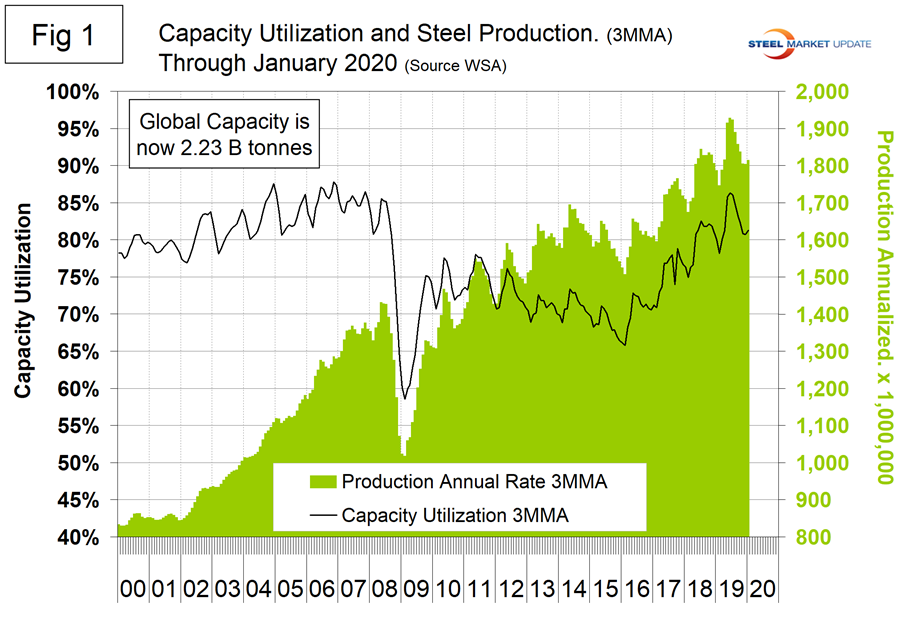
Figure 2 shows the average tons per day of production for each month since January 2011. December is historically the month with the lowest production. On average, January increased by 3.14 percent from December. In 2020, January increased by 1.95 percent, therefore in the big picture was worse than normal. The big picture is China versus everybody else, which is a huge divide when it comes to steel industry performance.
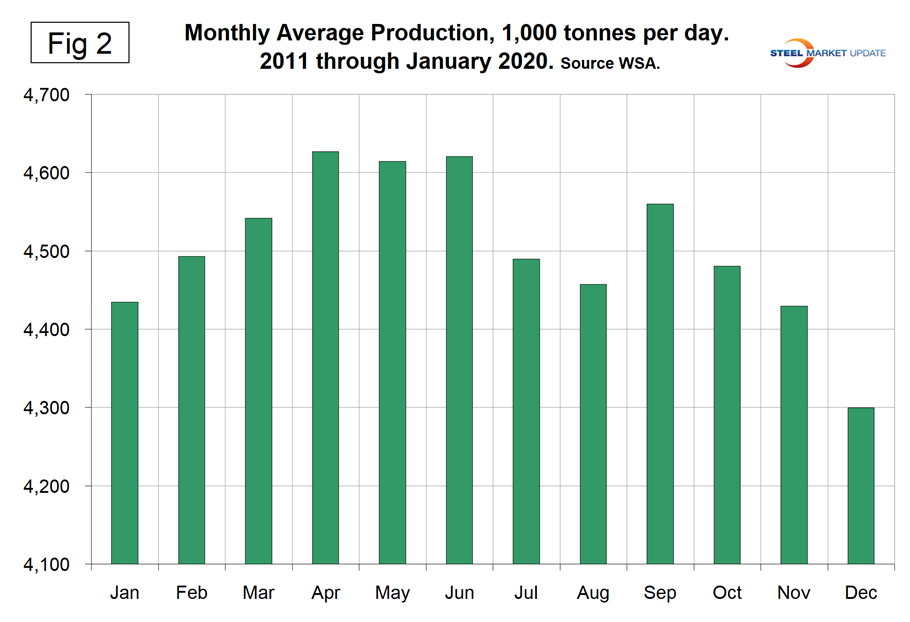
Figure 3 shows the year-over-year growth rate of the 3MMA of global production since January 2013. Growth in three months through January on a year-over-year basis was positive 1.6 percent, up from negative 1.3 percent in November, which was the first negative growth month since March 2016.
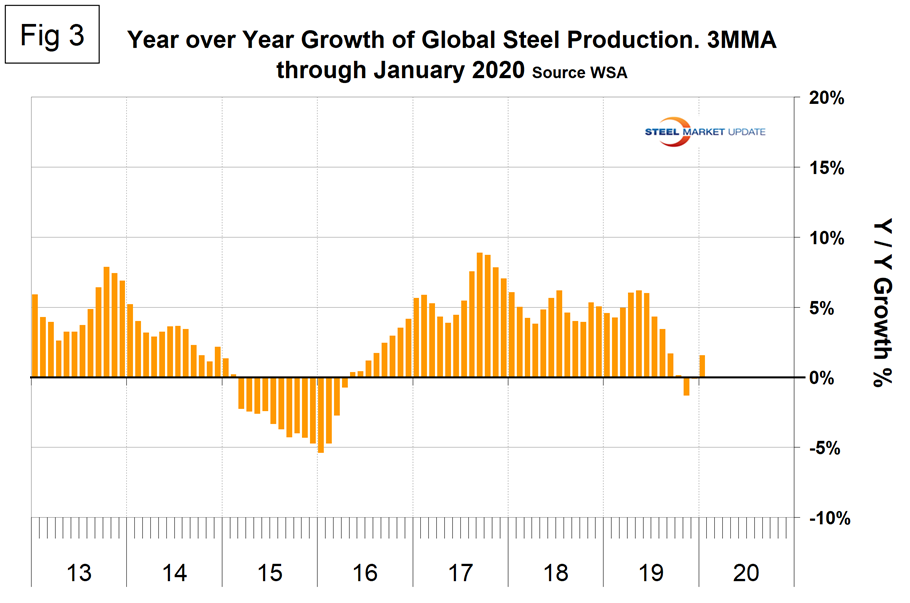
In three months year over year, China had positive growth in January of 7.6 percent. In the rest of the world, growth of steel production was negative 4.9 percent.
Table 1 shows global production broken down into regions, the production of the top 10 nations in the single month of January, and their share of the global total. It also shows the latest three months and 12 months of production through January with year-over-year growth rates for each period. Regions are shown in white font and individual nations in beige. The world overall had positive growth of 1.6 percent in three months and positive 3.0 percent in 12 months through January. When the three-month growth rate is lower than the 12-month growth rate, as it was each month in July through January, we interpret this to be a sign of negative momentum. On the same basis in January, China grew by 7.6 percent and 7.4 percent, and therefore had slightly positive momentum. All regions except Other Europe and Asia had negative growth in three months through January year-over-year. Table 1 shows that North America was down by 3.2 percent in the last three months. Within North America, production was down by 1.4 percent in the U.S., down by 2.2 percent in Canada and down by 12.6 percent in Mexico (Canada and Mexico are not shown in Table 1).
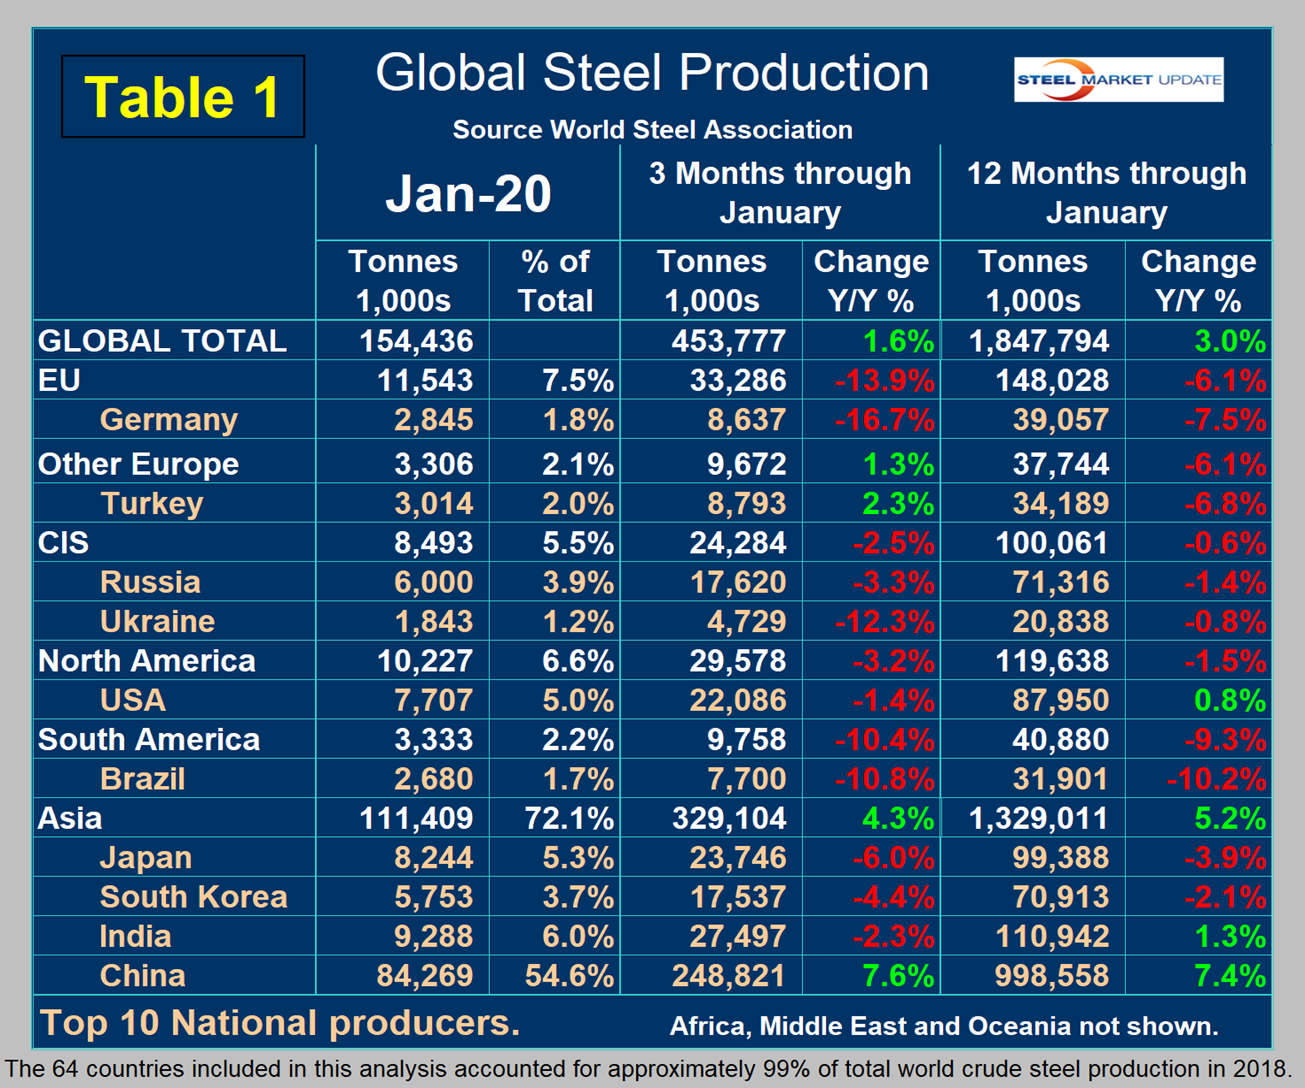
In the 12 months of 2019, 119.965 million metric tons were produced in North America, of which 73 percent was produced in the U.S., 11 percent in Canada and 16 percent in Mexico. Based on the OECD data, U.S. capacity in 2018 was 112.6 million metric tons with a capacity utilization of 76.9 percent. We don’t yet have the OECD capacity data for 2019.
Figure 4 shows China’s production since 2005. Production increased by four million tons in December to the highest level since August and held that level in January. The latest OECD data shows China’s capacity in 2018 to be 1,023,400,000 metric tons, while the WSA reported China’s production to be 924,752,000 metric tons, which yields a capacity utilization of 90.4 percent. We can’t make that calculation for 2019 production because we don’t know the current capacity.
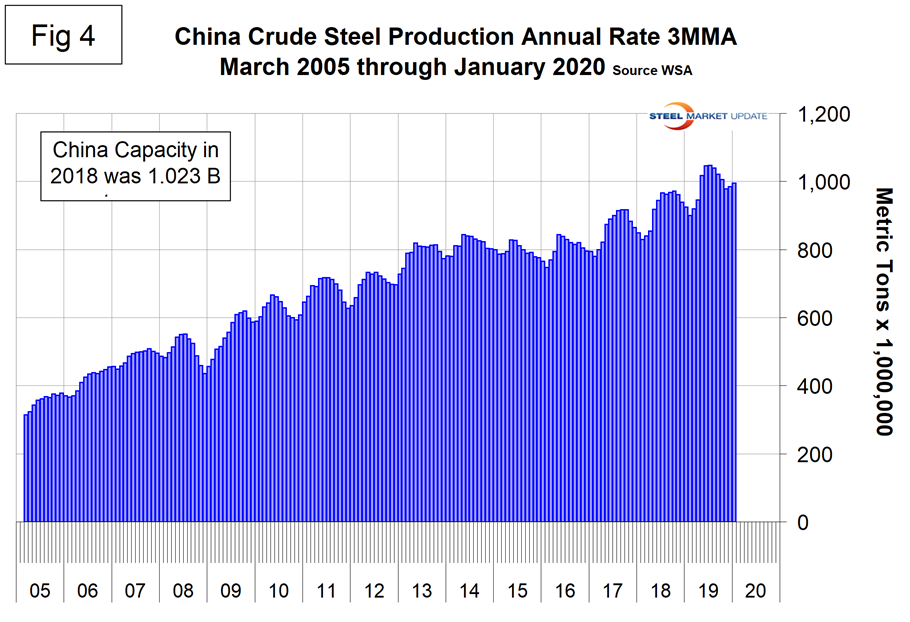
Figure 5 shows the growth of China’s steel production since January 2013 and Figure 6 shows the growth of global steel excluding China on the same scale. China’s domination of the global steel market is increasing.
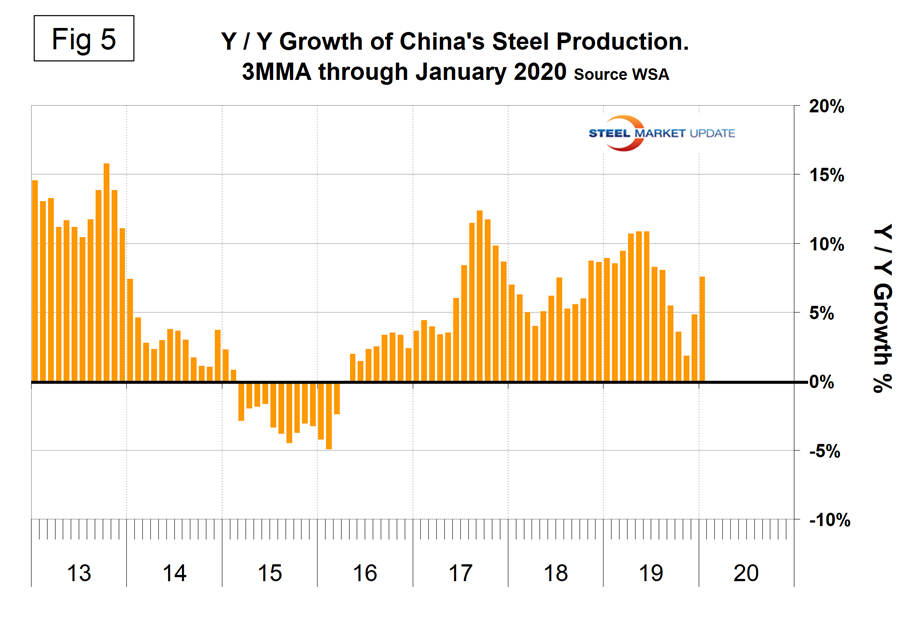
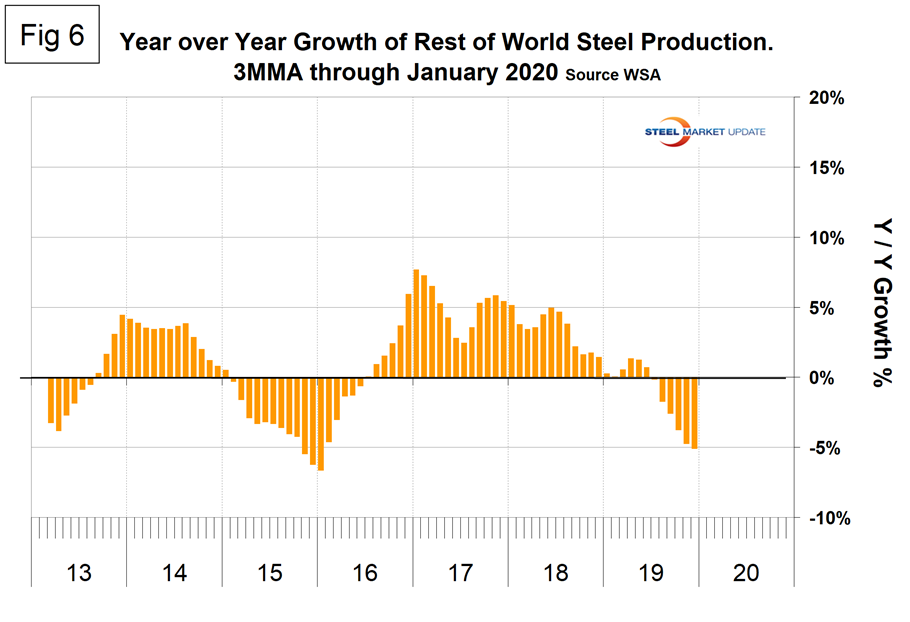
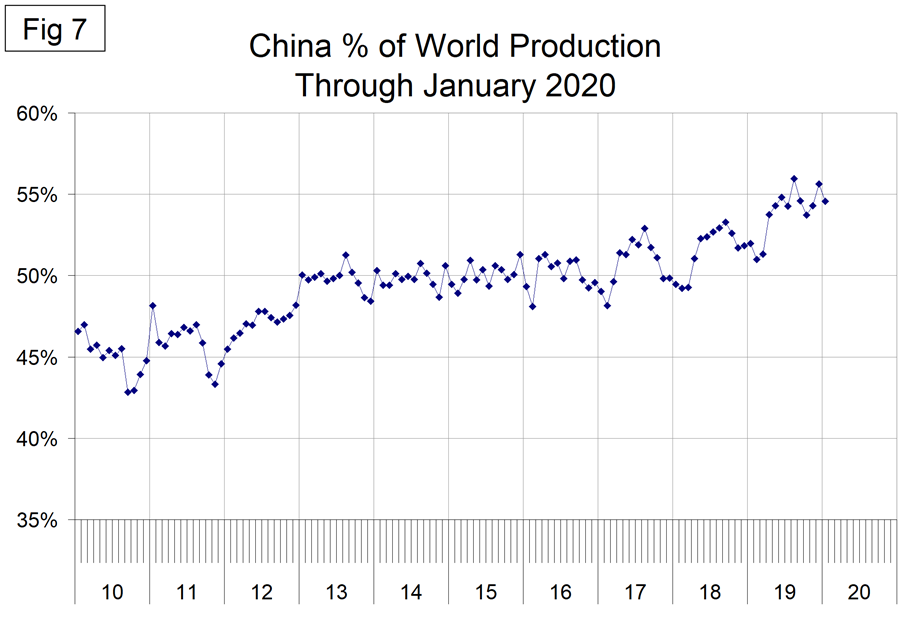
Figure 7 shows the growth of China’s share of global steel production, which in January was 54.6 percent, down from the all-time high of 56.0 percent in August.
The October 2019 WSA Short Range Outlook (SRO) for apparent steel consumption in 2019 and 2020 is shown by region in Figure 8.
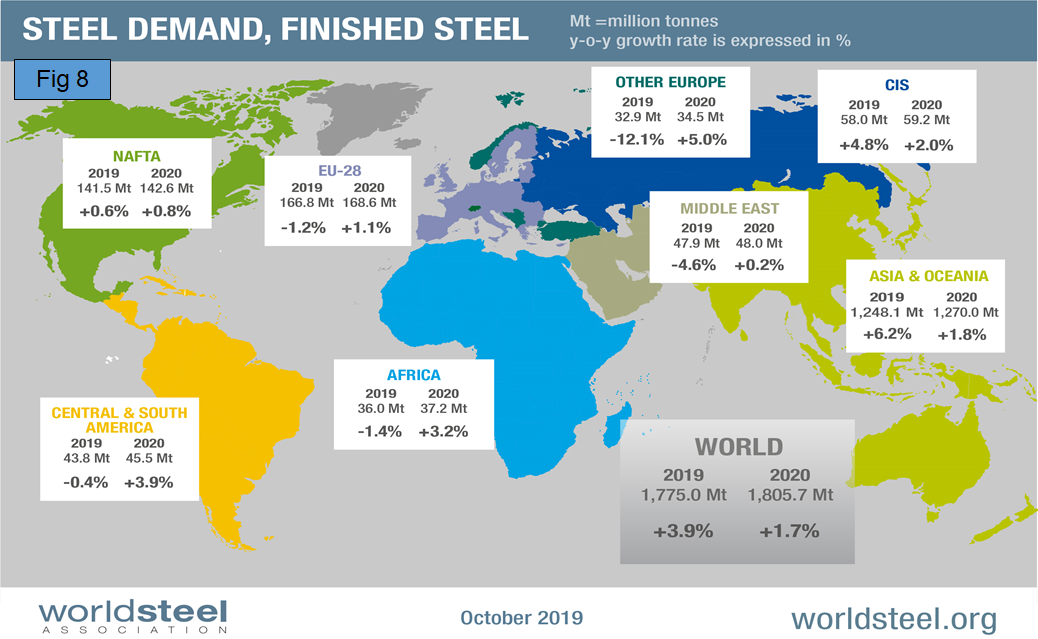
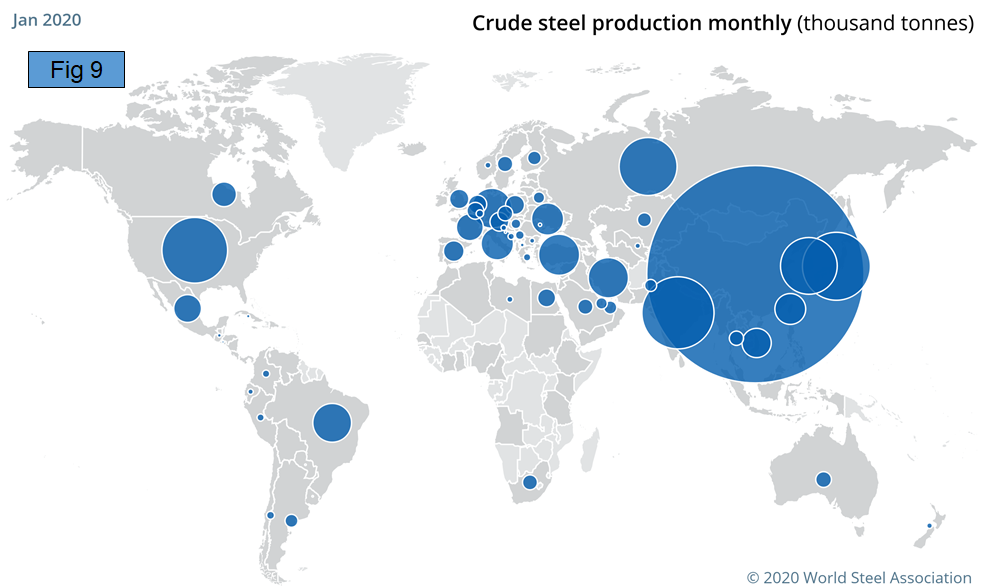
Figure 9 is a schematic from the WSA showing the relative production of the major steel producing nations in January.
SMU Comment: On Feb. 25, Mark Zandi of Moody’s Analytics wrote the following about the likely effect of the Corona virus. His comments are also relevant for future global steel production and raw materials prices: “China’s economy will contract in the first quarter of this year, and growth for the year will be cut by a full percentage point to 5.4%.The global economy will suffer a hit to GDP of almost a percentage point (annualized) in the first quarter, and slow by 0.4 percentage point to 2.4% in 2020. For context, global potential growth is an estimated 2.8%. The U.S. economy will experience growth of only 1.3% in the first quarter (annualized), down by 0.6 percentage point because of the virus. Growth in 2020 is now expected to be 1.7%, down 0.2 percentage point. The U.S. economy’s potential growth is estimated to be about 2%. The assumption that the virus will be contained to China appears increasingly tenuous, and the odds of a pandemic are rising. We previously put the odds of a pandemic at 20%, but we now put them at 40%. A pandemic will result in global and U.S. recessions during the first half of this year. The economy was already fragile before the outbreak and vulnerable to anything that did not stick to script. COVID-19 is way off script. COVID-19 came out of nowhere. It may be what economists call a black swan—a rare and inherently unforeseeable event with severe consequences. We all hope the global effort to contain the virus will ensure this black swan will not fly. But it is prudent to be prepared if it does.”
The WSA represents approximately 85 percent of the world’s steel production, including over 160 steel producers, national and regional steel industry associations, and steel research institutes (note at the bottom of Table 1 WSA says this represents 99 percent of steel production, so presumably there are reports of production by countries that include nonmembers). The OECD has taken over responsibility for tracking global steel capacity. Their data shows that global capacity declined each year 2016 through 2018. Capacity in 2018 was 2.234 billion metric tons, down from 2.322 billion tons in 2015.


