Prices

March 10, 2020
Update on Foreign Steel Imports
Written by Brett Linton
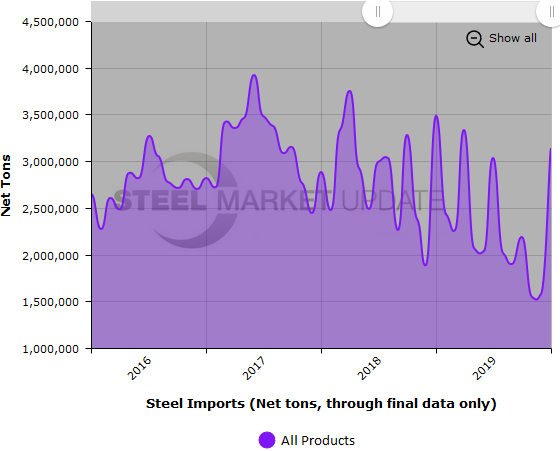
Final January steel import data was released this week, resting at 3.1 million net tons, according to the U.S. Department of Commerce. The last time a final monthly figure was this high was in April 2019 at 3.3 million tons. License data currently shows February imports at 1.8 million tons.
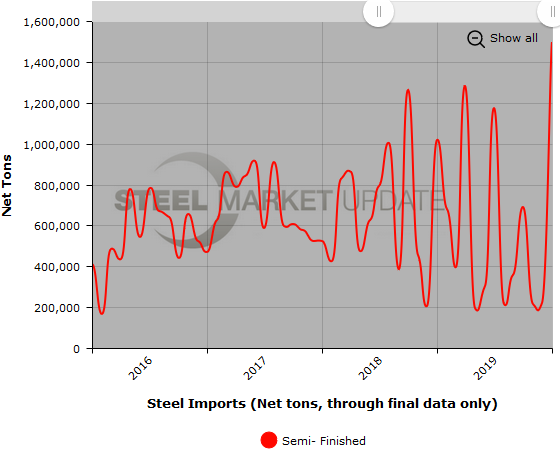
As previously mentioned, the total January import figure is unusually high as a result of buyers seeking to max out quarterly quota limits on semi-finished products. For the remainder of the first quarter, semi-finished imports should be significantly lower. January semi-finished imports were 1.5 million tons, the highest level seen in SMU’s 10+ year history.
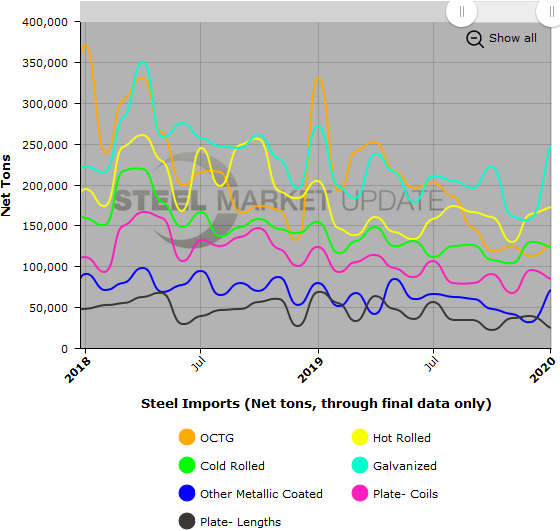
Finished imports in January totaled 1.6 million tons, slightly below the 2019 finished import average of 1.8 million tons. The only noteworthy product mention is for galvanized imports, rising to nearly 250,000 tons in January, levels not seen in the past two years.
The latest February license data shows roughly 1.5 million tons of finished product imports and 400,000 tons for finished products.
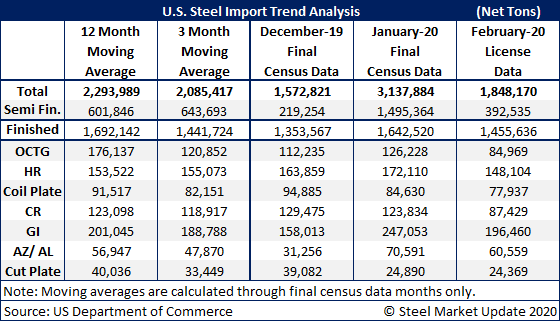
The table below shows total steel imports through final January data. For comparison, in January 2019, 3.5 million tons of steel were imported. The 2019 monthly average was 2.3 million tons per month, while 2018 averaged 2.8 million tons per month and 2017 averaged 3.2 million tons per month.
Semi-finished imports jumped to a record 1.5 million tons in January, whereas 1.0 million tons were brought into the country in January 2019. To smooth out the monthly swings, the 2019 monthly average for semi-finished steels was 560,000 tons per month, down from 650,000 tons per month in 2018 and down from 690,000 tons in 2017.
The graphic below shows the seven other steel products tracked by SMU; for an expansive view, use the interactive imports graphing tool on our website.