Premium

March 23, 2020
Global Scrap Market: U.S. Share Increases
Written by Peter Wright
Global scrap trade has been trending down for two years and in Q4 2019 the U.S. share increased to 26.8 percent, the highest since Q1 2013.
This is a quarterly analysis using data from the Iron and Steel Statistics Bureau (ISSB) in the UK. Some nations are slow to report, which results in the analysis being two months in arrears, but it offers a valuable perspective on global trends. All tonnages in this report are metric.
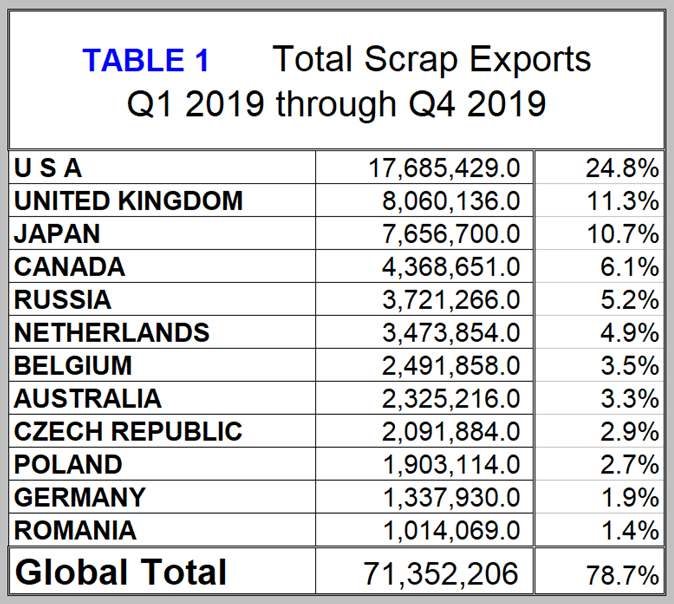
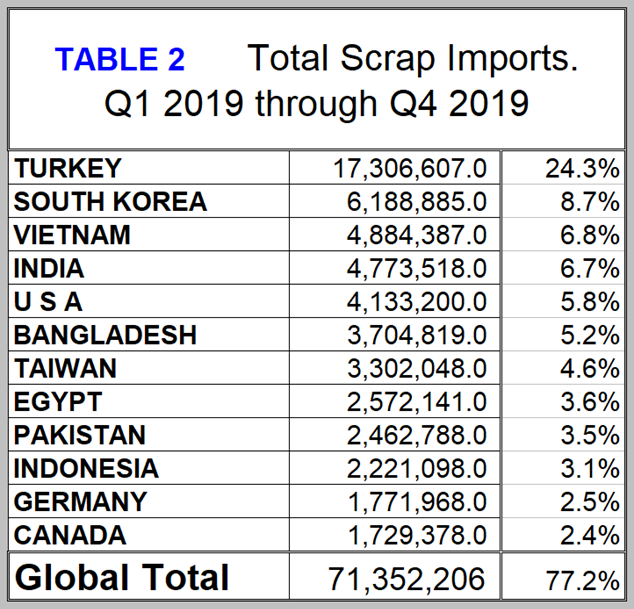
As is always the case, the U.S. was the highest volume exporter and Turkey the highest volume importer in 2019, and these tonnages were almost exactly the same. Tables 1 and 2 show the total 2019 volume of exports and imports for the top 12 trading nations. These 12 nations accounted for 78.7 percent of the export trade and 77.2 percent of the import trade. In Table 1 the export tonnage allocated to the Netherlands and Belgium accounts for the volume shipped out of Rotterdam and Antwerp and is not an indication of the volume produced in those countries. Of particular note in Table 2 is that Vietnam is the third highest volume importer and the U.S. is the fifth. Of the tonnage entering the U.S., 72.4 percent came from Canada, 15.3 percent from Mexico and 3.3 percent from the UK. All other sources were negligible.
This analysis excludes movements within the EU from the global total. Figures 1 and 2 show the total tonnage of global trade since Q1 2000 and the volume of the top five suppliers. These five are the U.S., the EU, the UK, Japan and Russia, and since 2002 they have accounted for over two-thirds of the total. Figure 2 is the same as Figure 1 with the total removed. Total global trade in ferrous scrap has declined slightly in the latest 10 quarters, but the U.S. export tonnage has trended up in the same time frame.
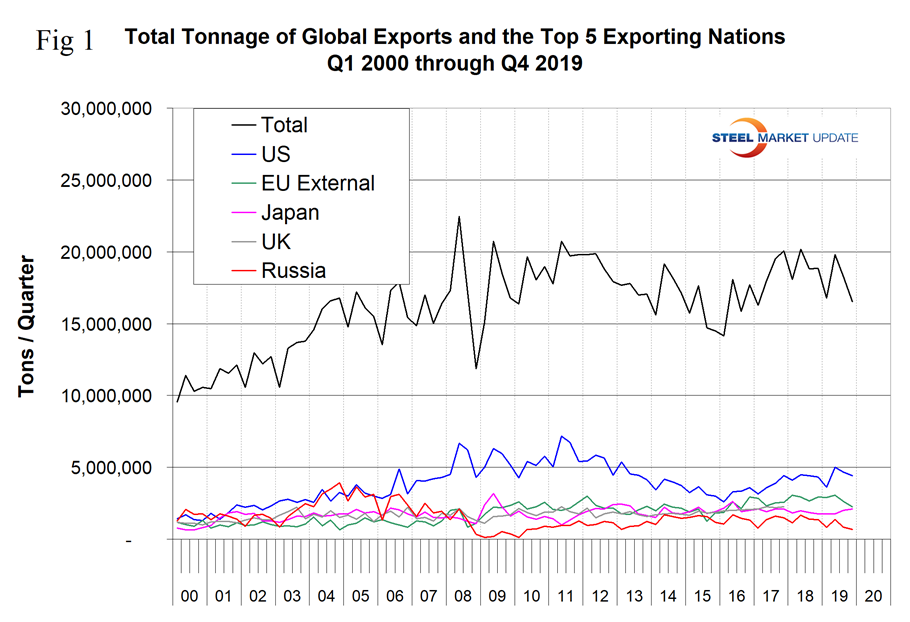
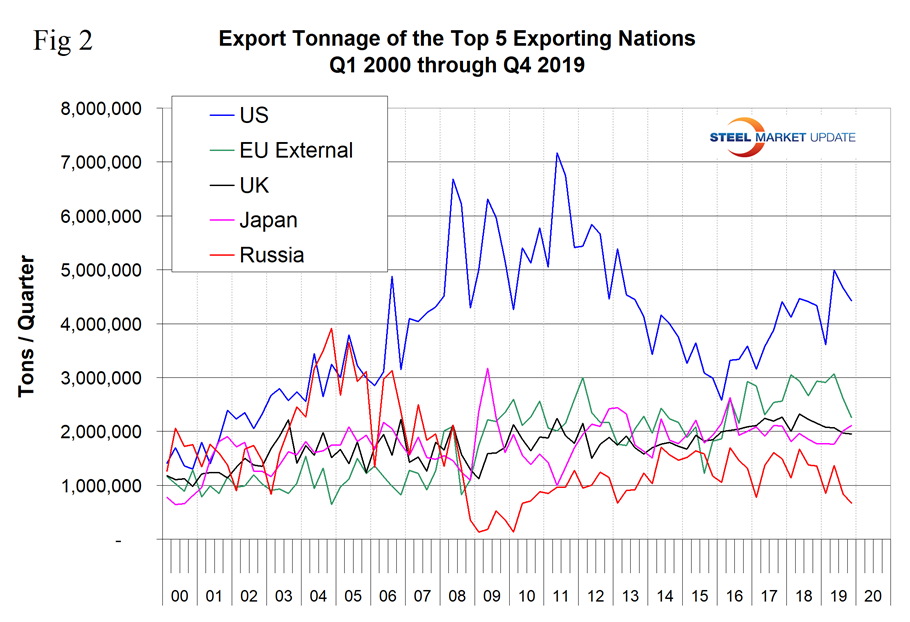
Figure 3 shows the global market share of the top five exporters. After declining for the seven years 2009 through 2015, the U.S. share increased in the four years 2016 through 2019. The U.S. has been the highest volume exporter every quarter since Q4 2005.
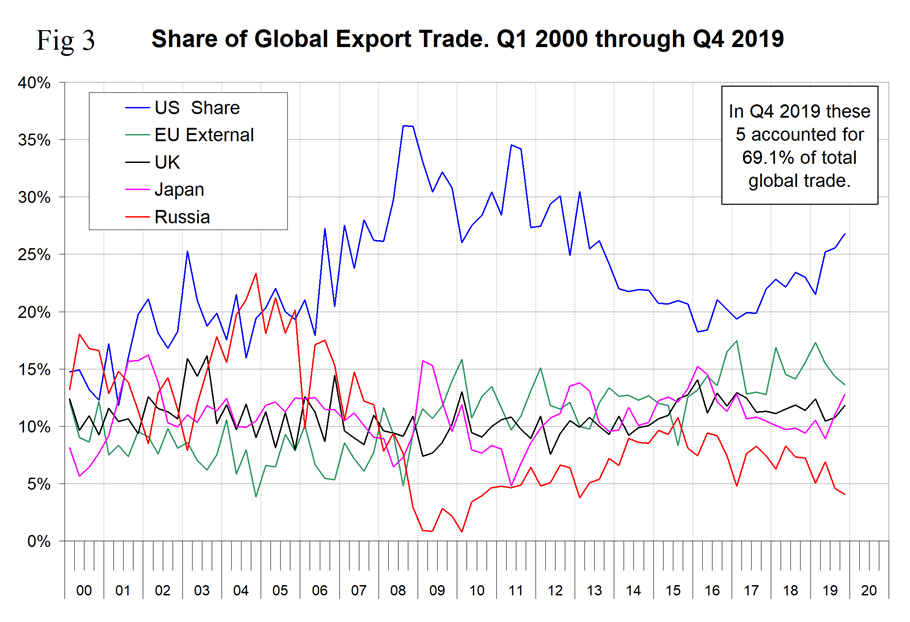
Figure 4 shows the correlation of 69.3 percent since 2010 between the U.S. share of global scrap trade and the domestic scrap price. This relationship decoupled in the last three quarters of 2019. Figure 5 shows a negative correlation between the Broad Index value of the U.S. dollar and the U.S. share of global trade. There is a causal element to this relationship; when the dollar strengthens, U.S. scrap on the global market becomes more expensive and the U.S. share should decline. Prior to Q4 2014 there was a negative 71 percent correlation between the U.S. dollar and U.S global share. Since then the two have decoupled, possibly because of the effect of the stronger U.S. economy, which has boosted mill output and the increasing share of the EAF as the domestic producer. In addition, the distortive effects of Section 232 tariffs may have been a factor.
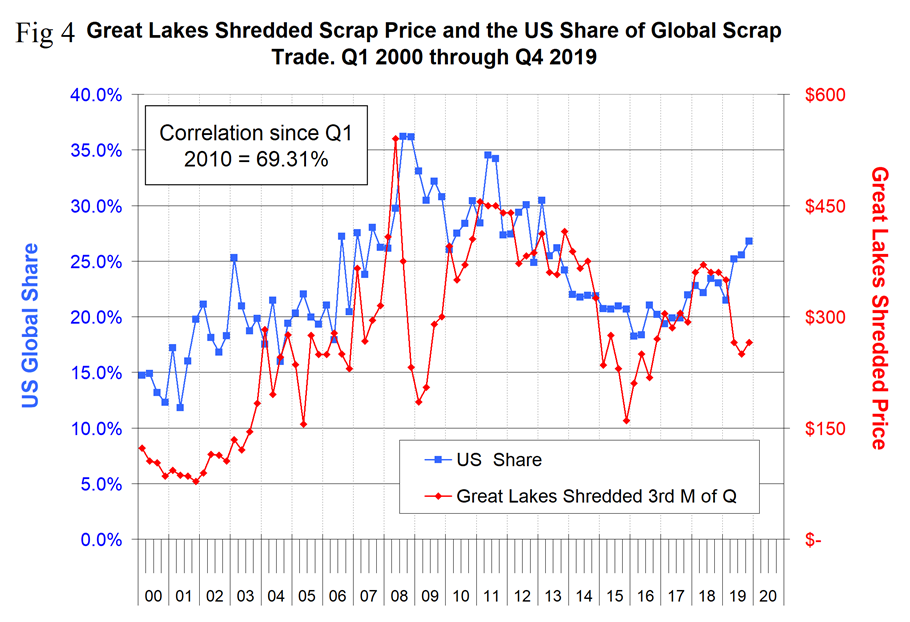
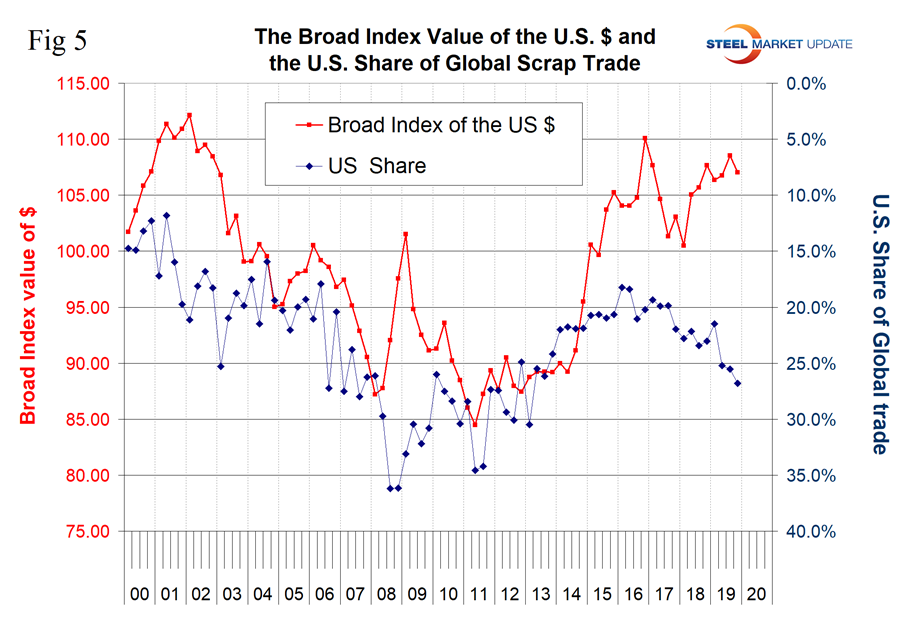
Figure 6 shows the tonnage received by the four major importing nations. Turkey is by far the largest global scrap buyer and in most quarters since Q1 2010 has been in the range 4 to 5 million metric tons per quarter. The growth of Vietnam is clearly shown since Q4 2006, to the point that in Q4 2019 Vietnamese imports accounted for 6.8 percent of total global scrap trade.
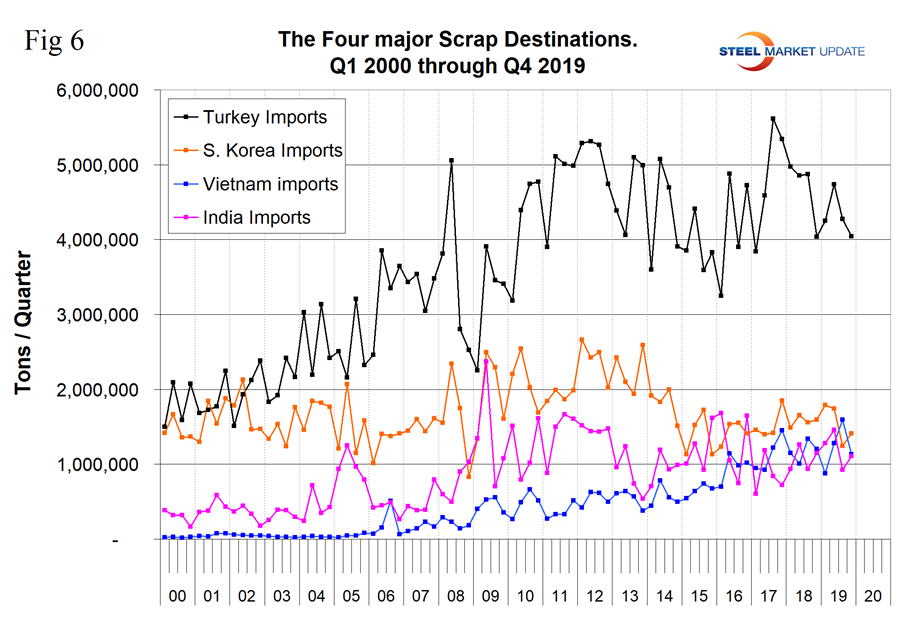
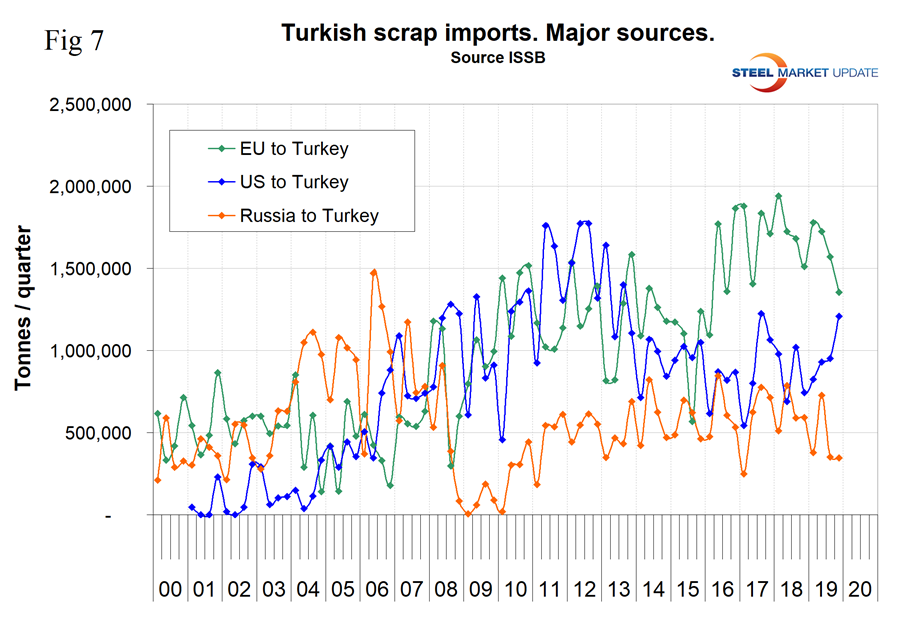
Figure 7 quantifies the volume of the three major scrap suppliers to Turkey since the year 2000. In 2019 the U.S. increased its share of volume into Turkey at the expense of the EU. The Russian volume has been trending down since Q2 2018.
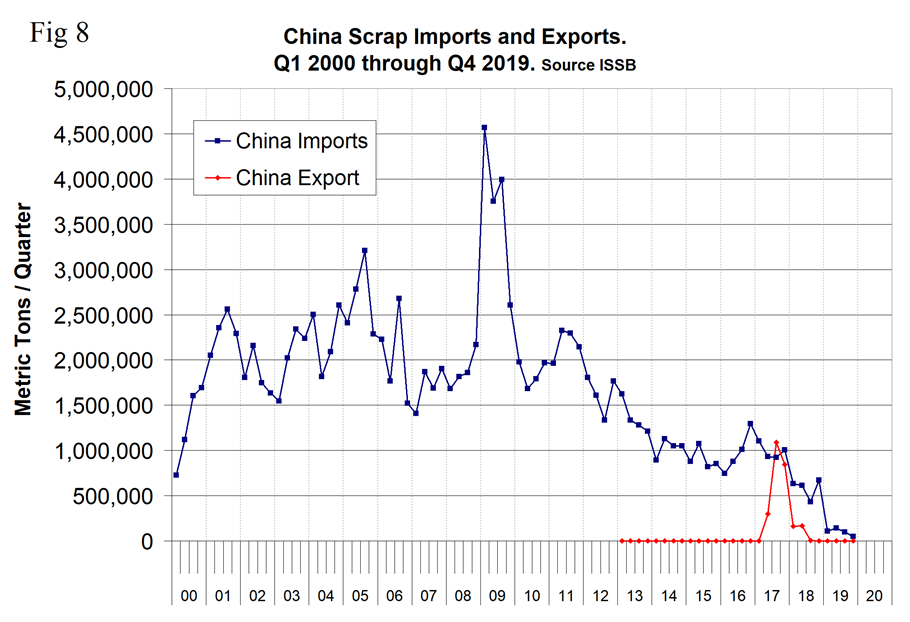
In the course of these analyses, we will keep our eye on what is going on in China. In the third quarter of 2017, China became a net scrap exporter, according to data published by their trade administration. Since then China’s exports have declined to almost zero. Figure 8 shows that Chinese imports have also declined to almost zero. In 2018 almost all scrap exporters were fined or jailed for evading taxes on the value of the material, and currently scrap exports are restricted. Eventually this will change as the balance of BOF and EAF capacity in China will not be able to absorb the volume of obsolete scrap produced.