

Market Data

March 24, 2020
Global Steel Production Through February
Written by Peter Wright
Global steel production was relatively strong in February, but that was before the coronavirus really began to slow the economy. The IMF projects that the impending global recession will be as bad or worse than the global financial crisis a decade ago .
Figure 1 shows annualized monthly global steel production on a three-month moving average (3MMA) basis and capacity utilization since February 2000. Based on OECD data (see below), capacity utilization in February on a 3MMA basis was 77.0 percent, and January was revised down to 80.9 percent. On a tons-per-day basis (not a 3MMA), production in February was 4.941 million metric tons, down from June’s all-time high of 5.305 million metric tons, but actually up by 1.7 percent from January.
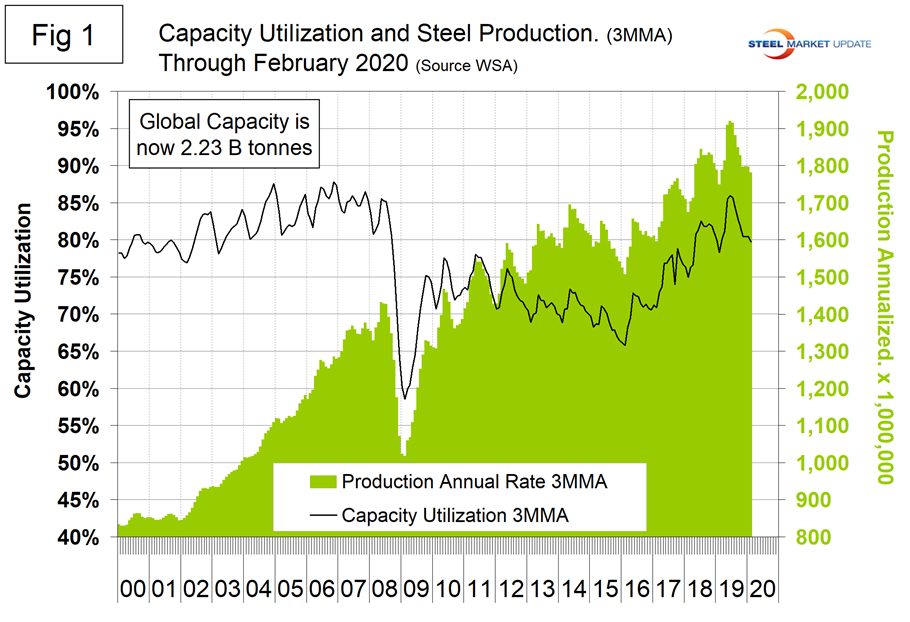
Figure 2 shows the average tons per day of production for each month since January 2011. February is historically the month with the lowest production. On average (not a 3MMA), February decreased by 8.6 percent from January. In 2020, February increased by 1.9 percent, therefore in the big picture was better than normal.
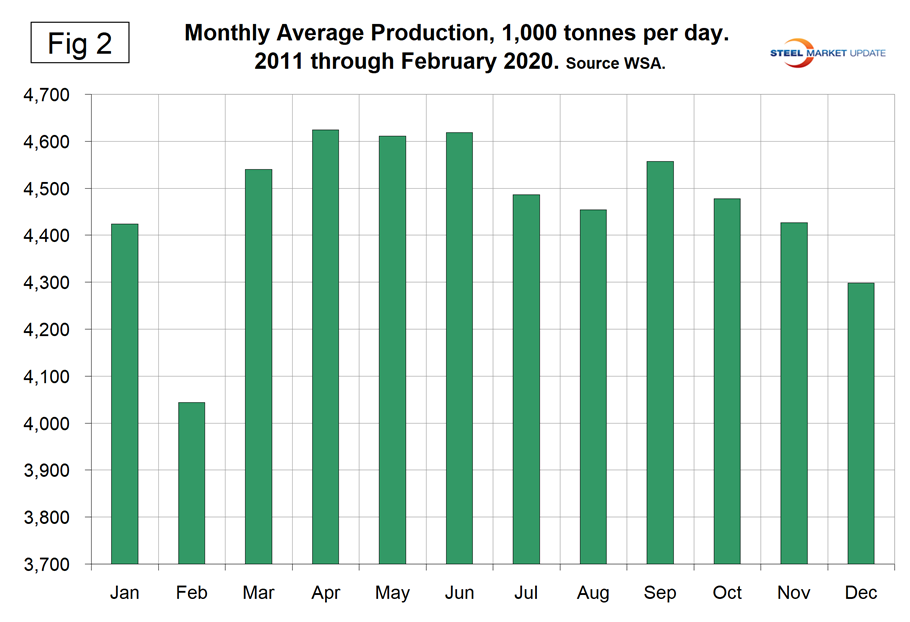
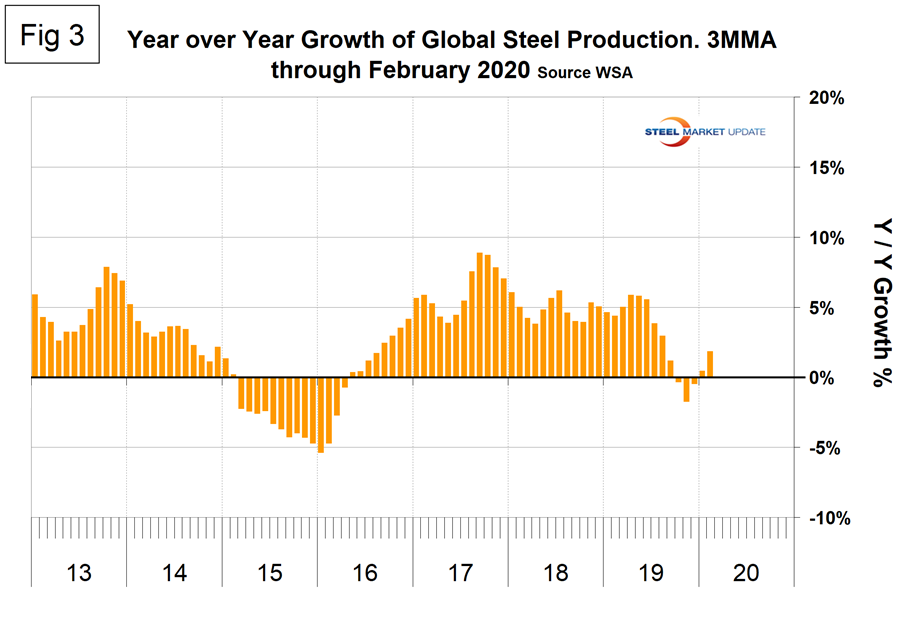
Figure 3 shows the year-over-year growth rate of the 3MMA of global production since February 2013. Growth in three months through February on a year-over-year basis was positive 1.8 percent, up from positive 0.5 percent in January.
In three months year over year, China had positive growth in February of 5.9 percent. In the rest of the world, steel production declined by 2.5 percent.
Table 1 shows global production broken down into regions, the production of the top 10 nations in the single month of February, and their share of the global total. It also shows the latest three months and 12 months of production through February with year-over-year growth rates for each period. Regions are shown in white font and individual nations in beige. The world overall had positive growth of 1.8 percent in three months and positive 2.2 percent in 12 months through February. When the three-month growth rate is lower than the 12-month growth rate, as it was each month in July through February, we interpret this as a sign of negative momentum. On the same basis in February, China grew by 5.9 percent and 6.6 percent, therefore also had negative momentum. All regions except Other Europe had negative growth in three months through February year-over-year. Table 1 shows that North America was down by 2.0 percent in the last three months. Within North America, production was up by 0.7 percent in the U.S., up by 0.3 percent in Canada, and down by 15.7 percent in Mexico. (Canada and Mexico are not shown in Table 1.)
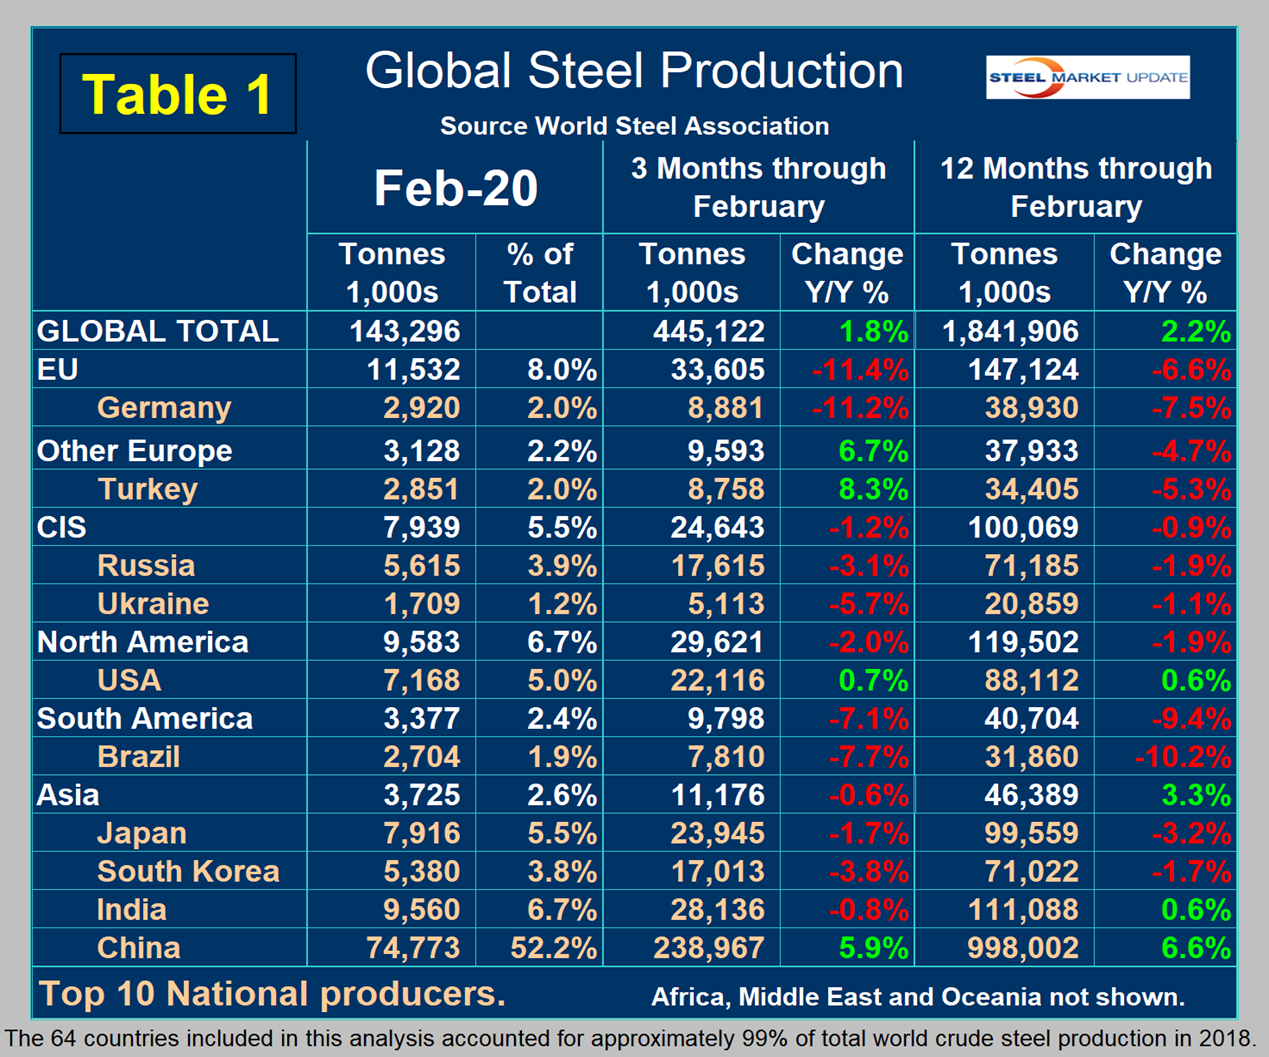
In the 12 months of 2019, 119.965 million metric tons were produced in North America; 73 percent was produced in the U.S., 11 percent in Canada and 16 percent in Mexico. Based on the OECD data, U.S. capacity in 2018 was 112.6 million metric tons with a capacity utilization of 76.9 percent. The OECD capacity data for 2019 is not yet available.
Figure 4 shows China’s production since 2005. In February, China’s production was down by 6.0 percent, but that was entirely due to the reduced number of days; tons per day in January and February were exactly the same. The latest OECD data shows China’s capacity in 2018 to be 1,023,400,000 metric tons, and the WSA reported China’s production in 2018 to be 924,752,000 metric tons, which yields a capacity utilization of 90.4 percent. We can’t make that calculation for 2019 production because we don’t know the current capacity.
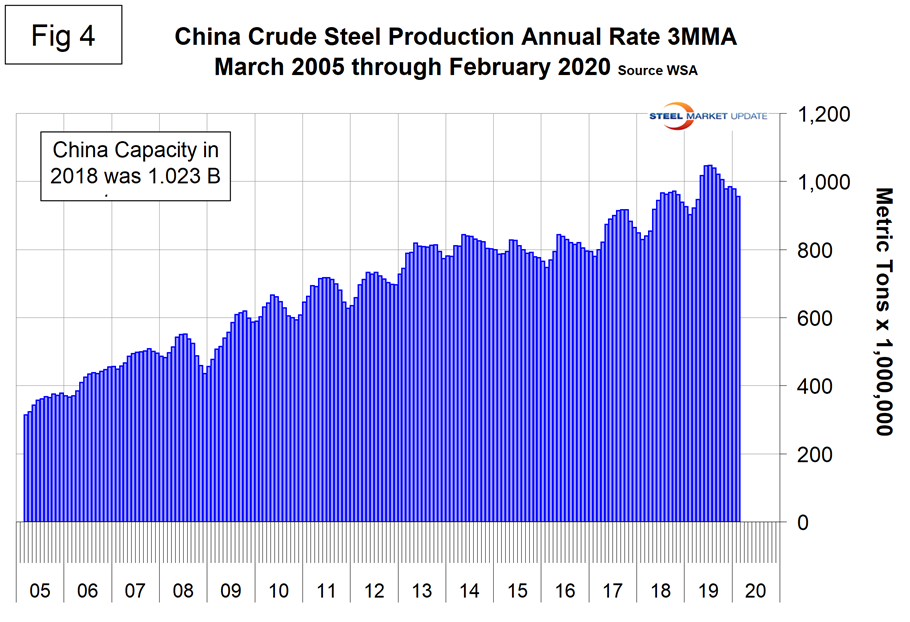
Figure 5 shows the growth of China’s steel production since February 2013 and Figure 6 shows the growth of global steel excluding China on the same scale. China’s domination of the global steel market continues to increase.
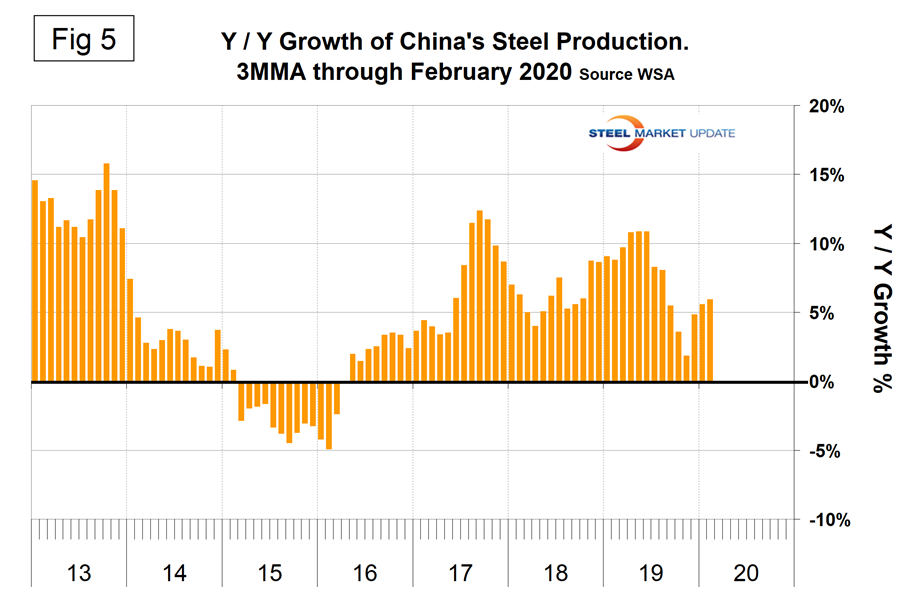
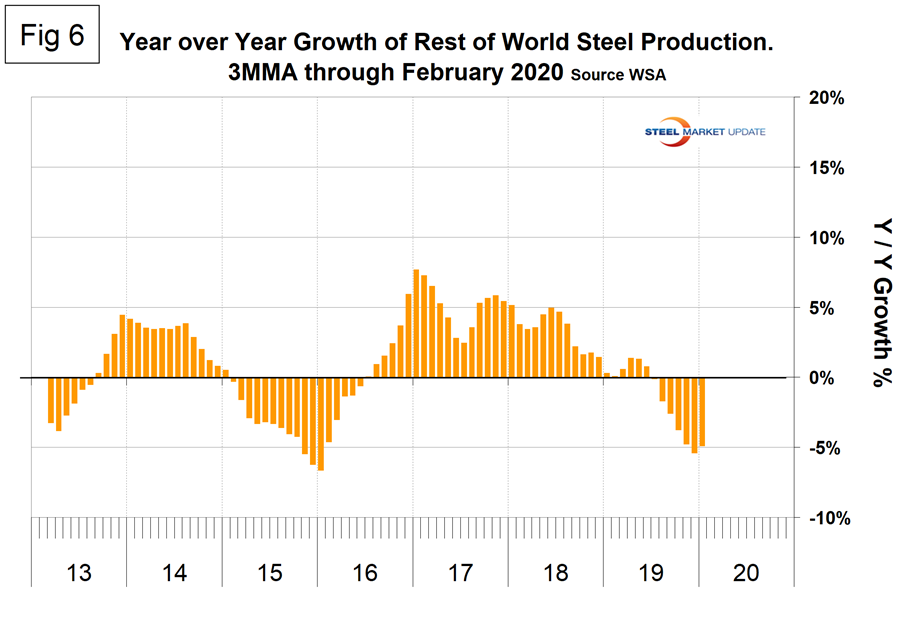
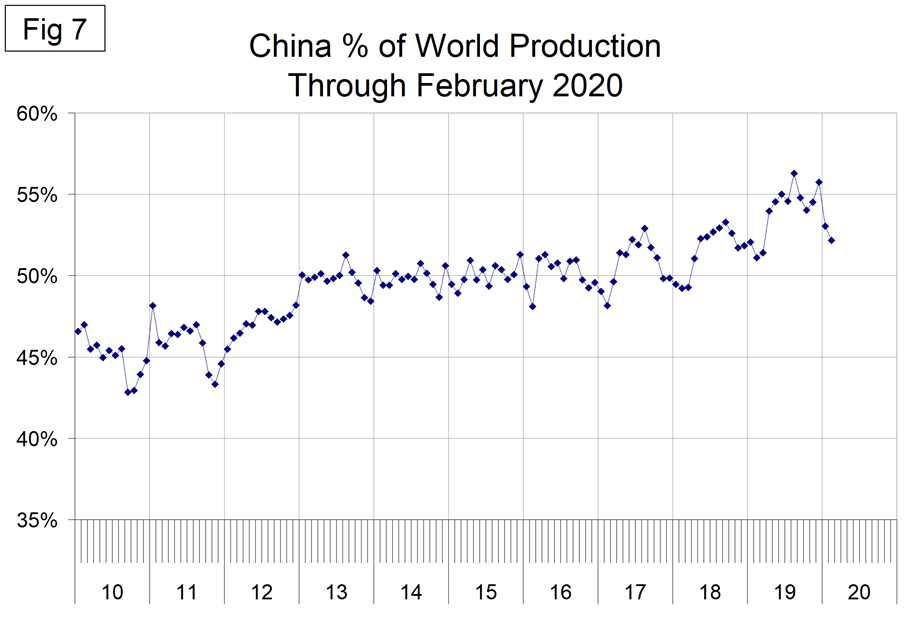
Figure 7 shows the growth of China’s share of global steel production, which in February was 52.2 percent, down from all-time highs of 56.0 percent in August and December 2019.
The October 2019 WSA Short Range Outlook (SRO) for apparent steel consumption in 2019 and 2020 is shown by region in Figure 8. This has not been revised to take into account the new reality.
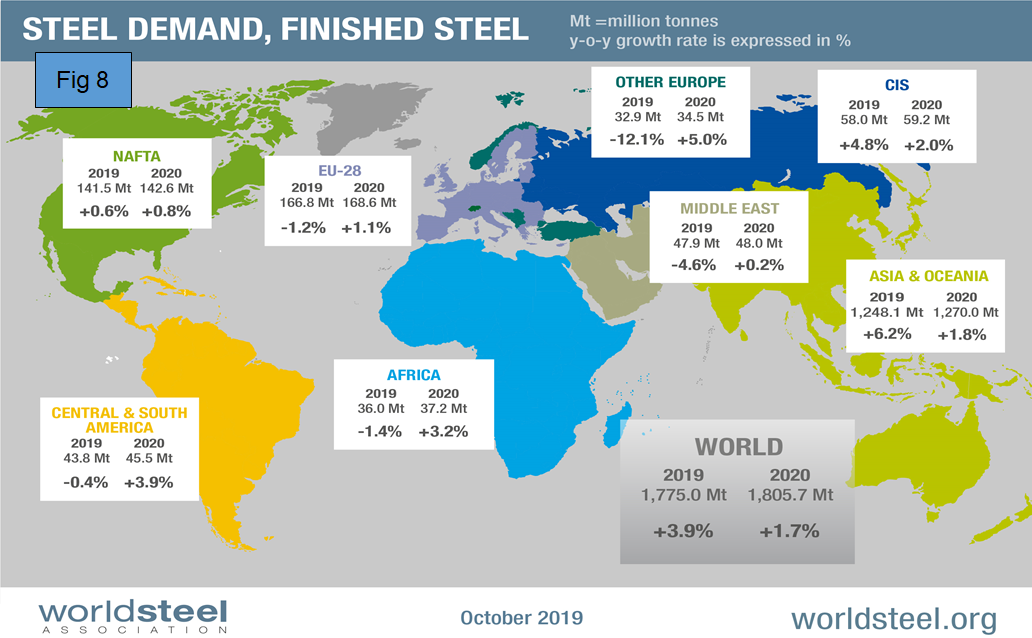
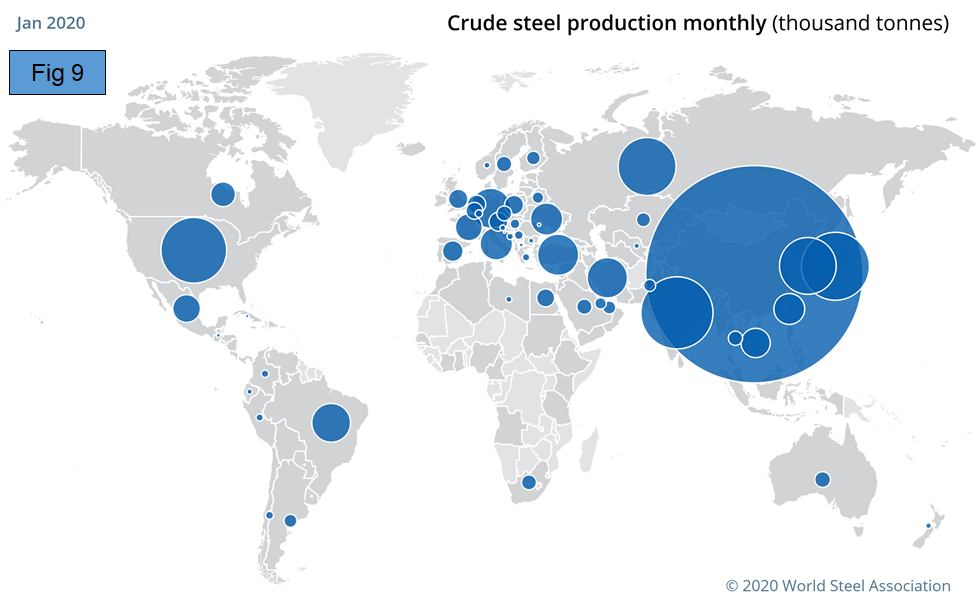
Figure 9 is a schematic from the WSA showing the relative production of the major steel producing nations in January. This doesn’t change on a short-term basis so we haven’t updated it. Its purpose is to show relative magnitude.
SMU Comment: Global steel production through February doesn’t recognize the impending downturn in the global economy caused by COVD-19. In January and February, China’s industrial production declined by 13.5 percent from December and fixed-asset investment was down by 24.5 percent year over year–both shocking numbers which hadn’t affected steel production through February. Presumably we can expect similar numbers in the U.S. as industrial production is curtailed by lockdowns and a collapse in consumer demand.
On March 23, Kristalina Georgieva, managing director of the IMF, published the following statement following a G20 ministerial on the coronavirus emergency: “The outlook for global growth in 2020 is negative—a recession at least as bad as during the global financial crisis or worse. But we expect recovery in 2021. To get there, it is paramount to prioritize containment and strengthen health systems—everywhere. The economic impact is and will be severe, but the faster the virus stops, the quicker and stronger the recovery will be. We strongly support the extraordinary fiscal actions many countries have already taken to boost health systems and protect affected workers and firms. We welcome the moves of major central banks to ease monetary policy. These bold efforts are not only in the interest of each country, but of the global economy as a whole. Even more will be needed, especially on the fiscal front.”
The WSA represents approximately 85 percent of the world’s steel production, including over 160 steel producers, national and regional steel industry associations and steel research institutes. (Note at the bottom of Table 1 WSA says this represents 99 percent of steel production, so presumably there are reports of production by countries that include nonmembers.) The OECD has taken over responsibility for tracking global steel capacity. Their data shows that global capacity declined each year 2016 through 2018. Capacity in 2018 was 2.234 billion metric tons, down from 2.322 billion tons in 2015.


