

Market Data

May 14, 2020
Steel Mill Lead Times: Extend Slightly
Written by Tim Triplett
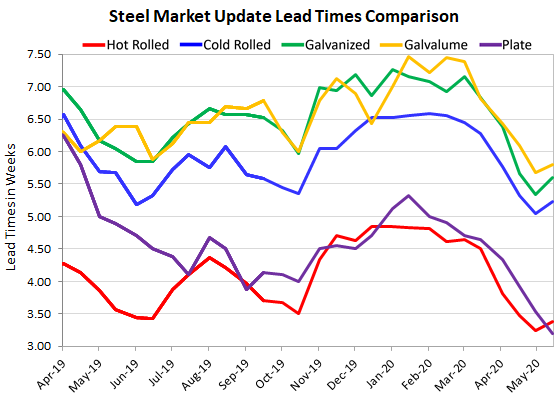
Lead times for spot orders of flat rolled steel extended slightly this week after declining since mid-March when the government ordered the closing of nonessential businesses to stop the spread of the coronavirus. Lead times for steel delivery are a measure of demand at the mill level—the longer the lead time, the busier the mill. Lead times are also a measure of the strength of the recent price increase announcements. Note, the lead times shown come from the SMU flat rolled and plate steel market trends survey just concluded earlier today. The lead times referenced are not from any one specific mill, and domestic mill lead times can vary from producer to producer and for each production facility.
Hot rolled lead times now average 3.38 weeks, up from 3.25 at the end of April. Cold rolled orders currently have a lead time of 5.23 weeks, up from 5.04 two weeks ago. The current lead time for galvanized steel is 5.60 weeks, up from 5.34, while Galvalume is at 5.80 weeks, up from 5.67 in SMU’s late April check of the market.
Plate is the exception with plate lead times shortening to 3.20 weeks from 3.53 weeks over the same period.
Steel producers have idled furnaces and curtailed production in a massive effort to sync supply with the reduced demand from the coronavirus shutdowns. Lead times for steel delivery could be expected to extend further as businesses reopen in the coming weeks and months and steel demand improves.
Note: These lead times are based on the average from manufacturers and steel service centers who participated in this week’s SMU market trends analysis. Our lead times do not predict what any individual may get from any specific mill supplier. Look to your mill rep for actual lead times. Our lead times are meant only to identify trends and changes in the marketplace. To see an interactive history of our Steel Mill Lead Times data, visit our website here.


