Market Data
May 15, 2020
Service Center Shipments and Inventories Report for April
Written by Estelle Tran
We had to change the way we calculate the adjusted data, which will also change how we derive our analysis. Previously, we adjusted the data to mirror the exact mix of service centers that responded to the previous month’s survey. We saw a decrease in participation in the March survey, which we can understand given the business uncertainty created by Covid-19. In March, we started normalizing the data for 100 percent participation in the survey. We rely on the consistent participation of our survey partners to help us create robust data to track industry trends. Going forward, we will compare adjusted figures to the previous month’s adjusted figures, and we encourage readers to pay more attention to the calculations, such as shipping days of supply. More consistency in our data collection and this calculation change also will allow us to begin tracking a new indicator – intake. Thanks to our data providers for making this possible.
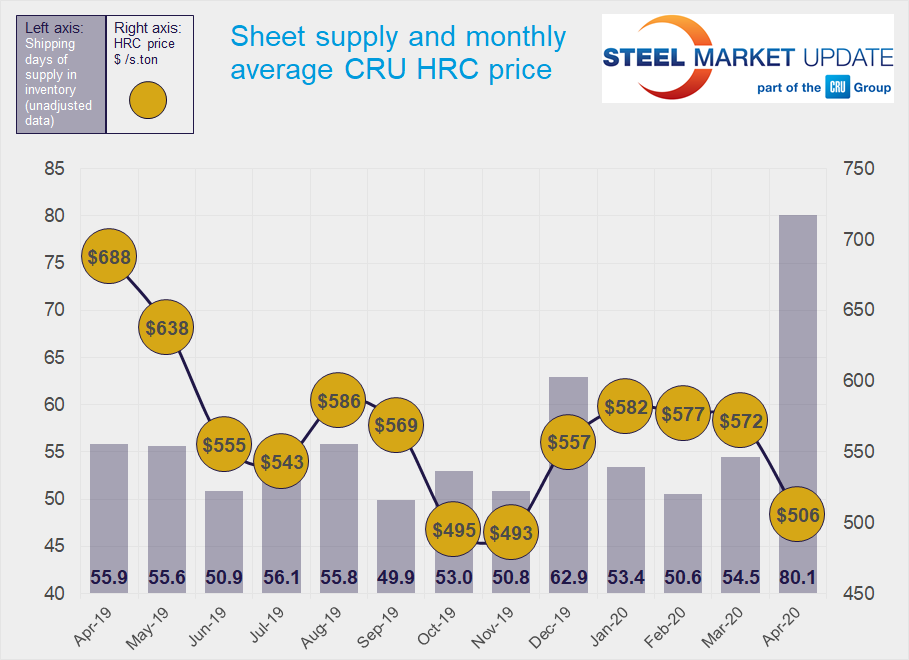
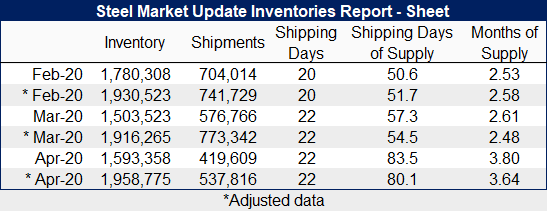
Flat Rolled = 80.1 Shipping Days of Supply
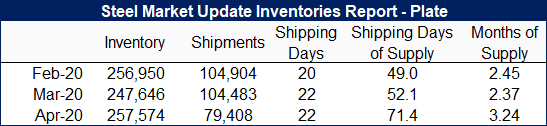
Plate = 71.4 Shipping Days of Supply
Flat Rolled
In April, the first full month with widespread Covid-19-related manufacturing curtailments, shipments fell 30 percent month on month, causing a spike in inventories in terms of shipment days of supply as well as in total volume. At the end of April, service centers carried 80.1 shipping days of flat roll supply, up from 54.3 in March. Flat roll supply at the end of April represented 3.64 months of supply, up from 2.47 in March. April had 22 shipping days, the same as March.
Flat roll volumes on order slid 6 percent month on month in April. While many service centers have been buying sporadically and struggling to meet contract minimums as they worked to align their supply with demand, some service centers gained confidence in placing orders toward the end of April, right before mills announced $50-60/st price increases.
Service center inventories are expected to remain elevated because of reduced shipment activity. Some buyers have taken advantage of low-priced deals at the bottom of this pricing cycle, but others have said they are still uncomfortable with placing sizeable orders until they see clearer signs of strengthening steel demand.
Lead times have been shortening in recent weeks. On April 30th, SMU reported that mill HRC lead times moved in to 3.25 weeks from 3.48 weeks in the April 16th survey.
The percentage of sheet inventory committed to contracts was nearly flat at 54.5 percent in April, down from 54.7 In March.
Plate
Covid-19 caused a similar distortion in service centers’ plate supply as it did with sheet. Plate inventories increased 4 percent month on month with shipment levels falling 24 percent. At the end of April, service centers carried 71.4 shipping days of supply, representing 3.24 months of supply. This was up from 52.1 days and 2.37 months of supply at the end of March.
Poor oil- and gas-related demand and mining disruptions have kept plate buyers on the sidelines. With the exceptions of military and construction, end markets for plate have been weak. Plate stocks committed to contracts edged up slightly to 35.8 percent in April from 35.3 percent in March.
Plate mill lead times dropped to 3.53 weeks in the April 30th survey from 3.92 weeks in the April 16th survey. The lack of demand prospects, softening plate prices and short mill lead times set up the drop in on-order volumes in April.
With no demand catalyst in sight and prices rangebound at low levels, we expect service centers to continue to avoid placing significant orders, aside from regular, fast-selling items.