Market Data

May 26, 2020
Global Steel Production Through April
Written by Peter Wright
Steel Market Update is pleased to share this Premium content with Executive members. For information on how to upgrade to a Premium-level subscription, email Info@SteelMarketUpdate.com.
Global steel production in April, excluding China, was hit hard by the coronavirus pandemic. But by April, China was two months into a recovery. China produced a record 62 percent of total global steel production last month. Chinese steel production relative to the rest of the world is likely to become even stronger in the next few months as other nations struggle to restart their economies.
Figure 1 shows annualized monthly global steel production on a three-month moving average (3MMA) basis and capacity utilization since January 2000. Based on OECD data (see below), capacity utilization in April on a 3MMA basis was 76.8 percent. On a tons-per-day basis, production in April was 4.570 million metric tons, down from last June’s all-time high of 5.316 million metric tons.
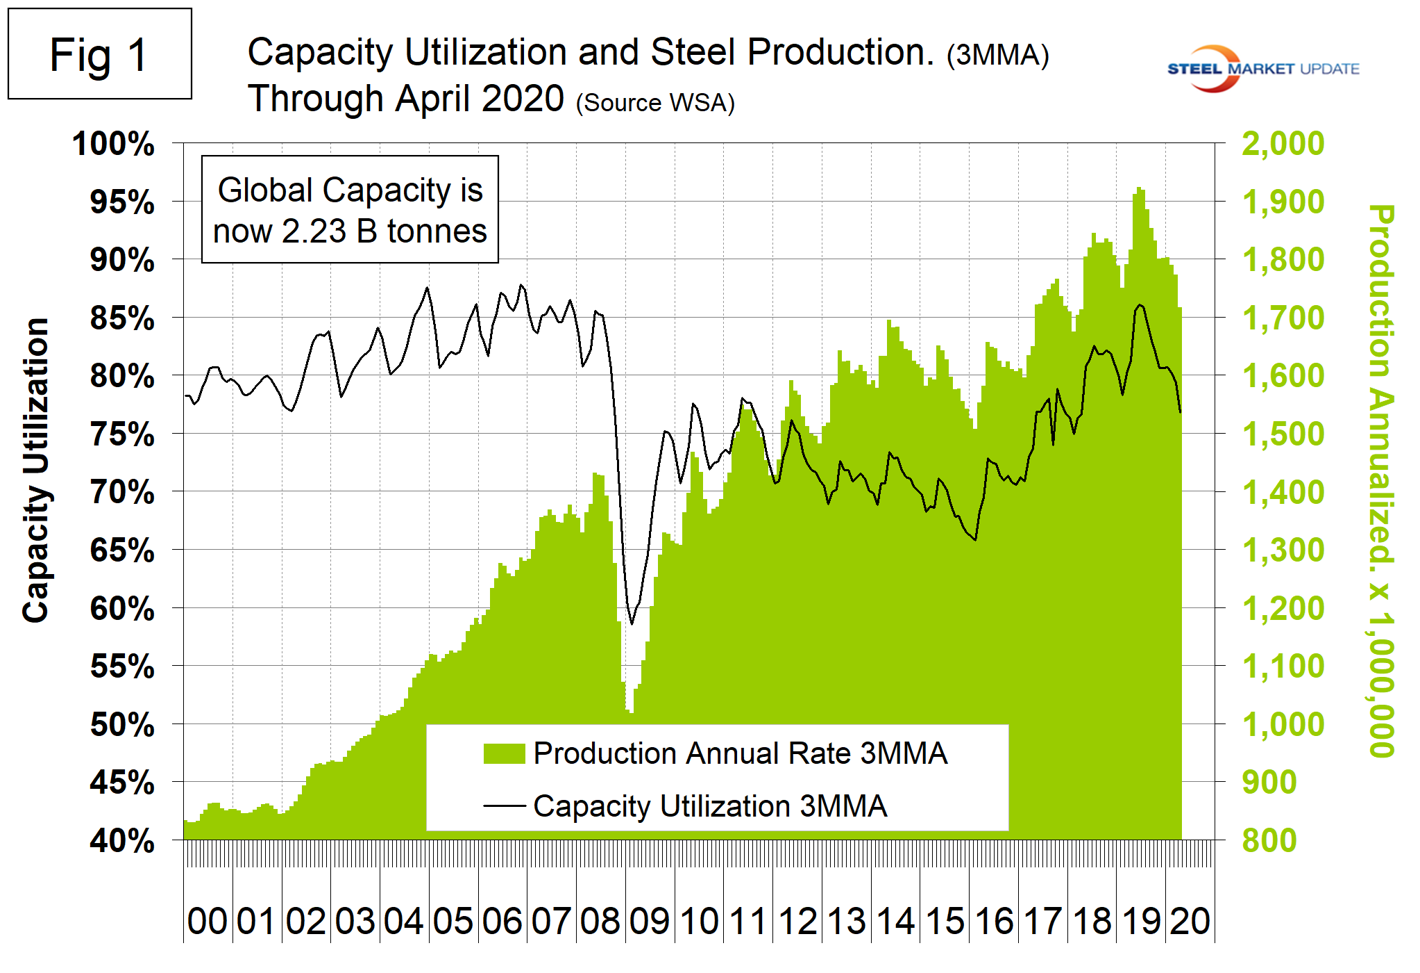
Figure 2 shows the year-over-year growth rate of the 3MMA of global production since January 2013. Growth in three months through April on a year-over-year basis was negative 5.5 percent, down from positive 2.3 percent in February.
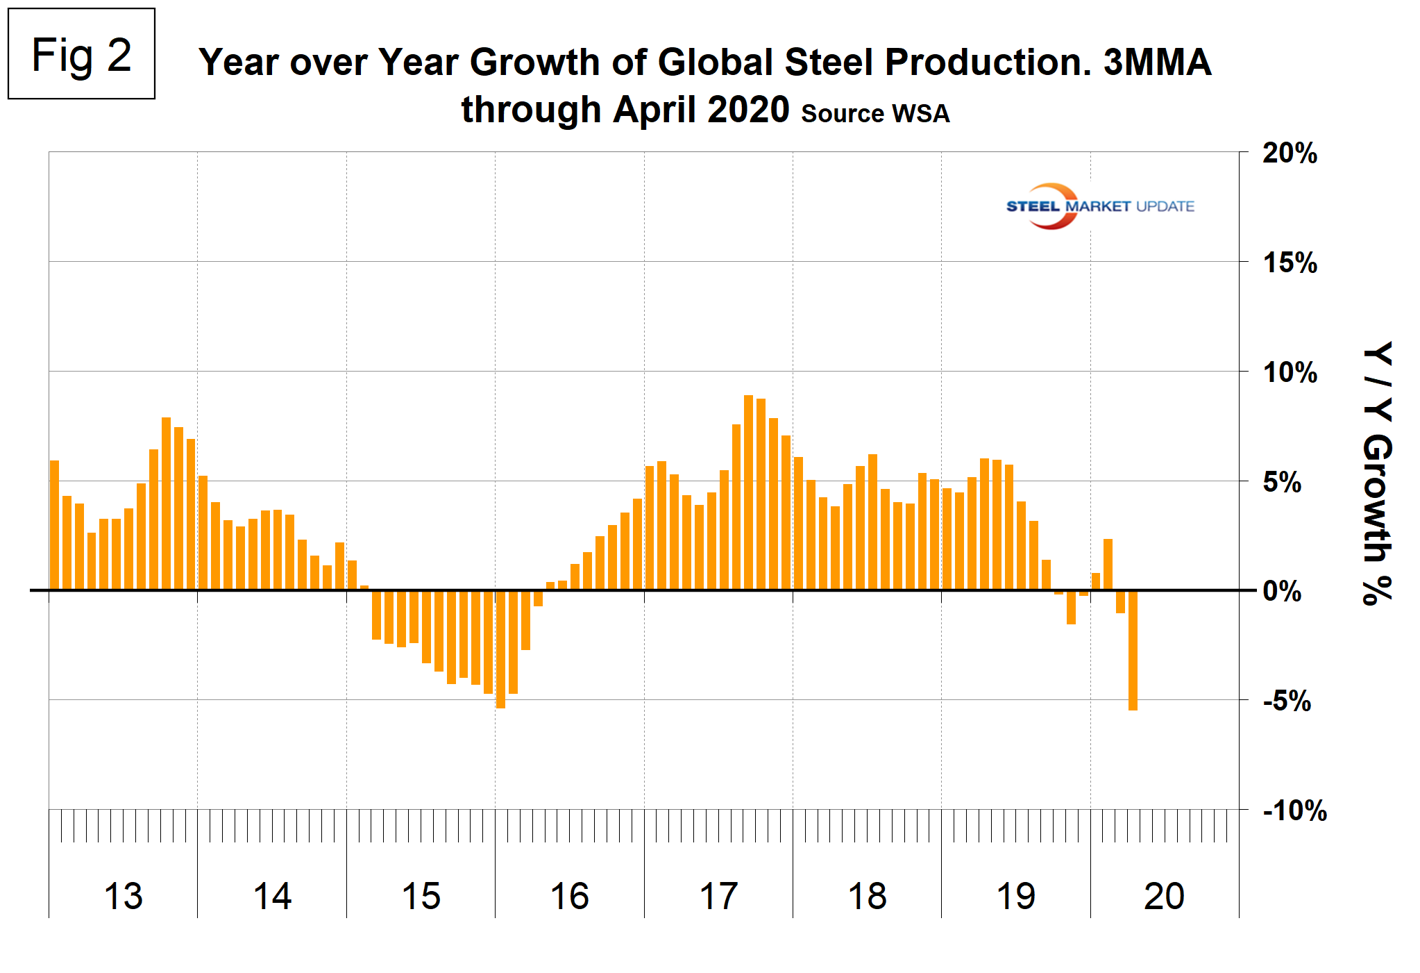
Table 1 shows global production broken down into regions, the production of the top 10 nations in the single month of April, and their share of the global total. It also shows the latest three months and 12 months of production through April with year-over-year growth rates for each period. Regions are shown in white font and individual nations in beige. The world overall had negative growth of 5.5 percent in three months and negative 0.2 percent in 12 months through April. When the three-month growth rate is lower than the 12-month growth rate, as it was each month in July through April, we interpret this as a sign of negative momentum. On the same basis in April, China grew by 1.0 percent and 4.6 percent, and therefore also had negative momentum. China was the only country to have positive growth in three months through April. Table 1 shows that North America was down by 12.9 percent in the three months through April. Within North America, production was down by 13.5 percent in the U.S., down by 11.9 percent in Canada, and down by 10.8 percent in Mexico. (Canada and Mexico are not shown in Table 1 and the North American total includes Cuba, El Salvador and Guatemala.)
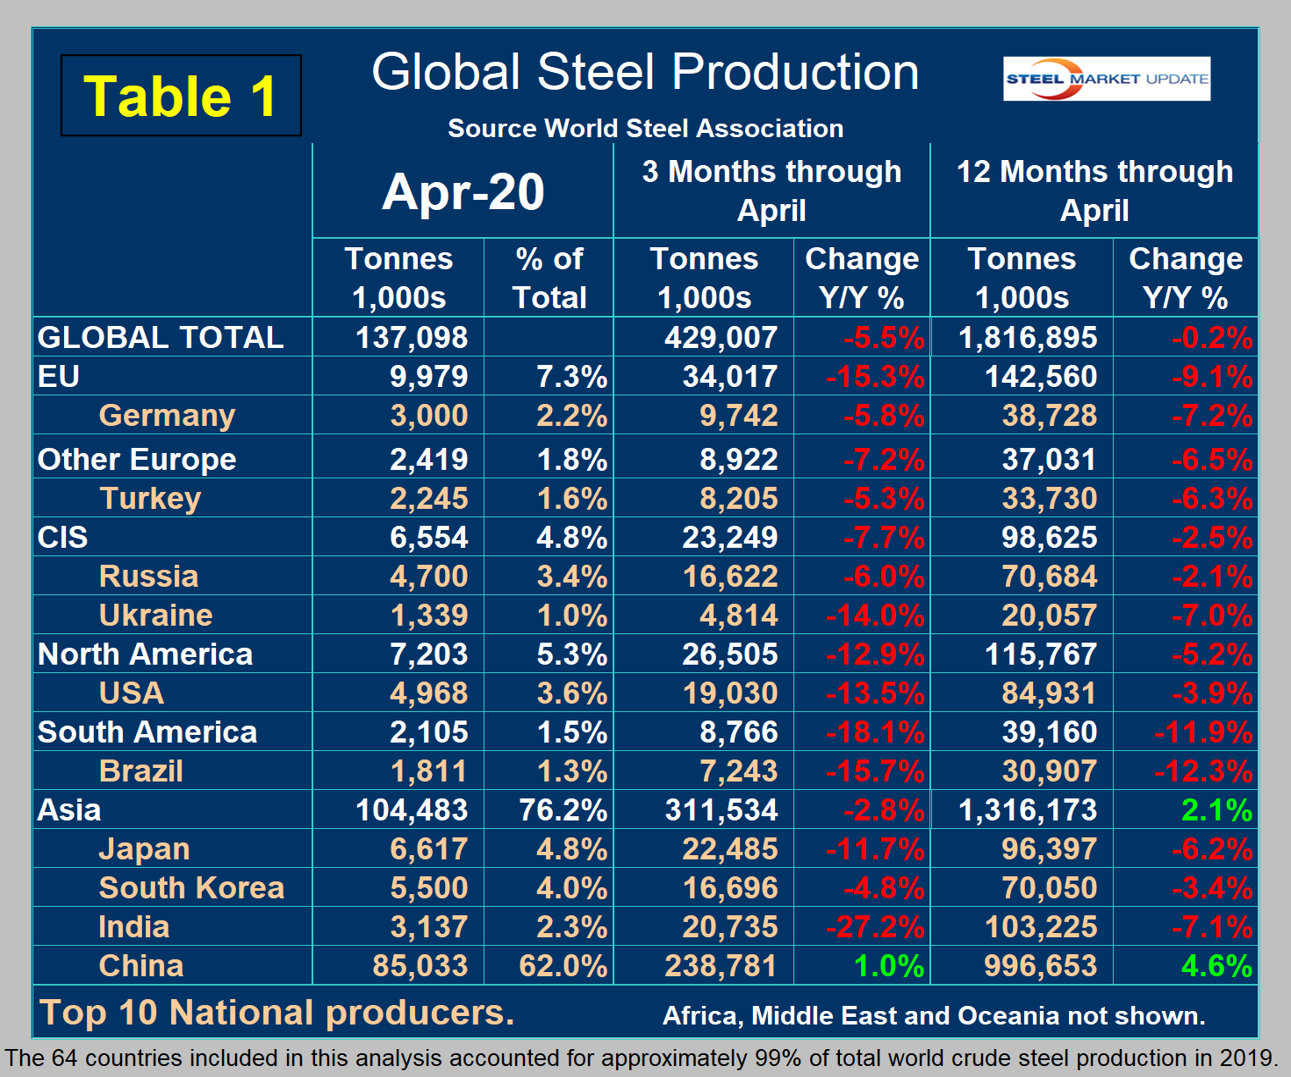
In the 12 months of 2019, 119.965 million metric tons of steel were produced in North America, of which 73 percent was produced in the U.S., 11 percent in Canada and 16 percent in Mexico. Based on the OECD data, U.S. capacity in 2018 was 112.6 million metric tons with a capacity utilization of 76.9 percent. The OECD is expected to release capacity data for 2019 in July.
Figure 3 shows China’s production since 2005 on a 3MMA basis. In the single month of February, China’s steel production declined by 6.5 percent from January, but bounced back by 5.6 percent in March and by 7.7 percent in April. The rest of the world had a delayed reaction to the pandemic situation in China. In April, steel production in the rest of the world declined by 23.8 percent from March.
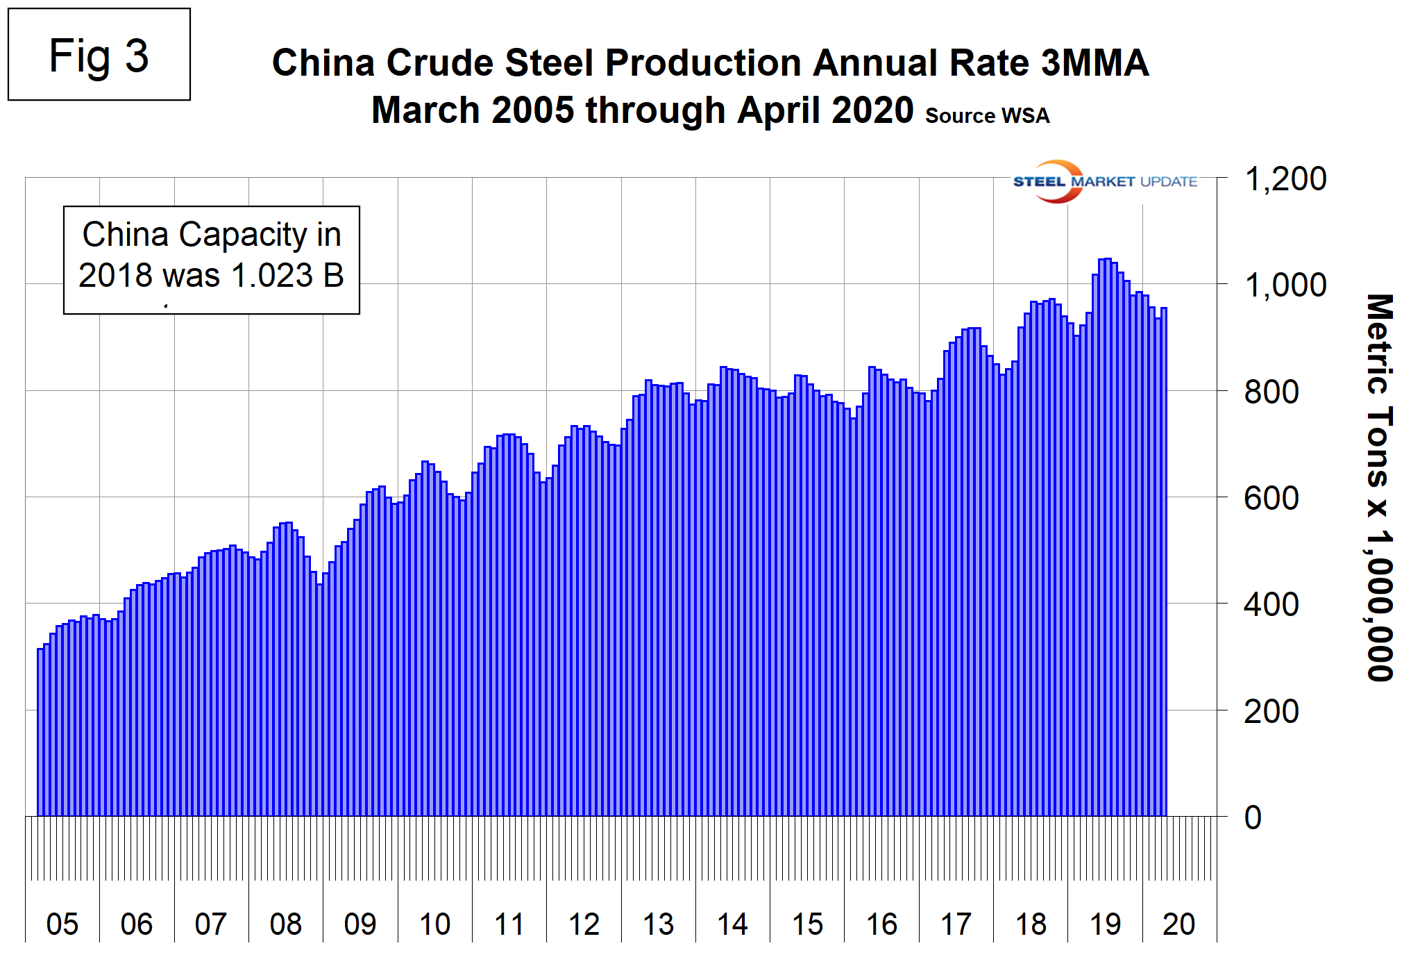
Figure 4 shows the growth of China’s steel production since March 2013 and Figure 5 shows the growth of global steel excluding China on the same scale. China’s domination of the global steel market continues to increase.
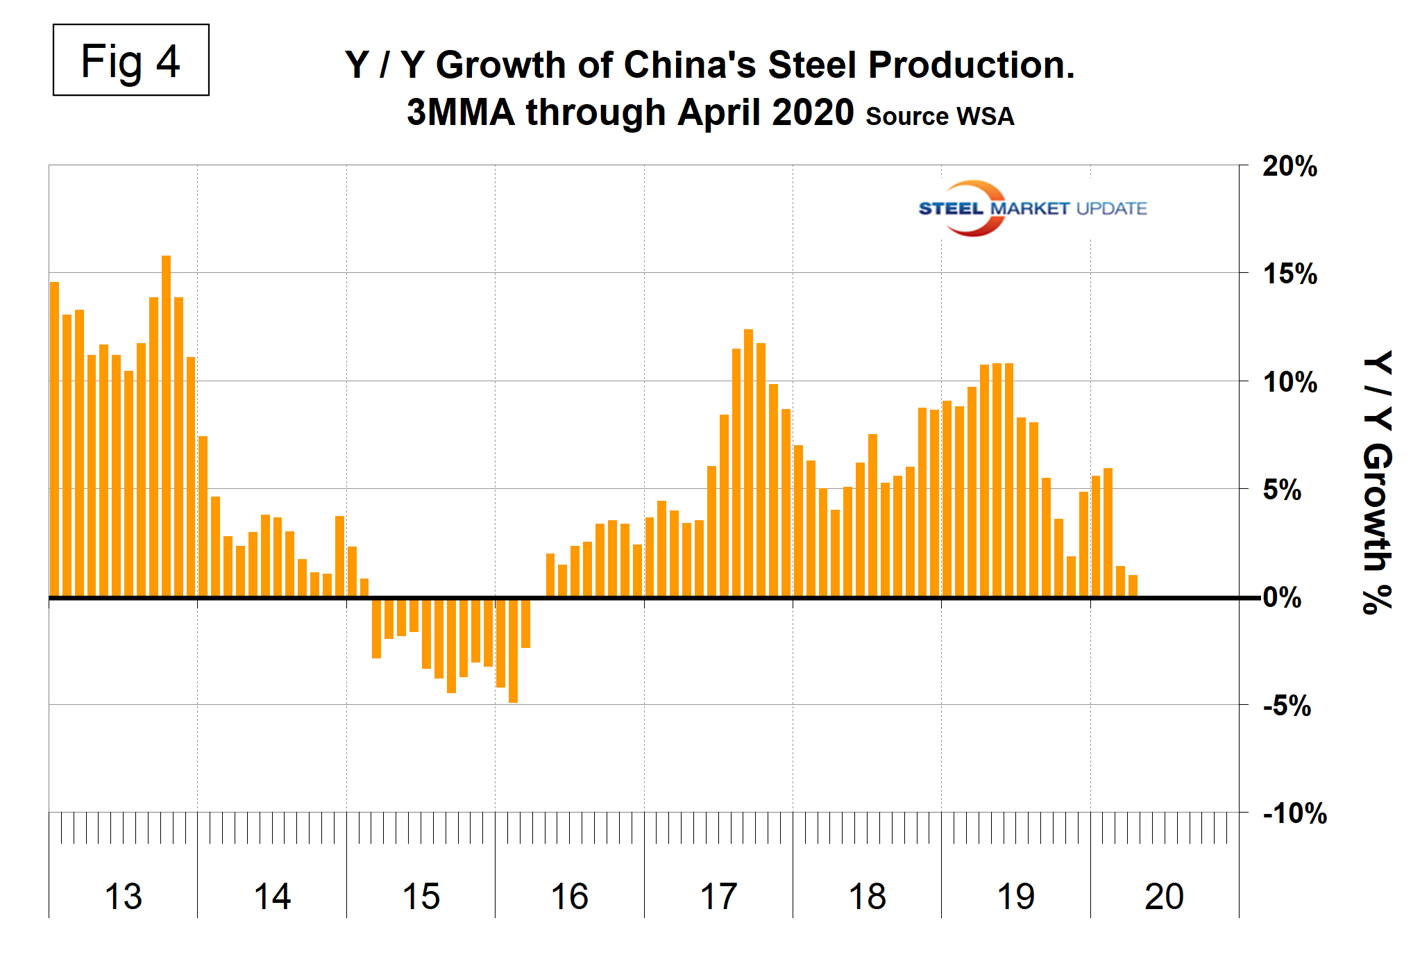
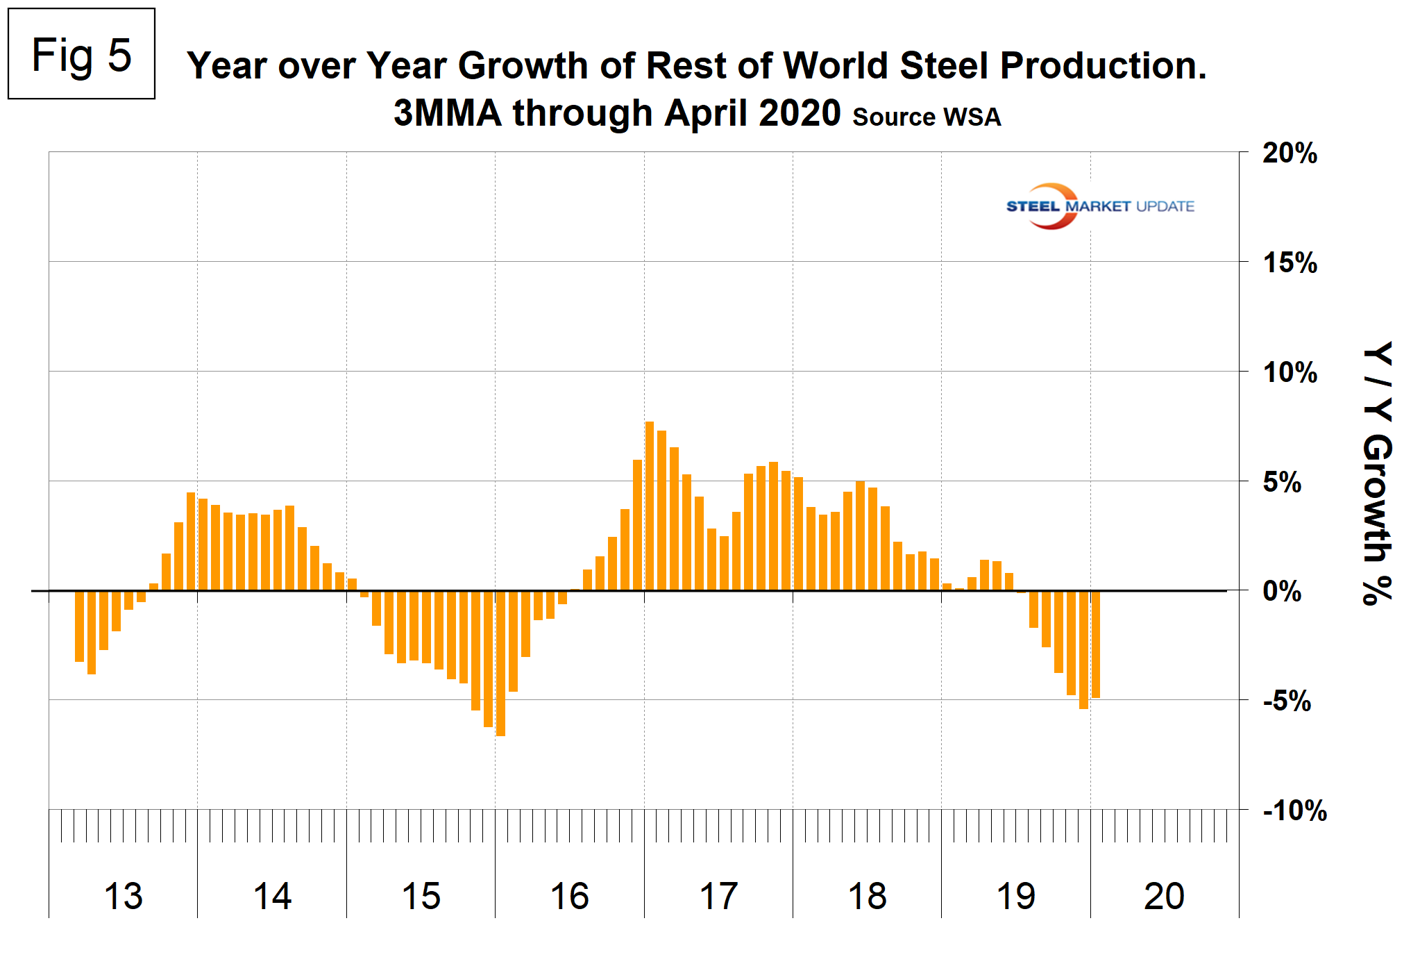
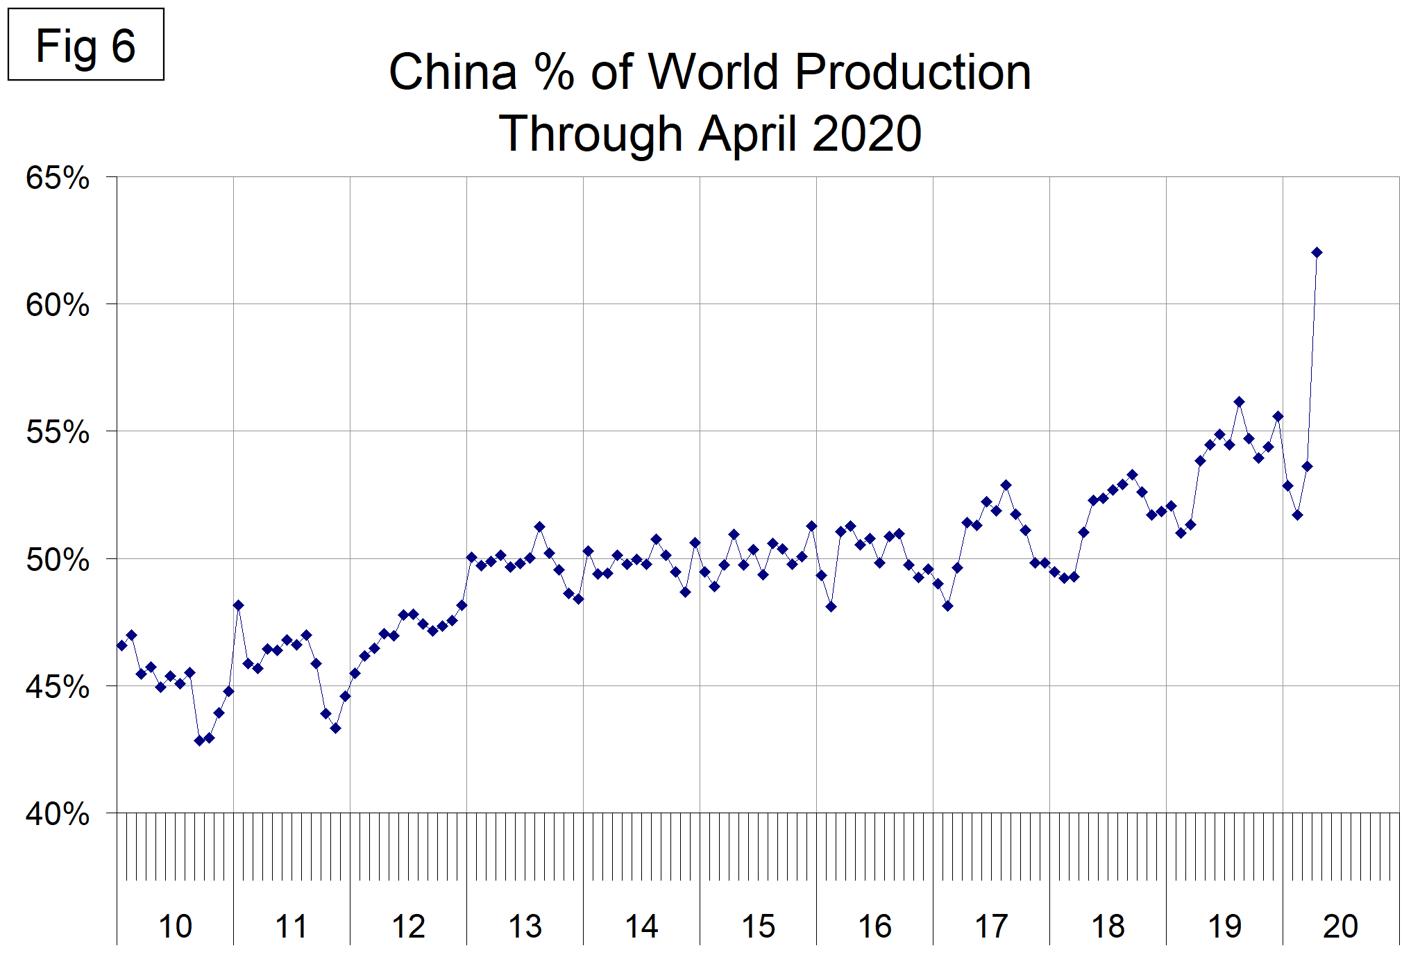
Figure 6 shows the growth of China’s share of global steel production, which was 62 percent in April, surprisingly an all-time high. To confirm, China’s total of 85,033,000 tons was 62 percent of the global total of 137,098,000 tons.
The October 2019 WSA Short Range Outlook (SRO) for apparent steel consumption in 2019 and 2020 is shown by region in Figure 7. This has not been revised to take into account the new reality.
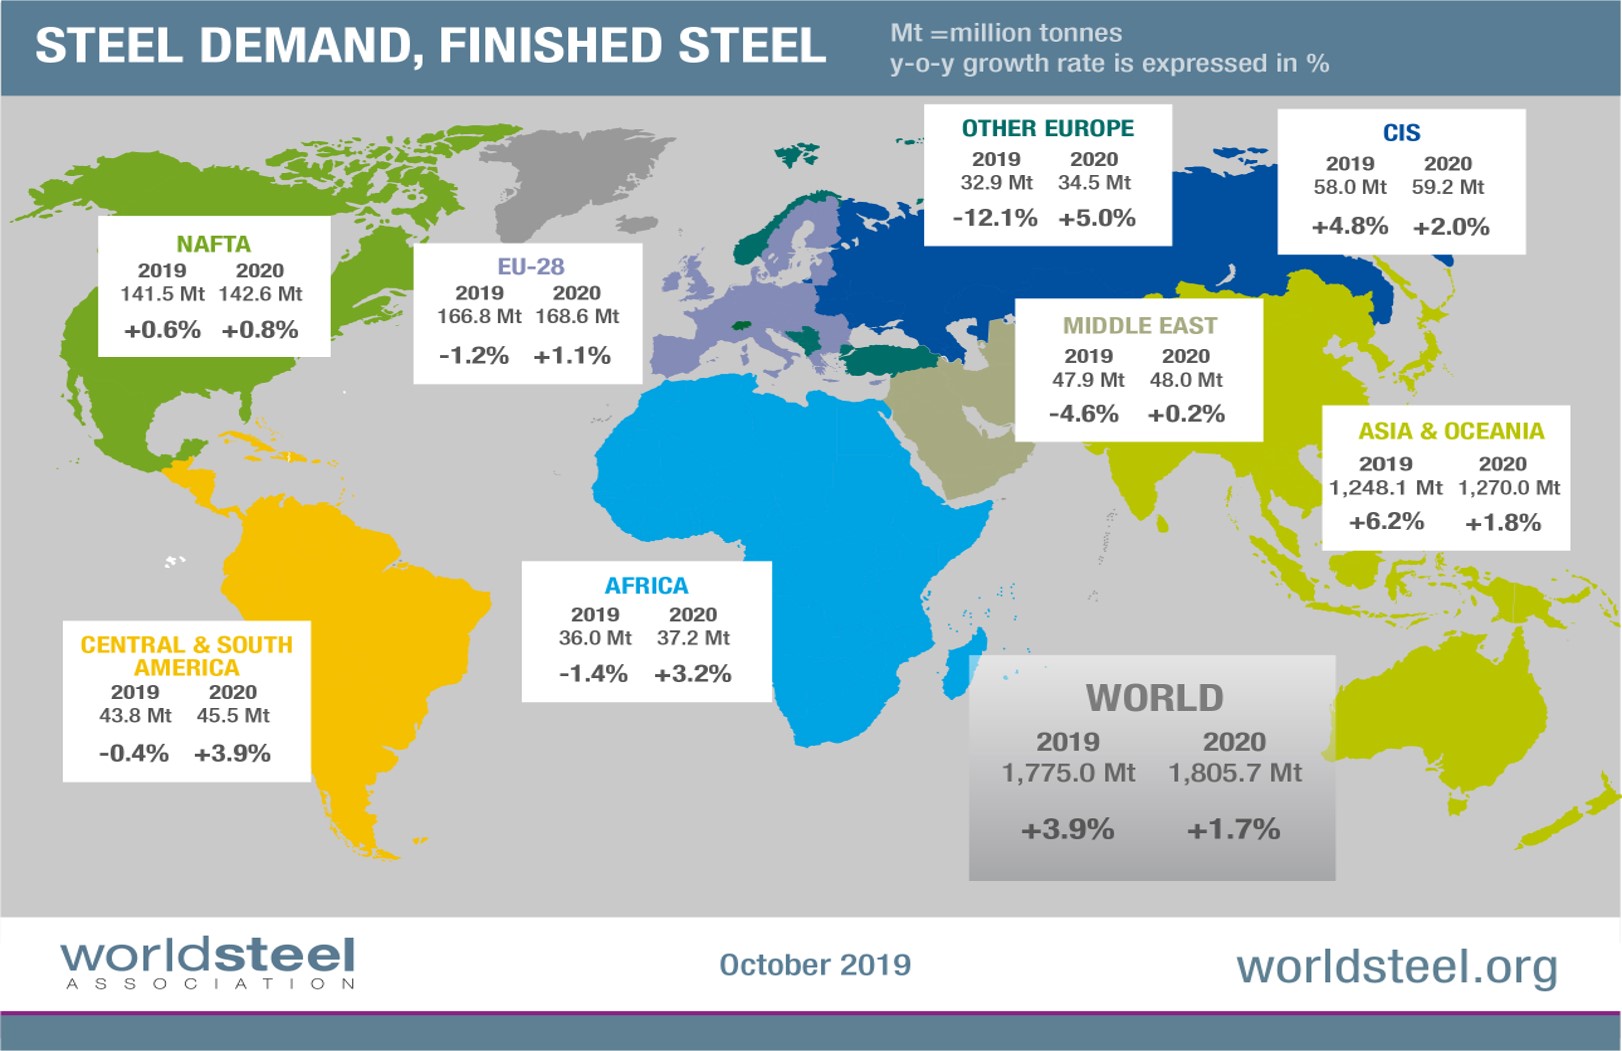
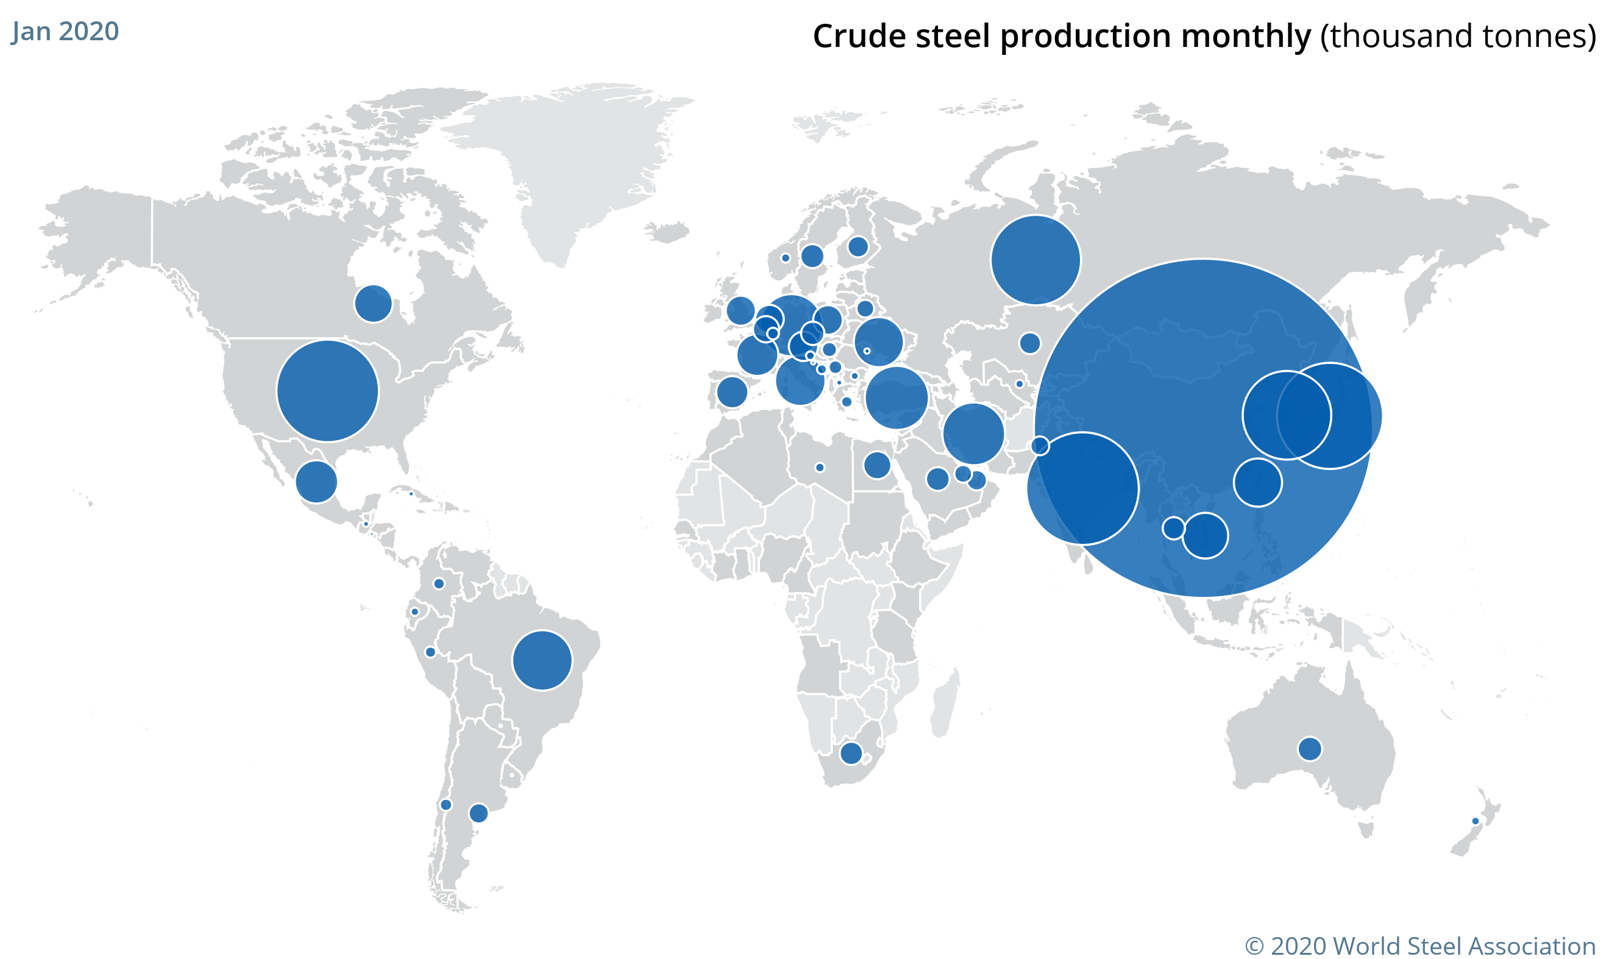
Figure 8 is a schematic from the WSA showing the relative production of the major steel producing nations in January. This doesn’t change on a short-term basis so we haven’t updated it. Its purpose is to show relative magnitude.