Market Data

May 31, 2020
SMU Market Trends: Support for Higher Prices
Written by Tim Triplett
Domestic steelmakers raised prices twice during the month of May, by a total of $90-100 per ton, hoping to establish a floor and set the stage for recovery in anticipation of improving demand as coronavirus restrictions ease in June and July. Service center and manufacturing executives responding to Steel Market Update’s market trends questionnaire this past week expect the mills to be at least partially successful in collecting higher prices.
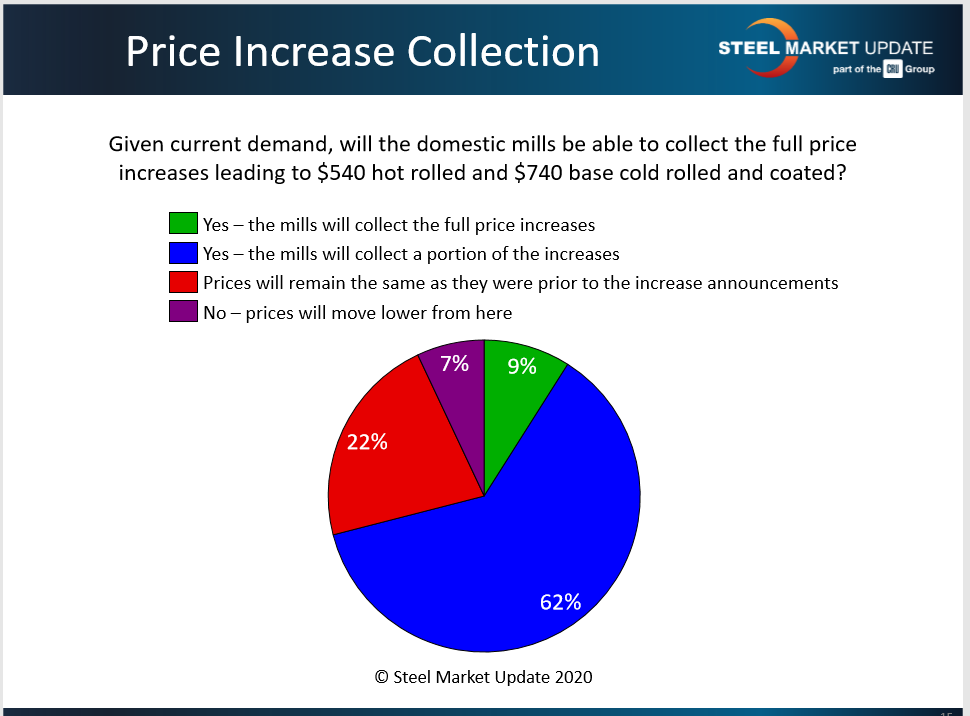
SMU asked: Given current demand, will the domestic mills be able to collect the full price increases leading to $540 hot rolled and $740 cold rolled and coated? The majority (62 percent) expect the mills to collect at least a portion of the increase, while another 9 percent expect them to collect it all. About 22 percent expect prices to remain flat despite the announced increases, while 7 percent expect prices to move lower.
Following are some respondents’ comments:
“It depends on demand.”
“It may stop the slide for a while until automotive picks up.”
“It’s a supply game. If a lot of idled capacity is kept off, prices will stick.”
“Mills may secure a portion of the increase, but one way or another the party will be over before long as improving prices could result in furnace restarts and increased imports. Furthermore, at some point we believe scrap prices will moderate, so the minis will become more aggressive.”
“The typical cynical comments that follow most price increases show that most people just respond emotionally without a true understanding of the numbers. We have a ‘feeling of the current demand based upon forecasts, decreased shipments and the volume of new inquiries. But it is still difficult to compare to the reduced supply with limited imports and quick capacity reductions at most of the mills. Add to the fact that everyone in the supply chain is suffering with reduced volumes and revenues, and producers can’t survive long at these low prices when running at full capacity, let alone at near 50 percent. No one wants to pay higher prices than the next guy, yet we all need to support some sort of reasonable price to climb out of the current hole (if not for ‘national security’). So, I think there is data and principal, as well as emotion, that could lead to supporting or undermining the latest price announcements. Or we could just accept the typicality of mill strategy to announce a second or third price increase with the prospect of rising scrap prices in order to spur orders, extend lead times, and at the very least firm a price floor at or just above $500.”
“Demand will dictate prices, and mills just need to hold the line at $500 plus per ton for HRS. One caves they all cave.”
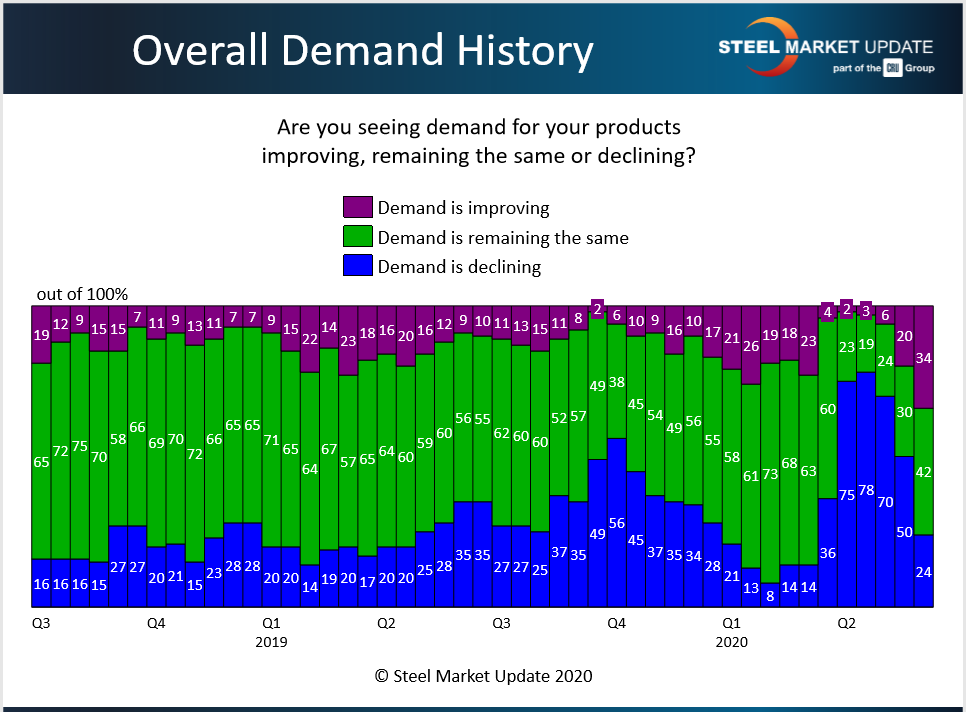
Demand Improving Yet?
SMU asked: At this time are you seeing demand for your products improving, remaining the same or declining? The responses were split but more positive than negative, with 34 percent reporting improving demand, 42 percent flat/stable demand and just 24 percent declining demand.
Following are some respondents’ comments:
“Demand is all over the place; some down, some up.”
“Hopefully, we are at the bottom and will see small increases week over week.”
“Demand is up slightly, but I’ll take slightly at the moment.”
“We will ship more in May versus April, but remain down when compared to pre-COVID-19 levels.”
“Business is improving from recent record lows.”
“We’re improving in minor percentages, but still nowhere near pre-COVID-19.”
“Our demand is flat, but down about 25 percent in general from the pre-COVID-19 market.”
“Lower level of volume, but concerned about an expected ‘hole’ in our backlog.”
“Demand is good right now for areas of the country that are opening up, but how long will this surge last, 45-60 days?”
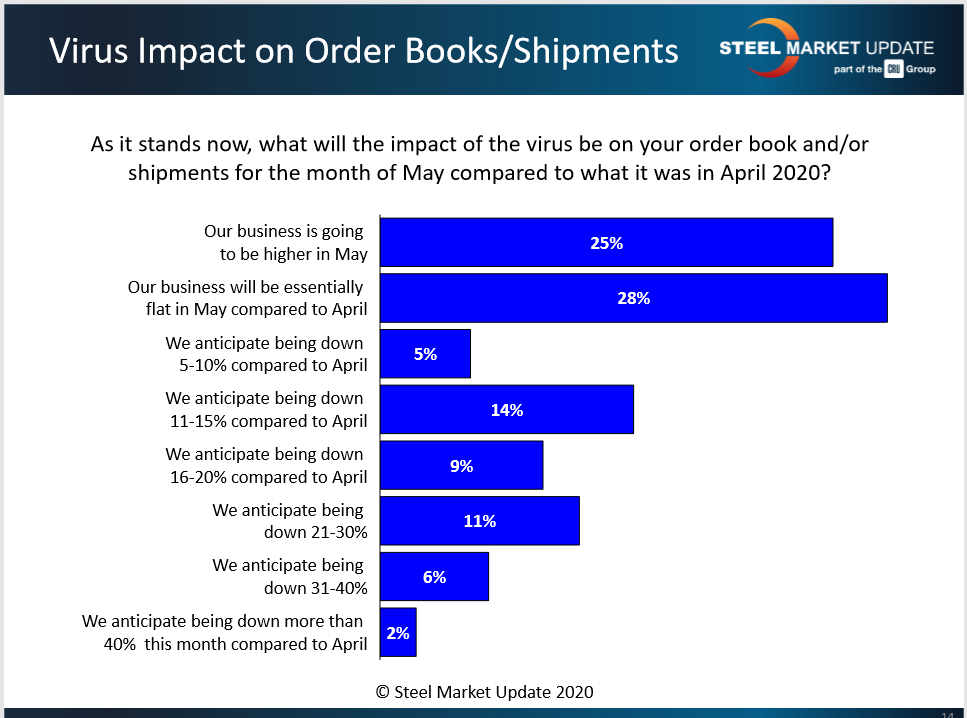
Impact on the May Order Book
SMU asked: What will the impact of the virus be on your order books and shipments for the month of May compared with April? For the majority (53 percent) business was flat or better in May. For the rest, business was down anywhere from 5-40+ percent. SMU calculates a weighted average decline in orders of approximately 24 percent.