

Product
July 23, 2020
HRC Futures: Selling Rallies Has Been Working for Months, Will it Continue to Work?
Written by David Feldstein
Editor’s note: SMU Contributor David Feldstein is president of Rock Trading Advisors. David has over 20 years of financial market trading experience and has been active in the ferrous futures space for eight years. David earned an MBA from the University of Chicago Booth School of Business with concentrations in economics, statistics and analytical finance.
On Tuesday, U.S. Steel announced a $40/st price increase, which was followed by a number of other domestic mills. On Wednesday, U.S. Steel announced it is restarting its #8 blast furnace at Gary Works on Aug. 1, expecting higher demand in the weeks and months ahead. Futures have rebounded $15-$20 following the explosion at ArcelorMittal’s Burns Harbor facility last week. The rolling 2nd month CME Midwest HRC future popped above its downtrend that started in early June. Is this technical pattern confirmation that prices will move higher from here?
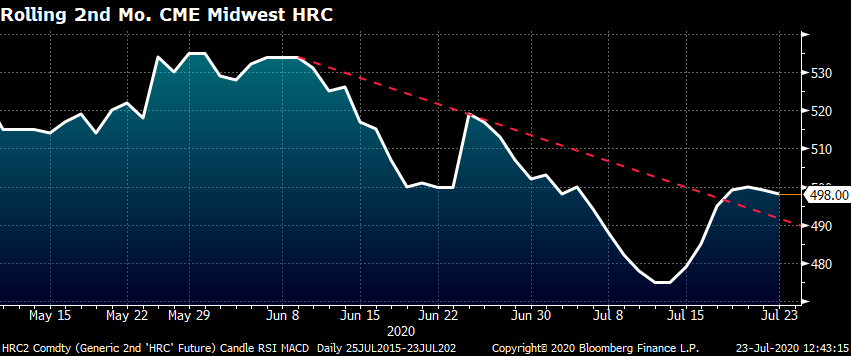
Hard to tell, but as I increased the time period of the chart from 60 days to eight months…
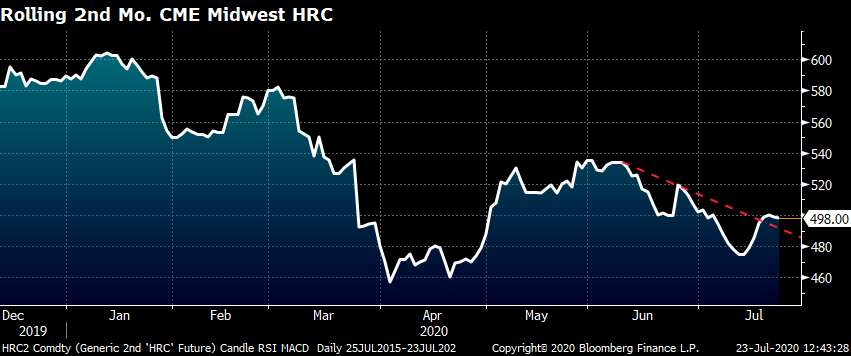
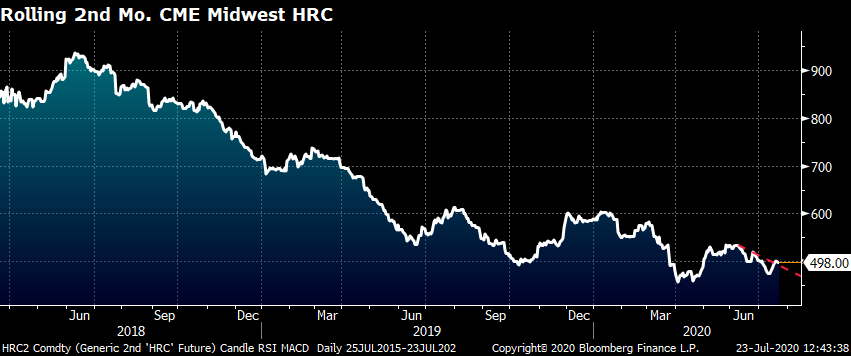
…and then back to 2018, it provides perspective that this recent move higher is relatively miniscule. Moreover, the multi-year slog of falling steel prices is exacting a heavy toll on the industry.
This past few years have been wrought with increased volatility. What is interesting is that the volatility manifests itself not only in pricing, but also in margins, volume/tonnage and significant changes in product demand. For instance, per the AISI Crude Steel Production Index, steel production is down 30 percent YoY. June flat rolled shipments were down 18 percent YoY. The Baker Hughes U.S. Rig Count is down 73 percent YoY. A number of specific manufacturing categories and businesses are seeing their volumes and demand down 20-30 percent YoY. However, some manufacturing businesses are booming, seeing growth of 20-30 percent YoY. The point is the size of these YoY percentage changes, both higher and lower, are at magnitudes above normal.
Just as massive price volatility moved through the industry creating windfall profits for some firms while forcing others into distress, now that extreme volatility is manifesting itself in product categories. Unfortunately, with the Federal Reserve predicting U.S. GDP to contract 6.5 percent in 2020, overall, this volatility has inflicted serious pain for distributors. Not only are volumes down for service centers, but so are margins. This is a difficult combination for those firms already reeling from a rough 2019.
Anyone reading this article is seeking to answer the question: “What will be the right trading strategy for steel prices going forward?” Before I provide some insight, let’s look back and answer the question: “What was the right trading strategy over the past four months?”
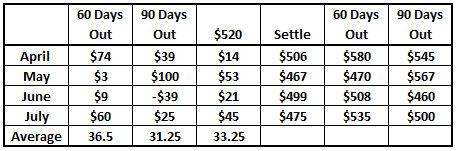
These four charts show the April, May, June and July CME Midwest HRC futures time series back to January.
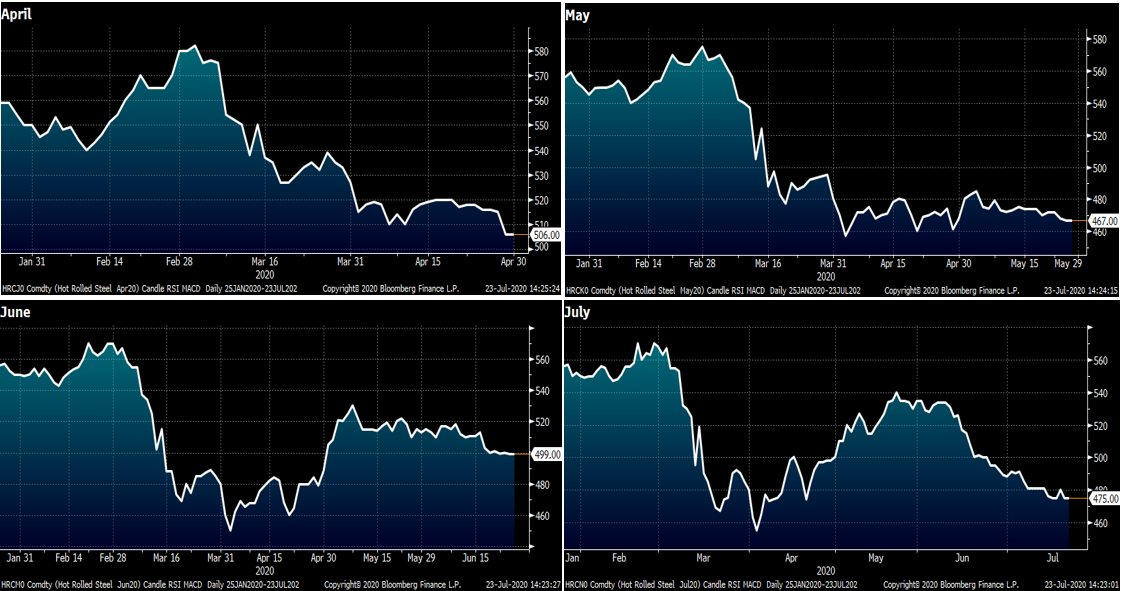
This table shows the P&L per ton for each of those months. I used three random trading strategies. The first was to sell the future 60 days prior to expiration, second was 90 days prior to expiration and third simply selling tons at $520 (which was possible for each month at some point within 90 days to expiration).
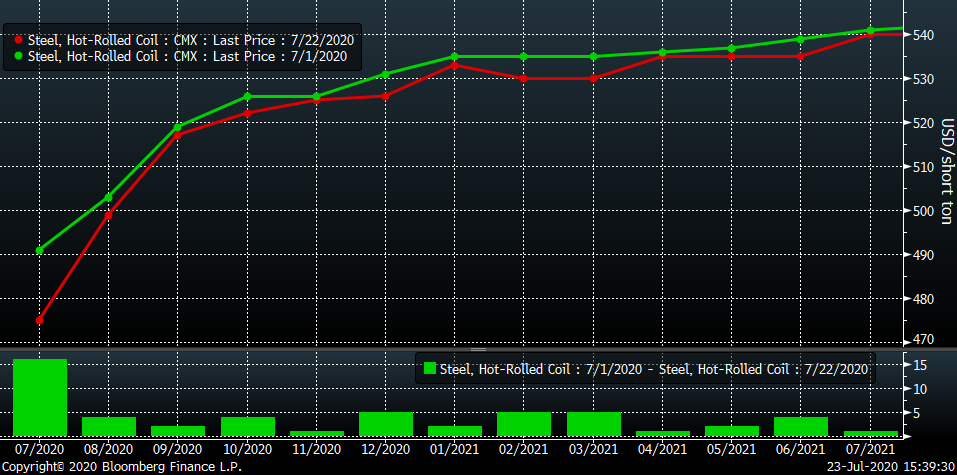
As we head deeper up the river toward the fall and the election, “what will be the best strategy going forward?” Little has changed on the HRC futures curve since the start of the second half on July 1. Will demand significantly rebound as some expect? Or will prices retest the lows once again? Or will we see prices fall to a new low?
Unfortunately, I shook my Magic 8-Ball and it said, “it remains uncertain.” Uncertainty indeed. However, what we do know is for service centers buying tons on index minus deals, they will be buying July tons in the $425-$435 range while the futures curve is trading above $520 in Q4 and $530 in Q1 2020. This provides a fantastic opportunity for a cash and carry trade to lock in abnormally high margins of $85-$105/t by buying physical steel and shorting the respective futures. From the buy-side perspective, locking in $535 for 2021 might end up being a major bargain as the uncertainty of COVID and government policy is removed. If you are thinking along these lines, but perhaps $535 is a bit rich, then what price works? To quote Sun-Tzu, “every battle is won before it is fought.”
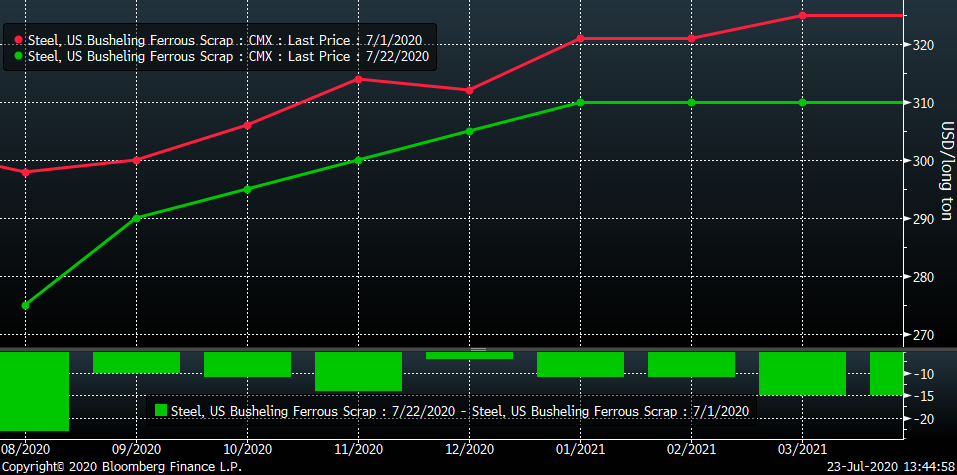
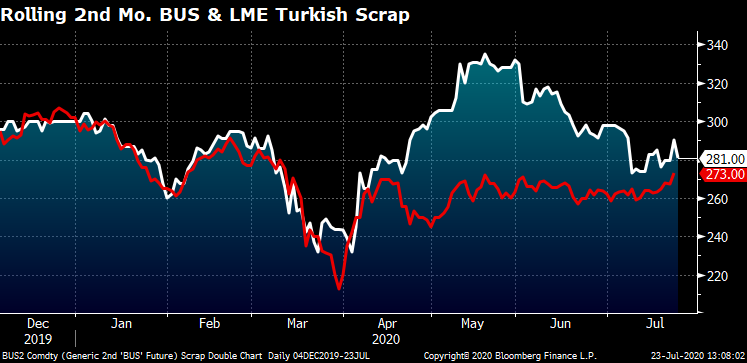
After a shortage of busheling caused primarily by the lockdown-induced automotive shutdowns, busheling has retreated from its $340 highs with August trading thousands of tons in the $270-$280 area this week while September busheling, shown below, has been trading between $280 and $290 this week. In addition to the sharp drop in domestic steel production, the closure of the Illinois River will keep ample supply of busheling captive in the Midwest, likely adding downward pressure as the inventory builds in the coming months.
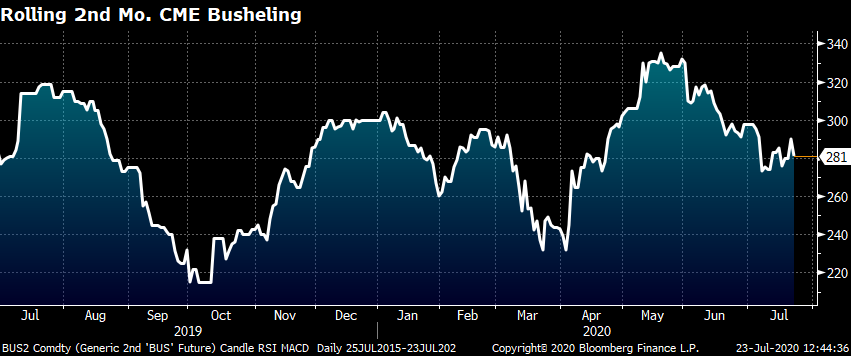
Despite this logistical issue, the busheling curve is in contango or upward sloping. Nevertheless, optimism for busheling remains with October and beyond trading around $300 indicating prices will increase off of July’s $278 settlement.
LME Turkish Scrap has started trading higher in the past few sessions with September settling today at $273. The spread between busheling and Turkish scrap has converged to $8 after expanding to as much as $70 only two months ago.
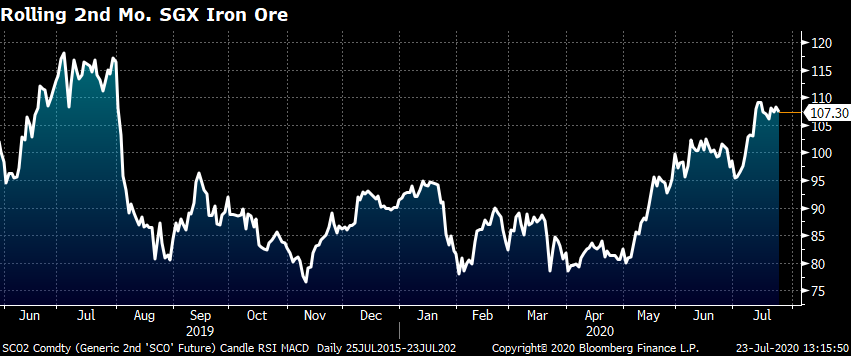
China continues to pump significant stimulus funds into infrastructure projects to boost their economy. Iron ore broke above $100/t trading as high as $110 this week. Chinese spot hot rolled is trading around $500/st, higher than it is trading in the U.S. This is typically a bullish signal for U.S. hot rolled, so pay close attention to China-driven commodity markets including these as well as aluminum, copper, nickel and zinc. Don’t underestimate the power and influence China’s commodity markets can have on global prices.
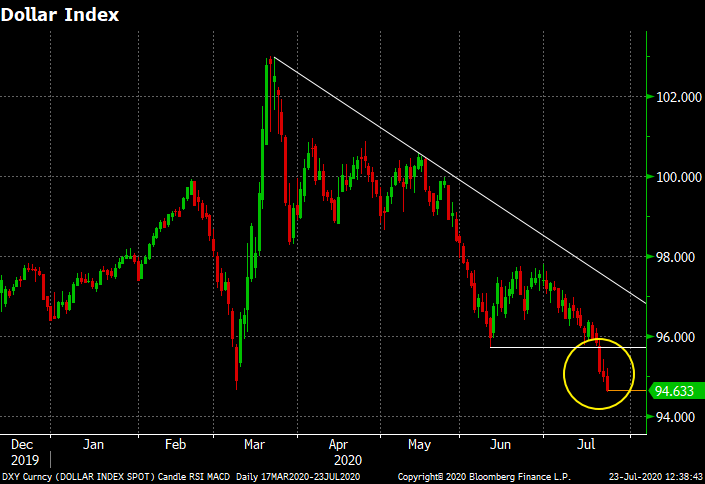
Another commodity price tailwind I am watching closely is the U.S. dollar, which has fallen sharply and broken below a support level. In a discussion I had this week with a steel colleague regarding the price increase, there is no longer only bearish news. Continued price increases in China and a weaker dollar can definitely spark a rally. Also, a domestic mill explosion has historically been a very bullish development, despite the strange world we are living in.
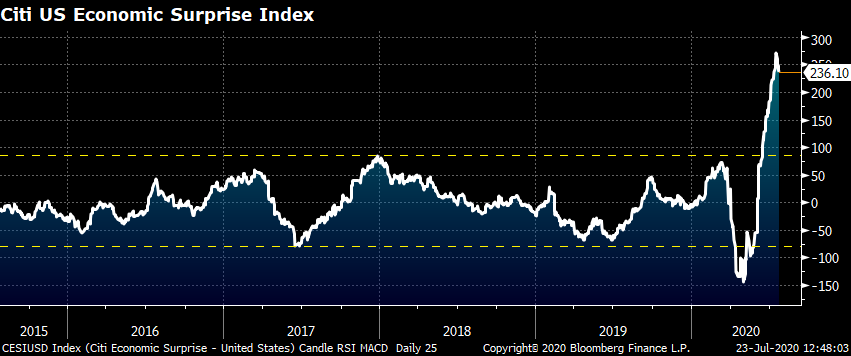
Here are some interesting charts you might not have seen. This first chart is of the Citi U.S. Economic Surprise Index. This measures how economic data performs relative to economists’ expectations. As you can see, it is a mean reverting range bound index. Or it was until March. By the way, notice the increased volatility. Considering its historical mean reverting nature, it has to be a concern that the economic data to come will be significantly disappointing as this index dives back down and likely below the bottom of the range it had since 2015. Taking into consideration the economic difficulties presented by the severe rate of COVID infection across the U.S., especially in California the world’s eighth largest economy, one could see why the data would turn sharply lower in the coming month(s).
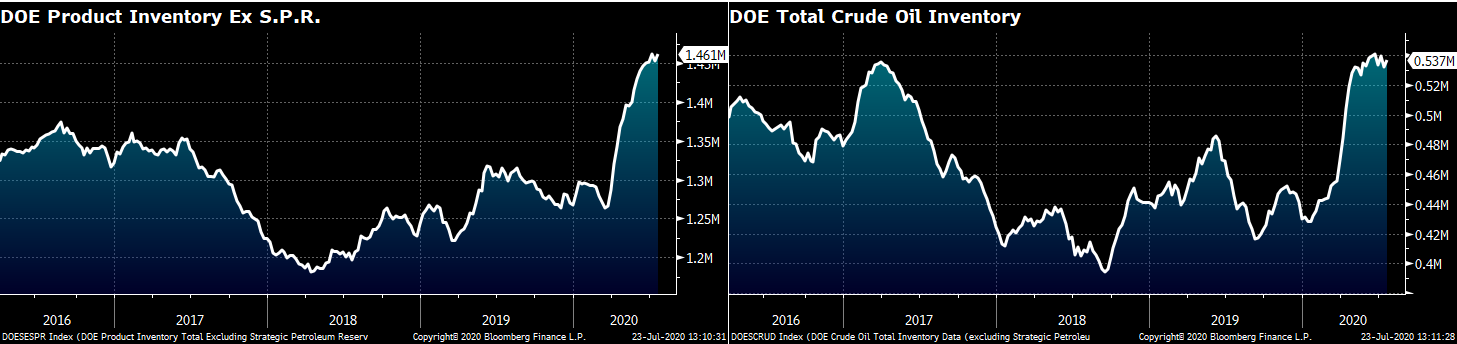
These two charts show the Department of Energy inventory levels for all energy products except the strategic petroleum reserve (left) and crude oil (right) at extremely high levels. The economic slowdown across so much of the U.S. due to COVID could manifest itself in a sharp drop in demand for gasoline and therefore crude oil, perhaps leading to another crash in WTI oil futures.
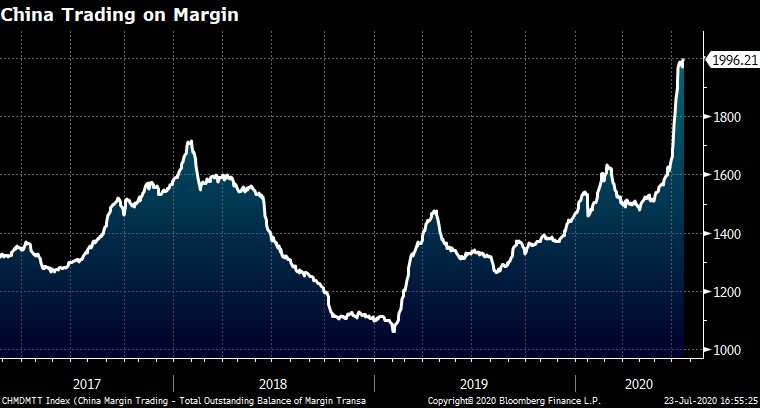
This chart shows the amount investors have on margin for the Chinese stock market (in USD). That spike higher, which has moved in kind with the Chinese stock market, takes it to the dollar equivalent of $200B. It is safe to assume that this heightened level of speculation is also occurring in Chinese commodity markets. This usually ends badly with a sharp crash, but the end of this party might not come for months.
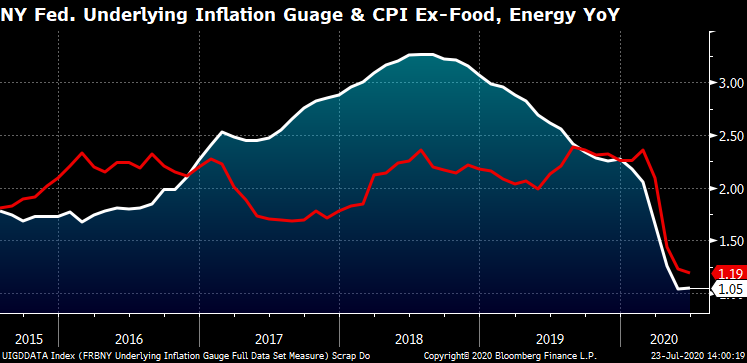
Lastly, inflation remains extremely low indicating deflationary pressure is likely to persist in the months ahead.
Disclaimer: The content of this article is for informational purposes only. The views in this article do not represent financial services or advice. Any opinion expressed by Mr. Feldstein should not be treated as a specific inducement to make a particular investment or follow a particular strategy, but only as an expression of his opinion. Views and forecasts expressed are as of date indicated, are subject to change without notice, may not come to be and do not represent a recommendation or offer of any particular security, strategy or investment. Strategies mentioned may not be suitable for you. You must make an independent decision regarding investments or strategies mentioned in this article. It is recommended you consider your own particular circumstances and seek the advice from a financial professional before taking action in financial markets.


