Market Data

August 4, 2020
Update on Manufacturing Indicators Through June
Written by Tim Triplett
Steps to contain the coronavirus pandemic have taken a serious toll on industrial production, manufacturing and durable goods orders in the U.S., but the data shows signs of improvement in June. The health of the manufacturing economy has a direct bearing on the health of the steel industry.
![]() The Industrial Production Index
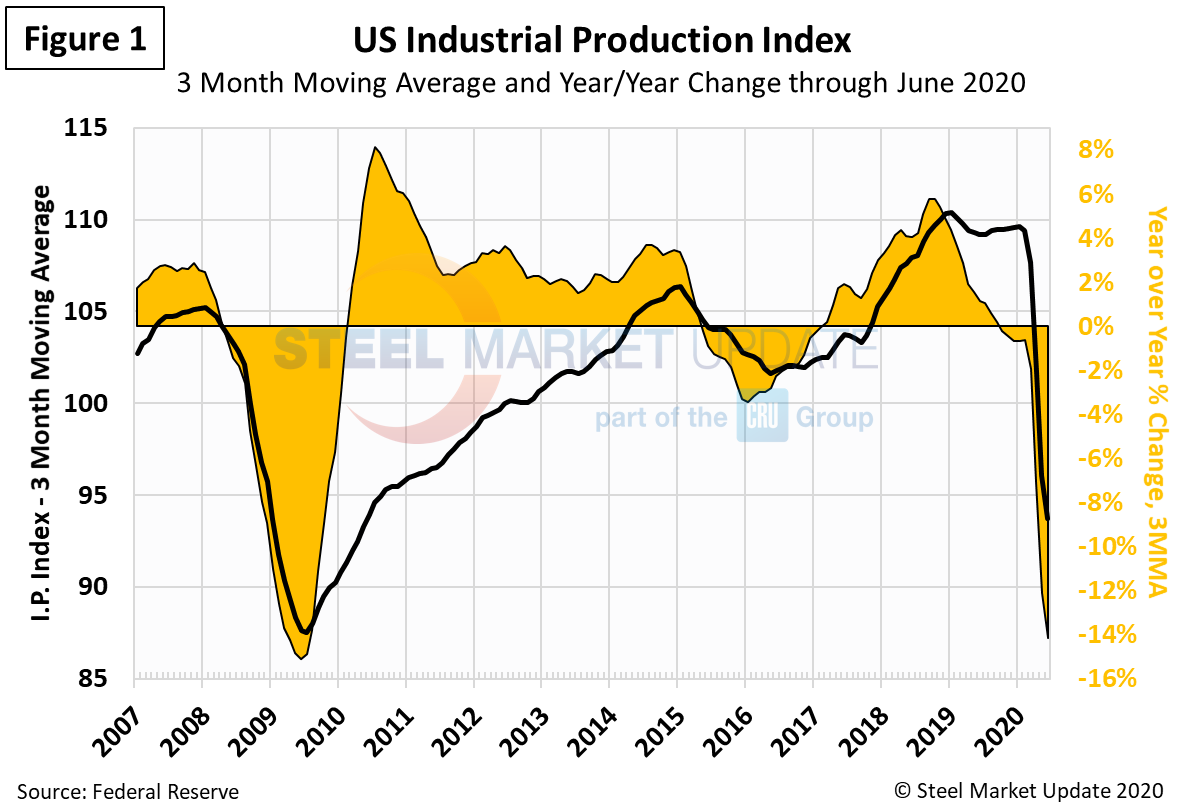
The Industrial Production Index
The IP index is a gauge of output from factories, mines and utilities. Industrial production took a serious hit from the shutdowns of nonessential businesses and other measures mandated by the government in the first and second quarters to stem the spread of the coronavirus. Figure 1 shows the 3MMA of the industrial production (IP) index since January 2007 as the black line and the year-over-year change as the brown shading. From the beginning of March just prior to the pandemic to the beginning of June, the 3MMA of the IP index dropped by 13 percent, from 107.7 down to 93.7.
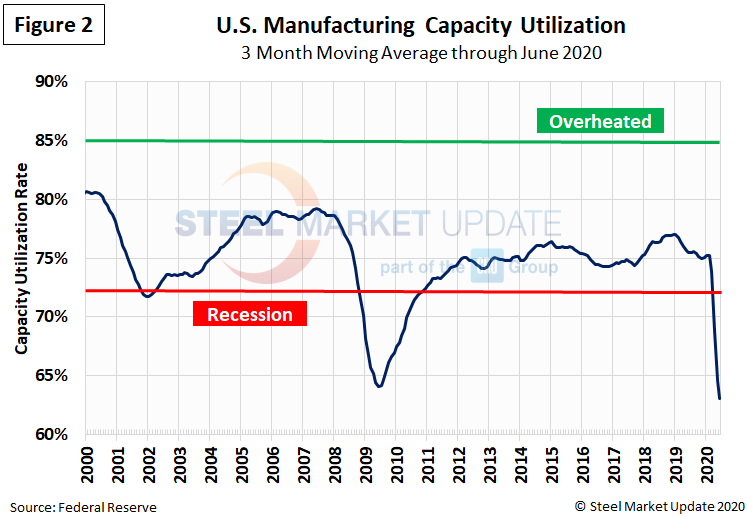
Manufacturing Capacity Utilization
Manufacturing capacity utilization, measured as a 3MMA, dipped into recessionary territory, dropping from about 75 percent in March to 63 percent in June (Figure 2).
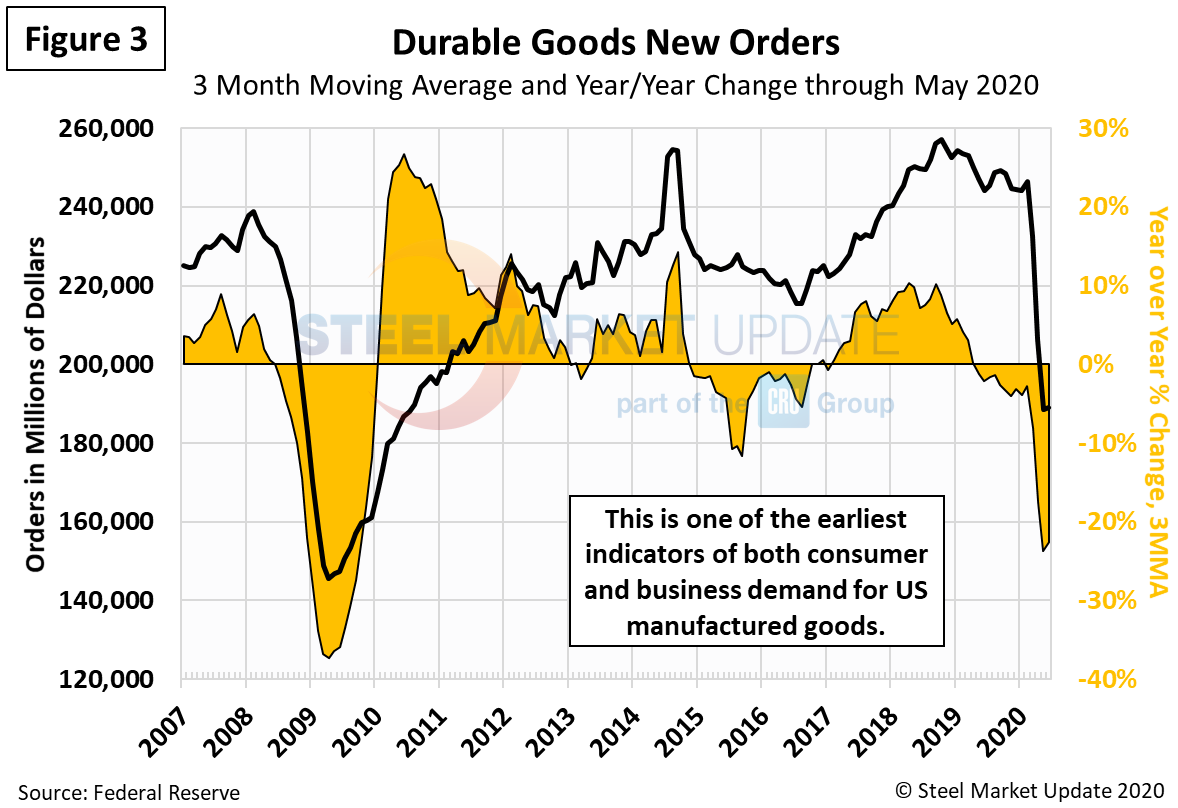
New Orders for Durable Goods
New orders for durable goods, an early indicator of consumer and business demand for U.S. manufactured goods, suffered a similar shock from the virus (Figure 3). The 3MMA dropped by more than 23 percent from February through May, from a peak of $246.4 billion to a low of $188.5 billion. Durable goods orders saw a small uptick in June, which is positive news for the economy.
New Orders for Manufactured Products
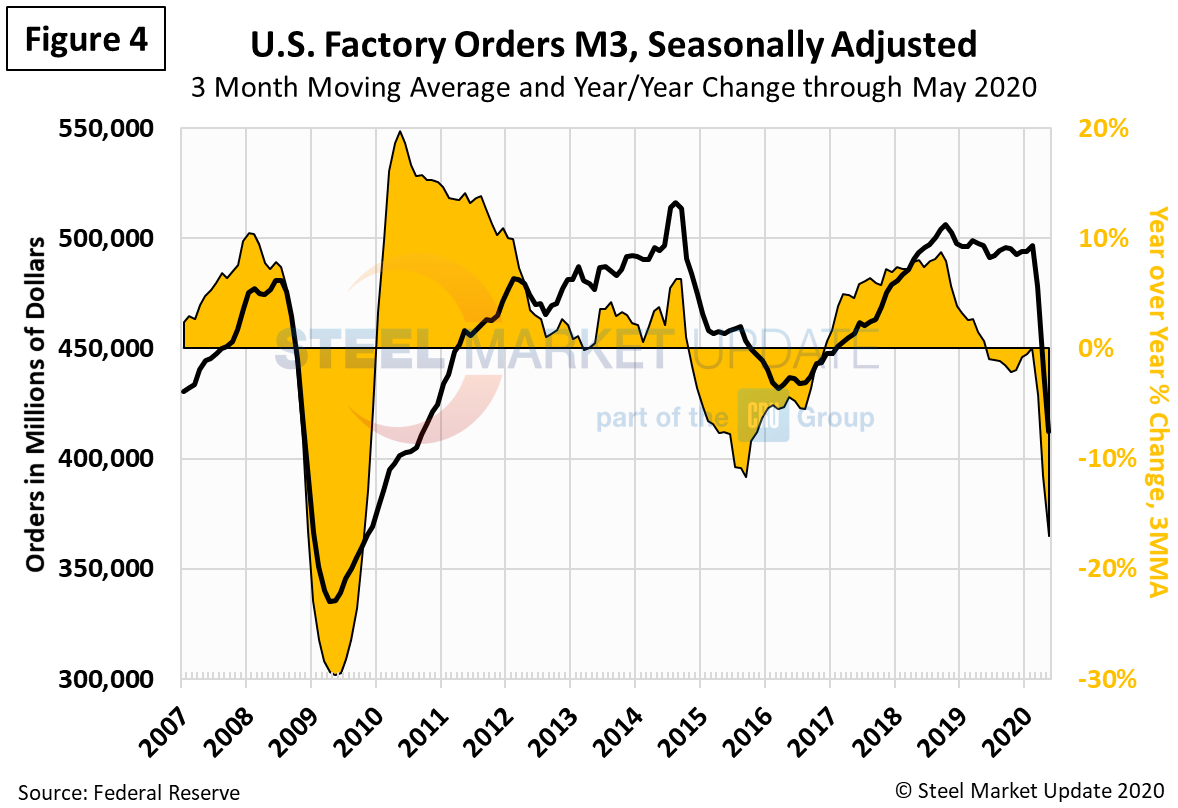
The growth rate of new orders for manufactured products as reported by the Census Bureau was slightly negative for most of 2019, then declined sharply in March 2020 (Figure 4). On a 3MMA basis, factory orders plunged by 17 percent from $496.6 billion in February down to $412.3 billion in May.
New Orders for Products Manufactured from Iron and Steel
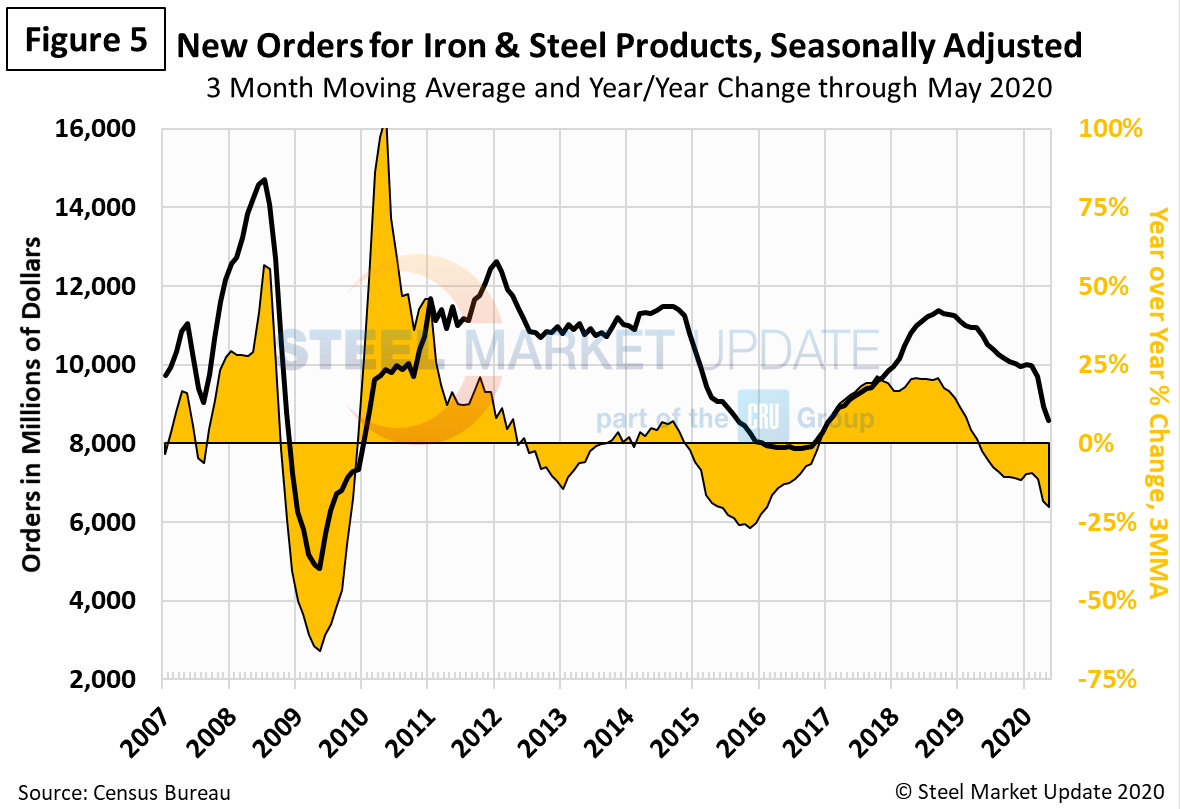
Within the Census Bureau M3 manufacturing survey is a subsection for iron and steel products. Figure 5 shows the history of new orders for iron and steel products since January 2000 as a 3MMA. The year-over-year growth rate saw a similar 20 percent decline in the February through May timeframe.
Inventories of Products Manufactured from Iron and Steel
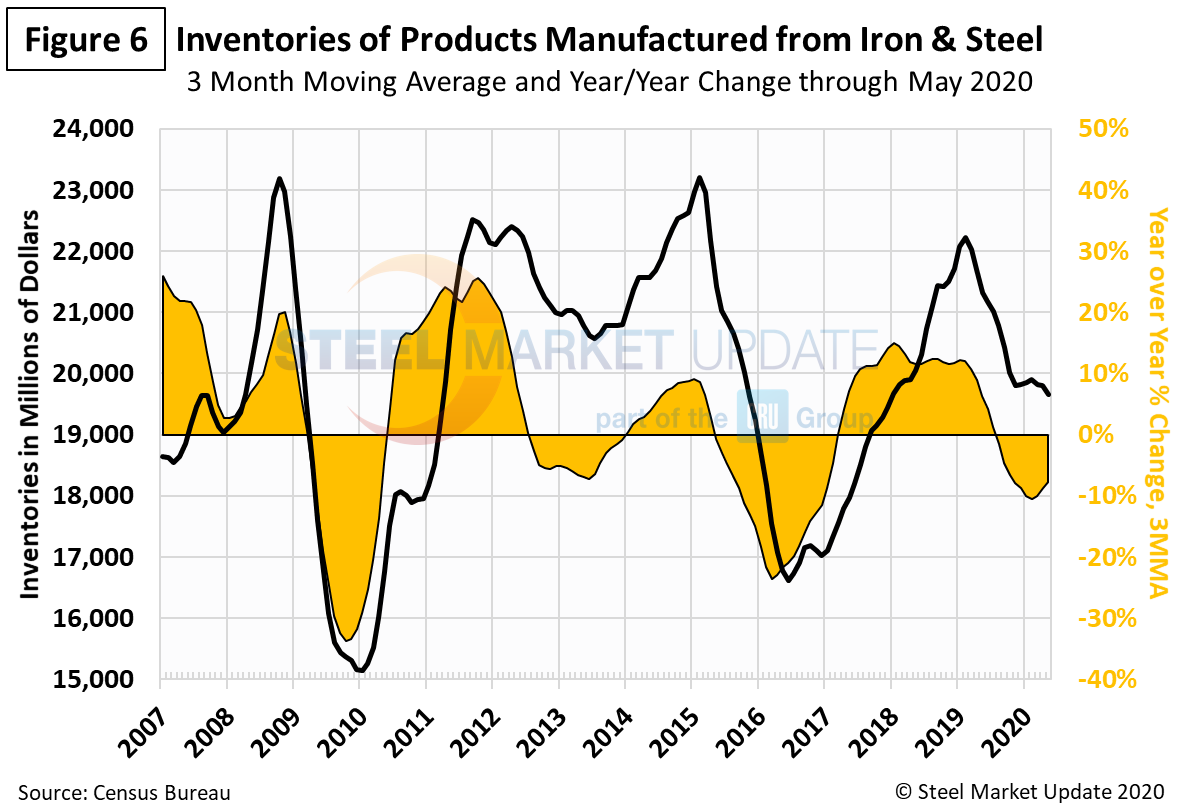
Inventories of iron and steel products declined from March through May, but at a slower rate than new orders, as the impact of the virus on the economy stifled sales and inventory replenishment. (Figure 6).
The ISM Manufacturing Index
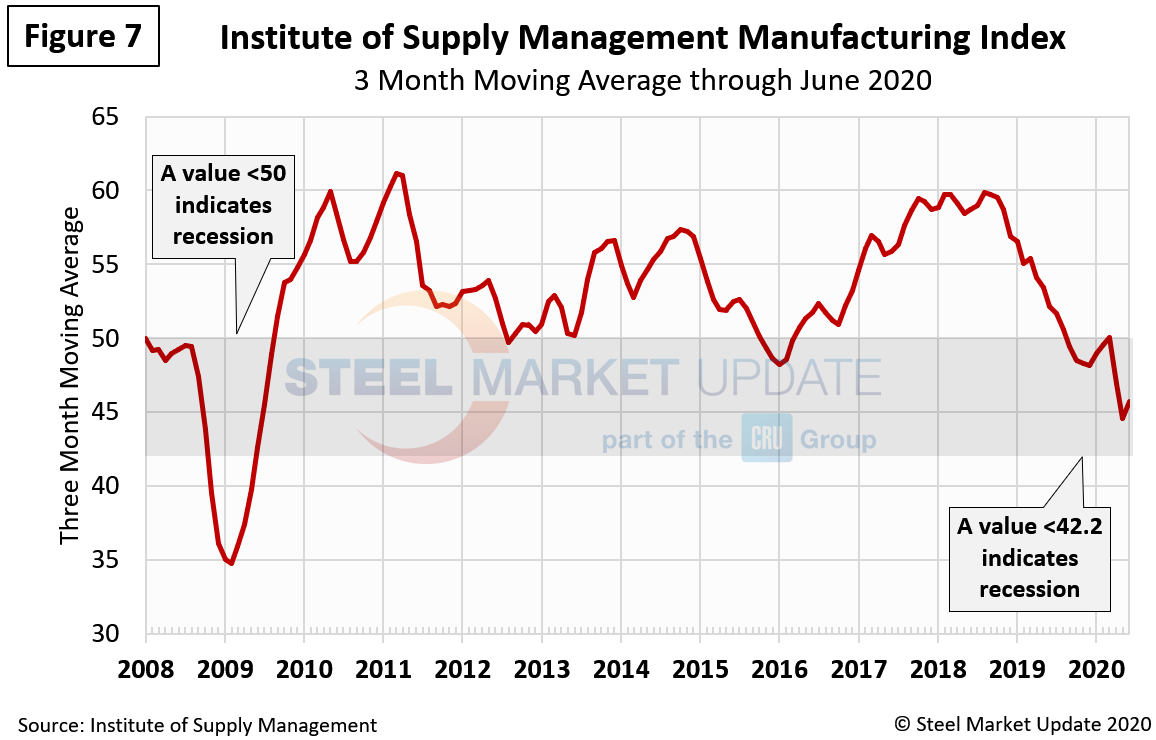
The Institute for Supply Management’s Manufacturing Index is a diffusion index. An index value above 50 indicates that the manufacturing economy is expanding. As Figure 7 shows, the index declined well into contraction territory in April, measured as a 3MMA. The slight uptick in June suggests that orders by corporate purchasing managers are beginning to recover, which holds promise for the economy in the second half.
“The June PMI registered 52.6 percent (not a 3MMA), up 9.5 percentage points from the May reading of 43.1 percent. This figure indicates expansion in the overall economy for the second straight month after April’s contraction, which ended a period of 131 consecutive months of growth,” said Timothy Fiore, chairman of ISM’s Manufacturing Business Survey Committee. “As predicted, the growth cycle has returned after three straight months of COVID-19 disruptions. Demand, consumption and inputs are reaching parity and are positioned for a demand-driven expansion cycle as we enter the second half of the year.”