Market Data

August 17, 2020
Service Center Shipments and Inventories Report for July
Written by Estelle Tran
Flat Rolled = 55.5 Shipping Days of Supply
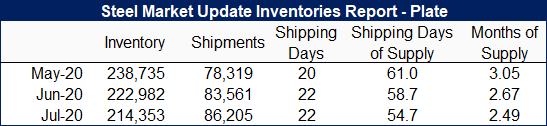
Plate = 54.7 Shipping Days of Supply
Flat Rolled
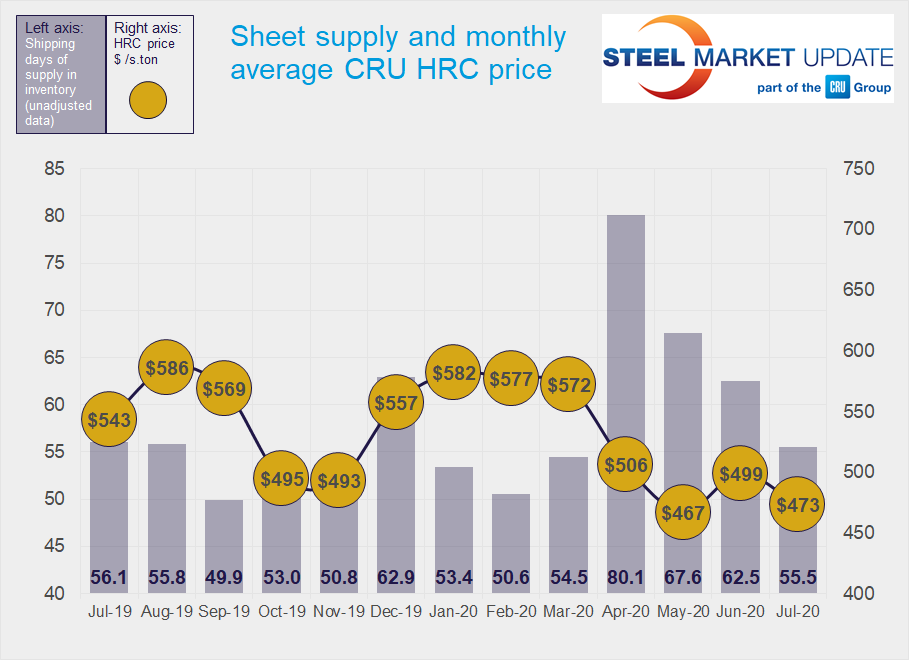
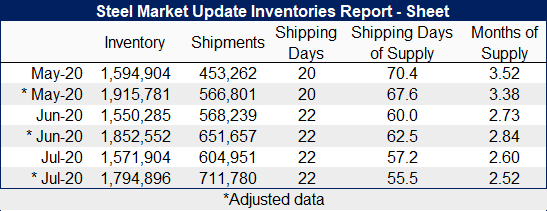
Service centers pared down flat-rolled steel supply in July to 55.5 shipping days of supply, according to preliminary data, down from 62.5 in June’s adjusted data. Inventories represented 2.52 months of supply in July, down from 2.84 in June. July had 22 shipping days, the same as June.
Shipments in July increased 9.2 percent month on month, and some service centers have reported normal business levels.
Total volumes of flat roll on order increased 6.1 percent at the end of July, and the percentage of inventory on order was the highest level reached since February. The percentage of inventory committed to contract was 52.9 percent in July, up from 50.7 in June.
Plate
Service centers cut back plate inventories 3.9 percent in July, while shipments picked up 3.2 percent. Overall, supply dropped to 54.7 shipping days of supply in July from 58.7 in June. Service centers carried 2.49 months of plate supply at the end of July, down from 2.67 in June.
Plate shipments remain subdued, though close to year-ago levels. Buying picked up significantly in July as mills eased off of their announced price increases. On-order volumes increased 13.7 percent month on month. As a percentage of inventory and total tonnage, plate on order was at the highest level seen since February. With inventories at just around 2.5 months of supply and some mill shipments running behind, service centers came back to the market to fill holes in their inventories, and also because mills had cut deals in the last month.