

Market Data
August 20, 2020
SMU Market Trends: Measuring the Recovery
Written by Tim Triplett
For more than 28 percent of steel buyers, business is back to pre-COVID levels already, while at the other end of the spectrum 9 percent have seen little or no recovery. For the vast majority in between, the recovery process is a slow and ongoing one.
In the latest market canvass this week, SMU asked: How much has your business recovered from the low point you experienced after the virus hit? The response:
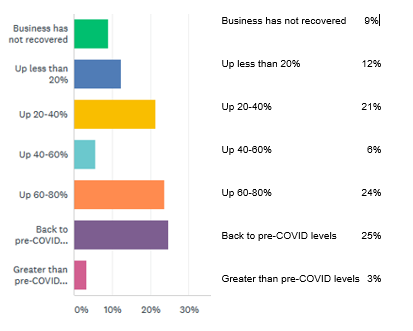
Calculated as a weighted average of all responses, the typical company is back roughly 60 percent from the depths of the drop-off seen in April and May when action to stem the spread of the coronavirus disrupted the economy.
The impact of the pandemic has been uneven from company to company, depending on their location and the markets they serve. Suppliers to the automotive sector suffered among the worst when the auto plants shut down in April, but have recovered among the best since vehicle production has resumed. Those serving residential construction report positive activity; commercial construction not as much. GDP in the Midwest and South/Central regions has suffered less than the Northeast, for example.
Here’s what a few respondents to SMU’s questionnaire said this week:
“Our business is improving weekly and should continue unless our governor(s) decide another lockdown is in order.”
“Demand for our industry’s products are at an all-time high due to the pandemic.”
“We are heavily construction-oriented, so short-term we were the least impacted. We are more concerned with later in the fourth quarter and first half of 2021 that commercial and government/institutional spending will be revised and projects for new building and renovations will be removed or postponed to later dates.”
“It’s hard to say how much we’ve recovered. We have been struggling not so much due to COVID-19 shutdowns but due to low U.S. prices, trade tariffs and an environment not favorable for imports.”
“Business is better, but very competitive.”
“We never really saw a decrease. We are up around 11 percent year to date compared to 2019.”
“We’re at about 90 percent of pre-Covid-19 levels.”


