

Market Segment
September 11, 2020
CRU: Are Steel Mill Profits Sustainable?
Written by Paul Butterworth
By CRU Research Manager Paul Butterworth, from CRU’s Steel Raw Materials and Steel Costs
CRU price and cost forecasts suggest that the steel sector generally will return close to steady-state, or “through-cycle,” levels of profitability over the five-year forecast period. However, as our analysis highlights, steady-state profitability of individual steel mills has varied widely in recent years and some mills have failed to achieve a minimum sustainable profit level.
Some steel mills have been more sensitive to the current, Covid-19 related, downturn; steel mills that are more exposed to construction sectors have been less affected. In addition, the recovery, while following the same general trend, will not be equal across regions, and we need to understand structural changes to costs and prices to fully understand profit performance on a more granular level.
Combining CRU prices and costs obtained using CRU’s Steel Cost Model, with company reported profit figures, CRU has developed an approach that can be used by steel companies, banks and investors for planning, valuation, credit risk and investment decisions, as well as by steel buyers in steel price contract negotiations. A simplified version of this analysis can also be undertaken using CRU’s Cost Analysis Tool (CAT), available online.
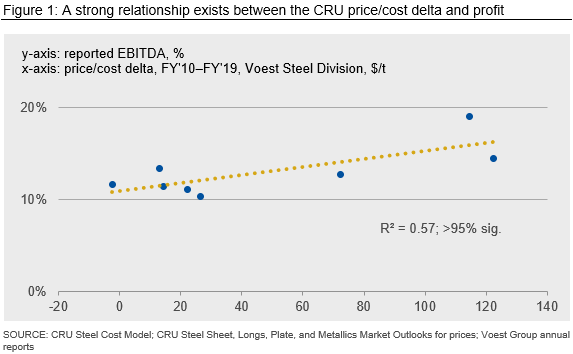
Correlation Between CRU Price/Cost Delta and Reported Profit
CRU’s Steel Cost Model (SCM) covers 60 percent of global steelmaking capacity, including all major steel mills, and provides costs across all production facilities by plant for the period 2006 to 2025. Along with CRU steel prices and company reported profitability figures, historical cost analysis using the SCM can be used to determine the relationship between reported profitability at an individual mill and different price/cost conditions.
The results of our analysis, shown in Figure 1, shows the strong relationship between reported profitability and price/cost differentials (steel prices minus costs on a product by product basis for the given company) derived from CRU’s price and cost data for Voestalpine Steel Division (Voest Steel). This analysis has been carried out for many of the mills in the SCM – taking into account cost and price movements across their full sales portfolios – and similarly strong relationships have been determined, demonstrating that CRU prices and costs reflect very well real world price, cost and profitability conditions.
This approach provides a tool for understanding how mill profitability will be affected under different price conditions both now, during the Covid-19 global pandemic, and over the forecast period; so, this approach can be of use in planning, valuation, credit risk and investment considerations. Equally, such an approach can be used by buyers of steel in negotiations to assess whether offered prices, and their implied profitability to the steel company, match current expectations of steel industry performance.
Latent Excess Capacity Sets an Upper Limit for Mill Profit
Historical analysis of prices and costs shows that steel prices (here hot-rolled coil is used) are set around the 95th percentile of the global cost curve under steady-state conditions. However, annual prices have dropped to the 65th percentile and quarterly prices as low as the 18th percentile; for example, in 2015 when the steel market was performing particularly poorly. While steel prices can and do cut deep into the cost curve they rarely, if ever, lift above the 100th percentile, even on a quarterly basis, suggesting prices can fall to very low levels on the cost curve, pulling profitability to very low levels; there is a limit to how high prices and therefore profits can rise. In our view, latent excess capacity in the steel industry sets this upper limit.
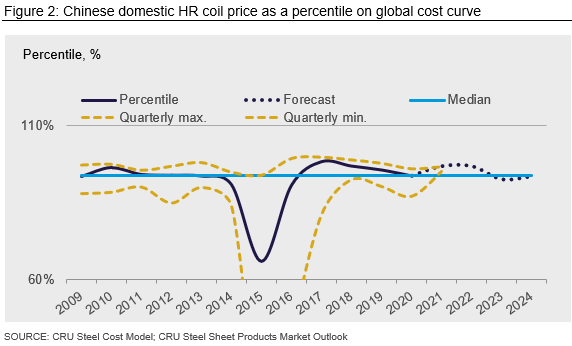
Our price and cost forecasts for 2020 show that the Chinese HR coil price will sit at ~94th percentile of the cost curve, implying conditions marginally below steady-state overall, but the weakest quarter price, from Q2, sits at the 87th percentile, below the typical “low quarter” level historically. We expect prices – and profitability – in China to lift above steady-state in 2021, as stimulus measures continue to provide a boost, and to fall back to the steady-state level at the end of the forecast period. But, what does this mean for prices and profitability of steel mills elsewhere that are exposed to different prices?
Costs are Rising Over the Medium Term
By comparing the global hot-rolled coil cost curve for 2020 and 2024, taken from CRU’s Steel Cost Model, we see production expanding over the forecast period as the steel market improves and costs rising. Median global costs are expected to rise by ~$23 /t HR coil over the forecast period, but costs in the price setting region (i.e. the 94th percentile) will rise by $38 /t HR coil; this against a forecast backdrop of falling iron ore prices, rising coal prices and significantly rising scrap prices.
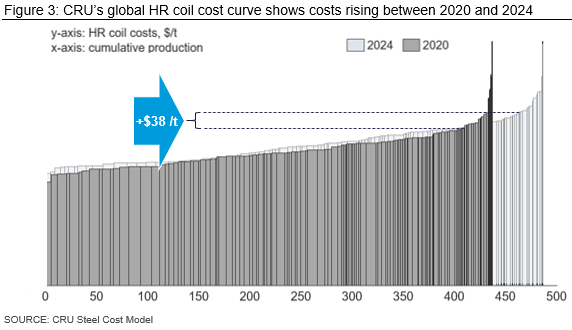
Rising costs coupled with prices set higher up the cost curve as the steel market improves imply rising steel prices overall.
Profitability of Steel Mills Will Rise Outside China
To determine the expected profitability of individual steel mills both in 2020 and out to 2024, in an environment of rising costs and prices, we have applied our approach to mills across Europe, North America, South America, Japan, and India. As an example, the chart below shows the forecast profitability of Voest Steel for FY’21 (financial year to March), for the lowest quarter of FY’21 (assumed to be calendar Q2), as well as for the forecast period to FY’25. Additionally, the historical analysis is used to determine the steady-state profitability of Voest Steel through the cycle.
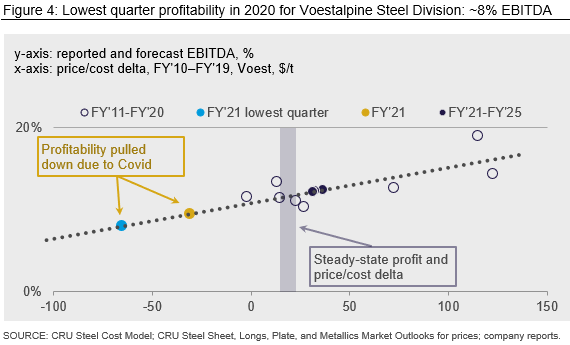
The above analysis indicates that the steady-state profitability of Voest Steel is ~12% EBITDA. Given the effect of Covid-19 on demand and prices, profitability is expected to fall to ~9% EBITDA for FY’21 overall, but the lowest quarter during the year should see profitability fall to ~8% EBITDA (this forecast is aligned with recently released financial results for Q1 giving an EBITDA of 8.2%). In FY’22, profitability will lift to ~12% and, overall, we expect Voest Steel to return to slightly above steady-state profitability in the medium term, which is shown by the dark dots in Figure 4, above. This analysis was repeated for a number of mills globally and the results are set out by region in Figures 5, 6, and 7 below.
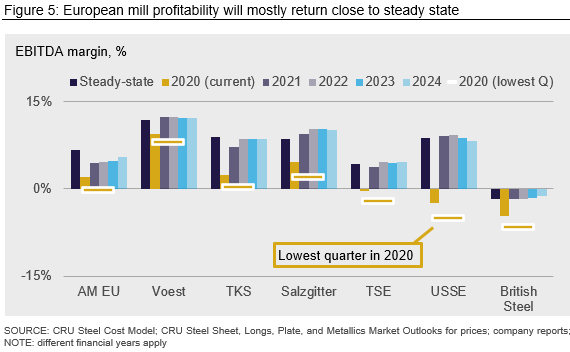
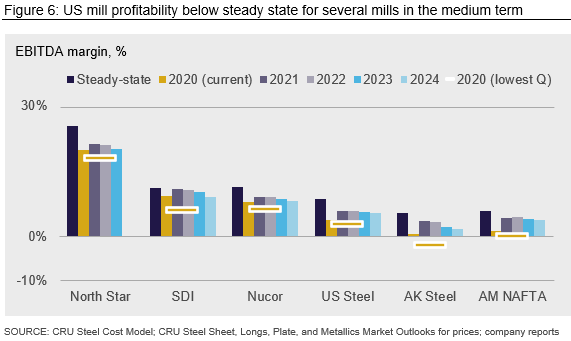
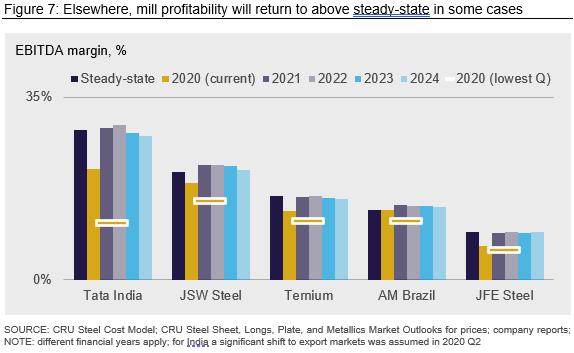
From this analysis we can see steel mills generally are expected to see improved profit performance from 2021 onward, but stronger years are expected in the early period of our forecast as stimulus measures bring demand forward. However, overall, we expect the steel industry generally to earn close to steady-state levels of profitability by the end of our forecast. For comparison, the steady-state profitability of the mills studied estimated by this methodology are set out in Figure 8 below, showing the broad range of profit performances across the industry.
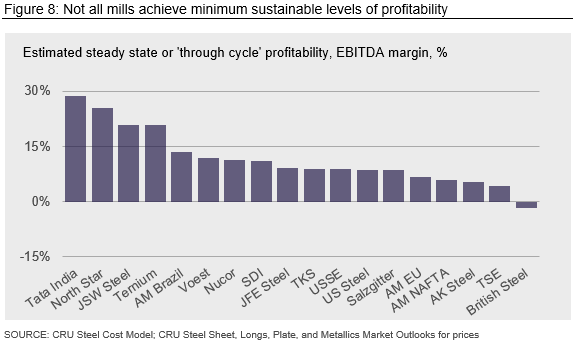
In recent years, not all mills have achieved the suggested minimum sustainable levels of profitability.
Which Mills Have Been Most Affected by Covid-19?
Applying the historical relationships determined by this approach, the below sets out the sensitivity of the different mills to the Covid-19 downturn. This chart shows the differential between the estimated steady-state profitability of each mill and the estimated profitability during the weakest quarter in 2020 to give an indication of the degree to which profitability has been affected by Covid-19.
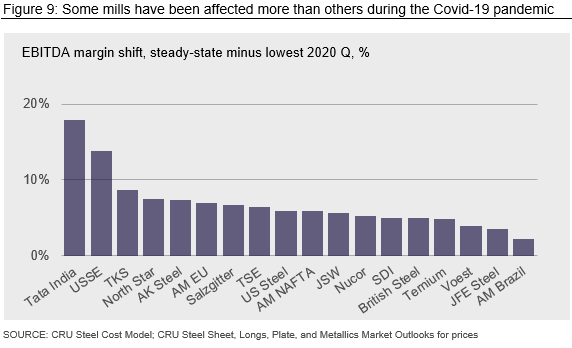
Profitability at most mills is affected by 5–7% EBITDA, steady-state to trough, but some mills appear to be more susceptible to the downturn, such as Tata India and USSE. By contrast, companies such as Voest, JFE and AM Brazil appear more protected from the market downturn, perhaps due to downstream strategy, the impact of Covid-19 on specific segments, the strength of customer relationships or specific characteristics of the local market. Mills apparently less affected by the Covid-19 downturn, those towards the right-hand side of the chart in Figure 9, tend to have a greater exposure to construction markets, which were less affected than manufacturing during this latest downturn.
Tata India exhibits a high steady-state profitability of 29% EBITDA – probably one of the highest in the world – associated with low costs, a high-priced Indian market and large market share. However, the destruction of domestic demand during lockdown meant that all steel mills in the country needed to make a major shift into the export market where, because of low demand generally, steel was being priced close to variable costs. This structural change was specifically taken account of in this analysis and, coupled with higher fixed costs as production was curtailed, led to the large swing in forecast profitability.
Latest financial releases show that TKS has suffered significantly in the Covid-19 downturn (FY’Q3 reported EBITDA of -15%) – far more than implied by the analysis here. This could imply TKS has been exposed to a unique set of circumstances that have impacted profitability to a greater degree than its peers. A full analysis has not been carried out, but strong exposure to the auto sector, which effectively halted operations in Q2, as well as exposure to client companies that themselves are heavily exposed to exports reflects the large drop in deliveries experienced by TKS during calendar Q2. These factors were not specifically, or properly, accounted for here, but simply having access to this type of analysis helps to identify when performance falls outside of historical norms and is a start point for understanding the drivers behind that performance.
We have also compared forecast profitability in the April-June quarter (assumed lowest quarter) with recently reported results for that quarter for most of the companies analyzed. The results are shown in Figure 10, below, which shows TKS Europe and U.S. Steel Flat Rolled both appear to be outliers in this respect. However, as for all the companies analyzed here, these two are both expected to show recovery from these levels from 2021 (North Star Bluescope is also a potential outlier by this measure, but this is less clear from the data and it has not been highlighted below).
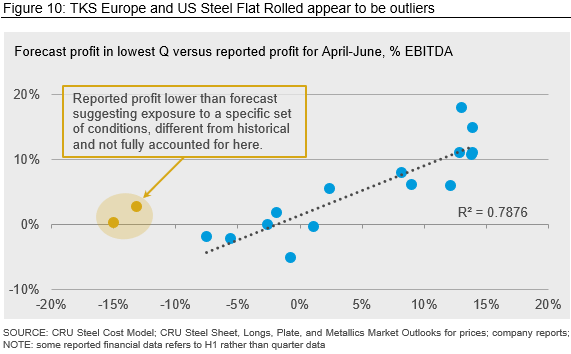
The shift to the export market in India and reported profitability of TKS and U.S. Steel Flat Rolled in calendar Q2 highlight the need to understand major shifts in costs or market exposure, specific to a company, as a precursor to understanding profit performance. It is recognized that these affects may not have been fully considered for all the mills analyzed here.
Conclusion
There is typically a strong relationship between the price/cost differential derived using CRU prices and costs and applied to a steel company’s sales portfolio, and the profitability of the steel company as reported in financial statements, demonstrating that CRU prices and costs, as obtained using CRU’s Steel Cost Model, fully reflect real world price/cost conditions.
This relationship provides an approach that can be used by steel companies, banks and investors for planning, valuation, credit risk and investment considerations, but also by steel buyers in steel price negotiations.
CRU price and cost forecasts suggest that the steel sector generally will return close to steady-state levels of profitability over the five-year forecast period, falling back from a stronger period in the earlier years of the forecast. However, the analysis also highlights that the steady-state profitability of individual steel mills varies widely and some do not achieve minimum sustainable levels of profitability.
Finally, this analysis shows that some steel mills have been more sensitive to the current, Covid-19 related downturn – steel mills that are more exposed to construction sectors have been less affected – and that recovery, while following the same general trend, will not be equal. It also highlights the need to understand structural changes to costs and prices (for example the shift to the export market in India during Q2, or loss of key customer segments) to fully understand profit performance versus peers.
Request more information about this topic.
Learn more about CRU’s services at www.crugroup.com

