Market Data
September 17, 2020
August Reveals Positive Changes in Producer Prices
Written by David Schollaert
Steel Market Update is pleased to share this Premium content with Executive members. For information on upgrading to a Premium-level subscription, email Info@SteelMarketUpdate.com.
Following is an analysis of Bureau of Labor Statistics (BLS) Producer Price Index data. The PPI is a family of indexes that measure the average change over time in the prices received by domestic producers of goods and services. SMU’s analysis offers a view of the competitive position of sheet steel vs. aluminum, plastic and wood. The analysis includes some downstream products and a comparison of truck and rail transportation.
![]()
On Sept. 10, the BLS released its series of PPIs for more than 10,000 goods and services through August 2020. The PPI data are helpful in monitoring price direction, though there may be a lag between the BLS reports and spot prices for steel products. The actual index values of the PPIs of different products cannot be compared with one another because they are developed by different committees within the BLS. This data is useful in comparing the direction of price changes in the short and medium term, but not the absolute values.
Figure 1 shows the composite PPI of all commodities since January 2008. The index rose steadily from March 2016 through October 2018 before declining by 4.0 percent through February 2020. As a result of the global COVID-19 pandemic, a further decrease of 5.4 percent was seen in March and April; however, a recovery that began in May has continued through August. Overall, the composite was up by 2.9 percent in the 12 months of 2018, broke even in 2019 and was down by 2.6 percent in 2020 through August.
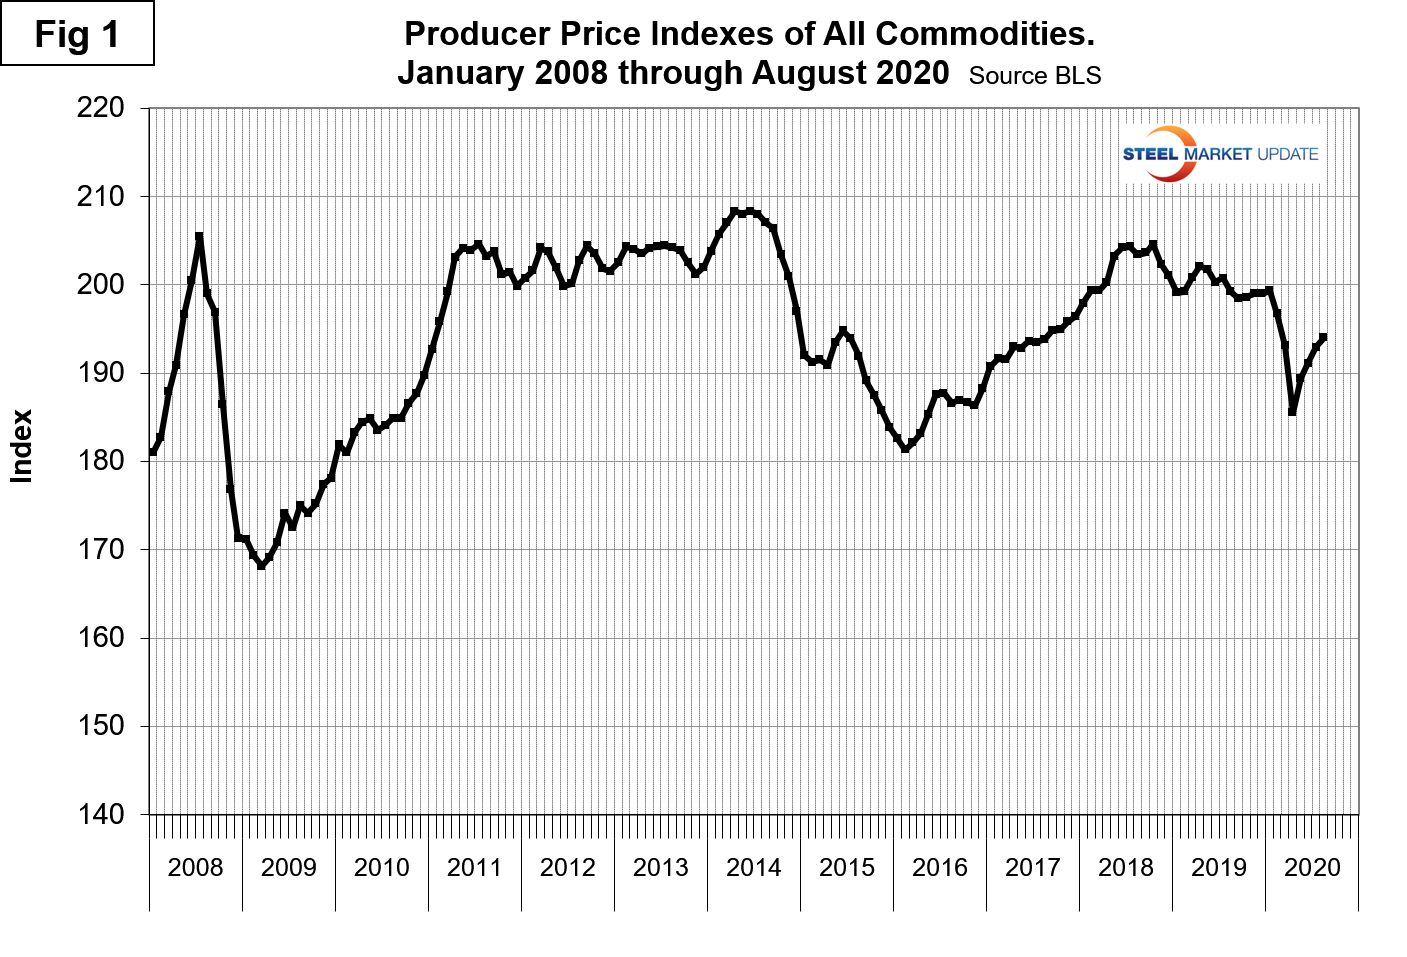
Table 1 is a summary of each segment on a year over one-, two and three-year basis. The gain/loss pattern is shown by the color codes; rising prices are considered positive. The table includes direct comparisons where possible between steel and competing products, also some other plastic products for which there is no direct steel comparison, and a measure of price changes for transportation, warehousing and storage. Some specific comparisons of steel and steel products with their competition are as follows (note the Y axes on Figures 3-7 are not to the same scale).
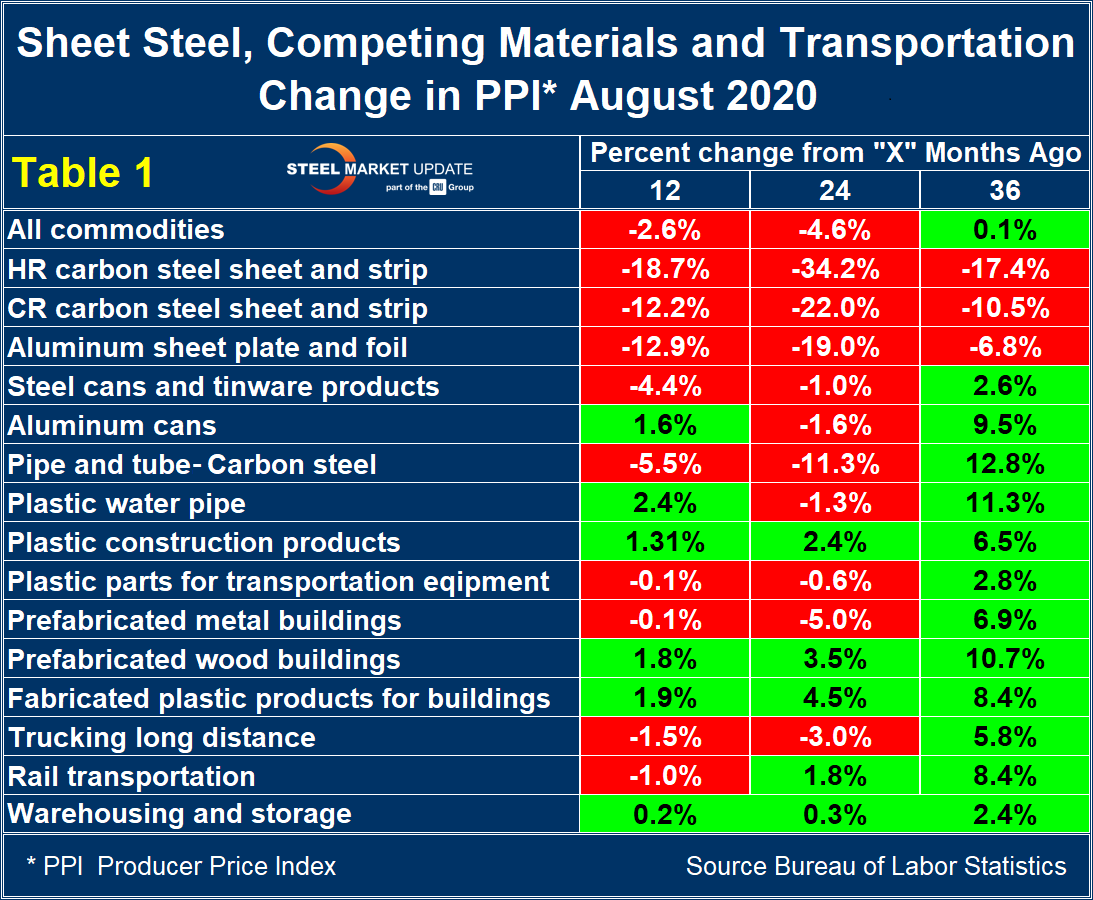
Figure 2 shows the year-over-year comparison of the price change of cold rolled steel sheet and flat rolled aluminum. The lines crossed in August 2018 when steel prices began to escalate faster than aluminum. This relationship reversed in July 2019 and for six months the price of cold rolled declined faster than that of aluminum sheet. In the first eight months of 2020, CR steel sheet has had a price decline of 10.2 percent after an accentuated drop of 4.6 percent in August alone. Despite an increase of 1.2 percent month-on-month for aluminum sheet, it has declined by 11.6 percent year-to-date.
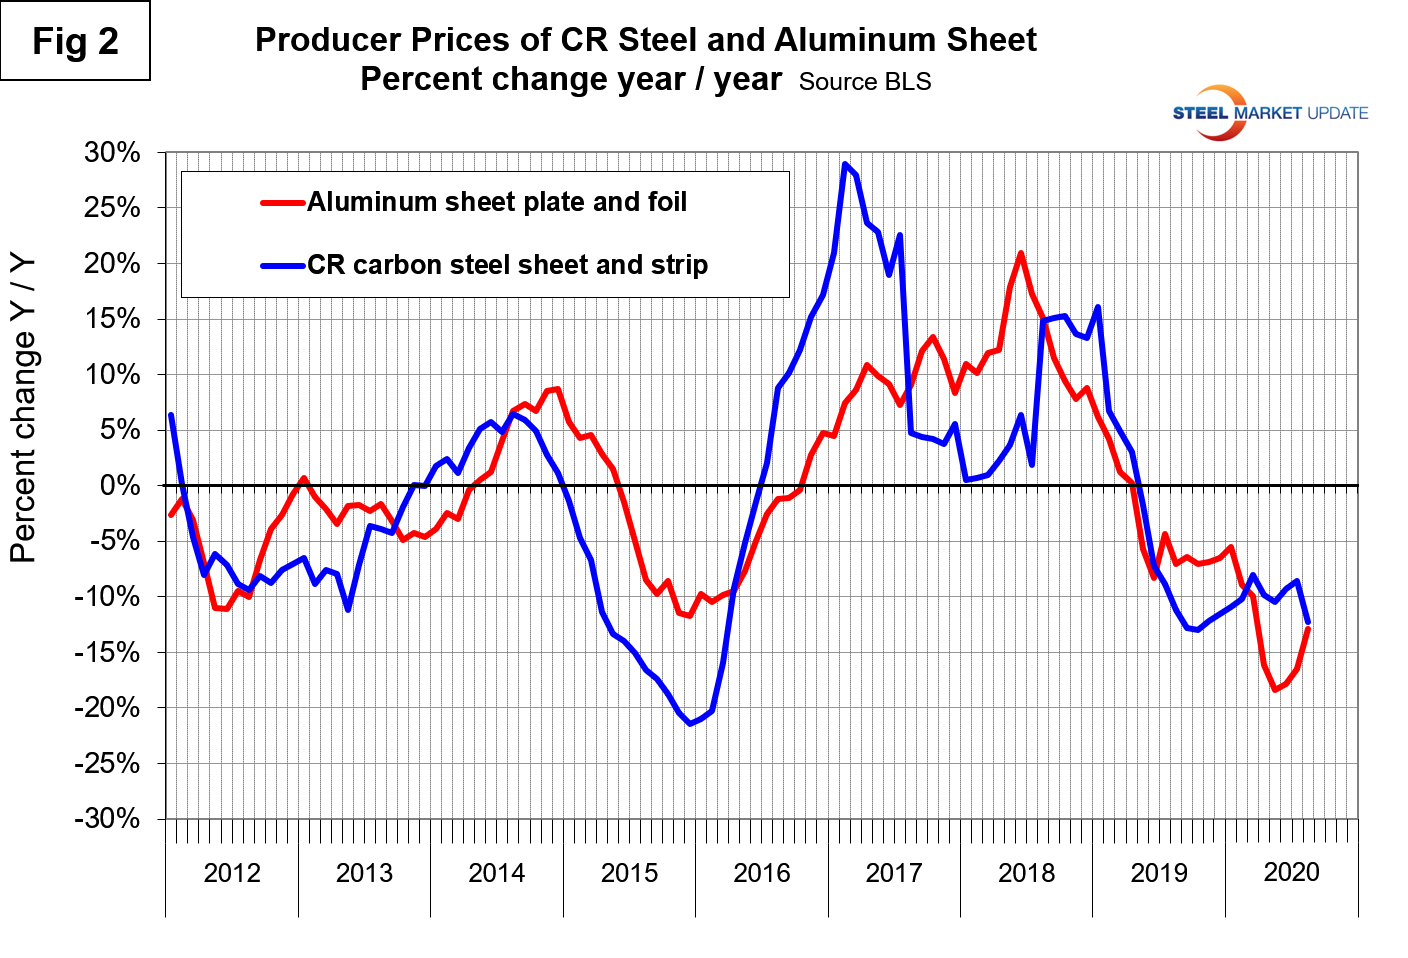
Figure 3 shows the same comparison for steel tinware products and aluminum cans. Steel cans became much more competitive in May 2020, but have since lost some of that ground.
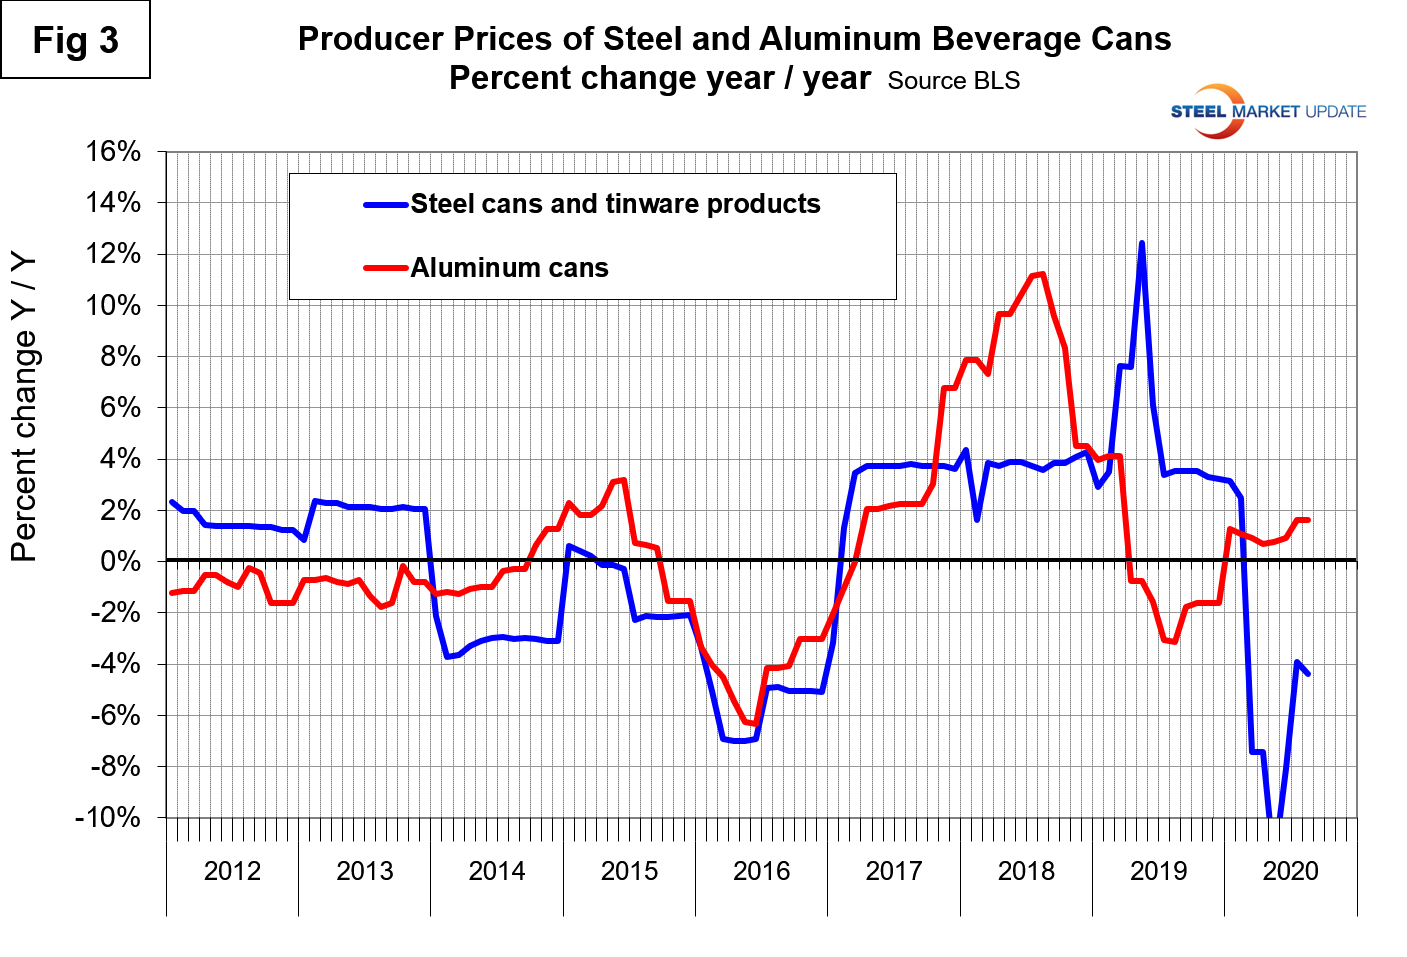
Figure 4 compares prefabricated metal with prefabricated wood buildings. In this analysis, steel buildings have shown price declines every month since May 2019, while the price of wood buildings has escalated every month during the same period. Since May 2019, the price of steel buildings has declined by 3.3 percent as the price of wood buildings has increased by 2.9 percent.
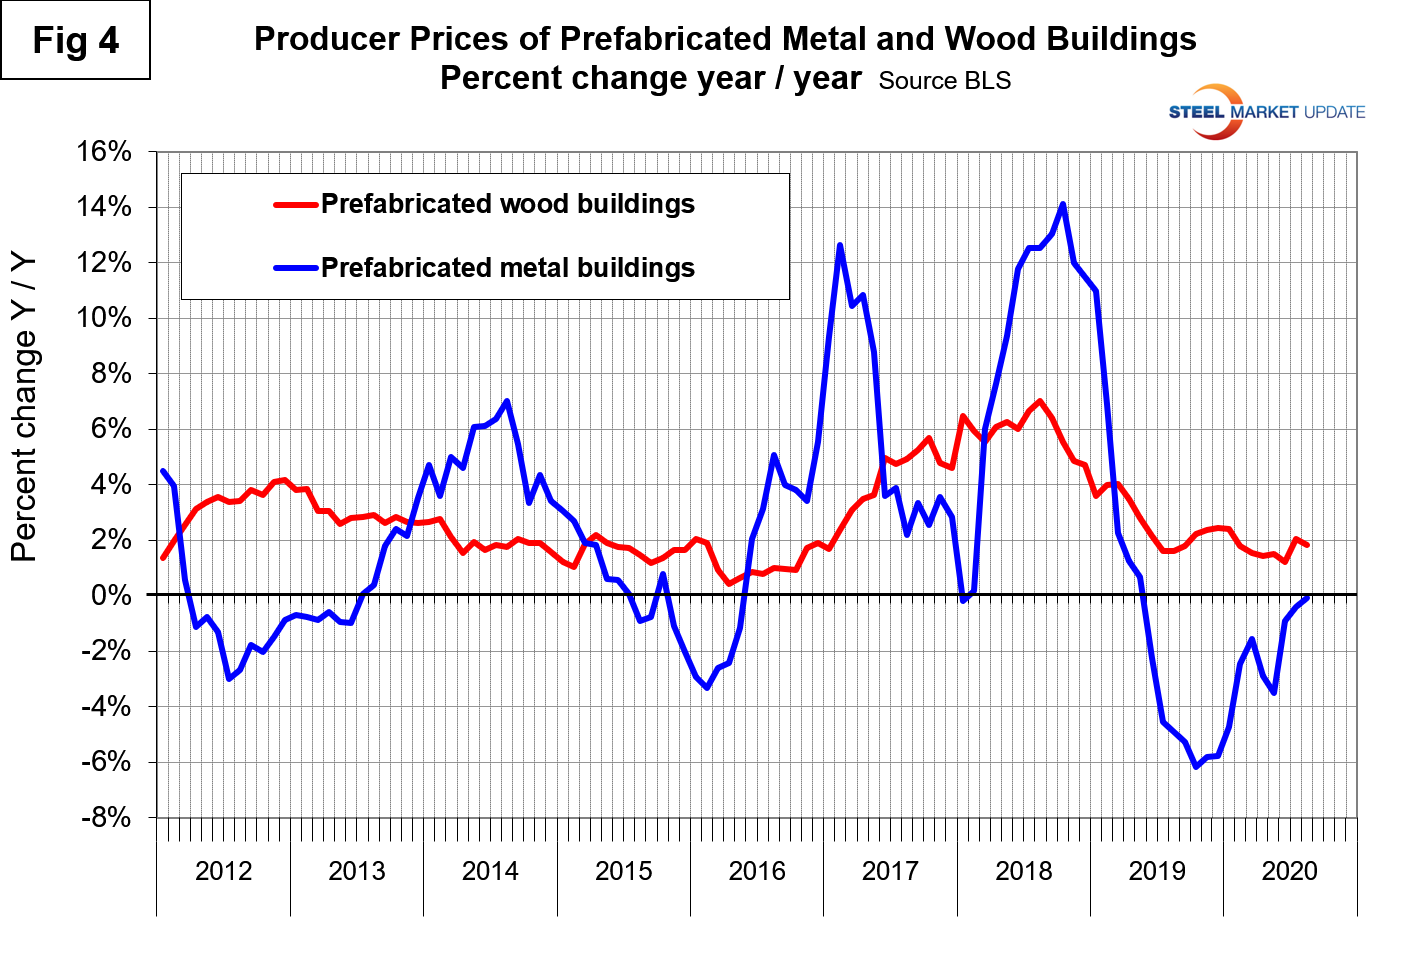
Figure 5 compares the price changes of steel and plastic pipe, which moved in opposite directions to the detriment of steel in 2018. In 2019, the rates of price escalation had come back in line by July, where they have stayed through August 2020, with plastic pipe still tracking above steel.
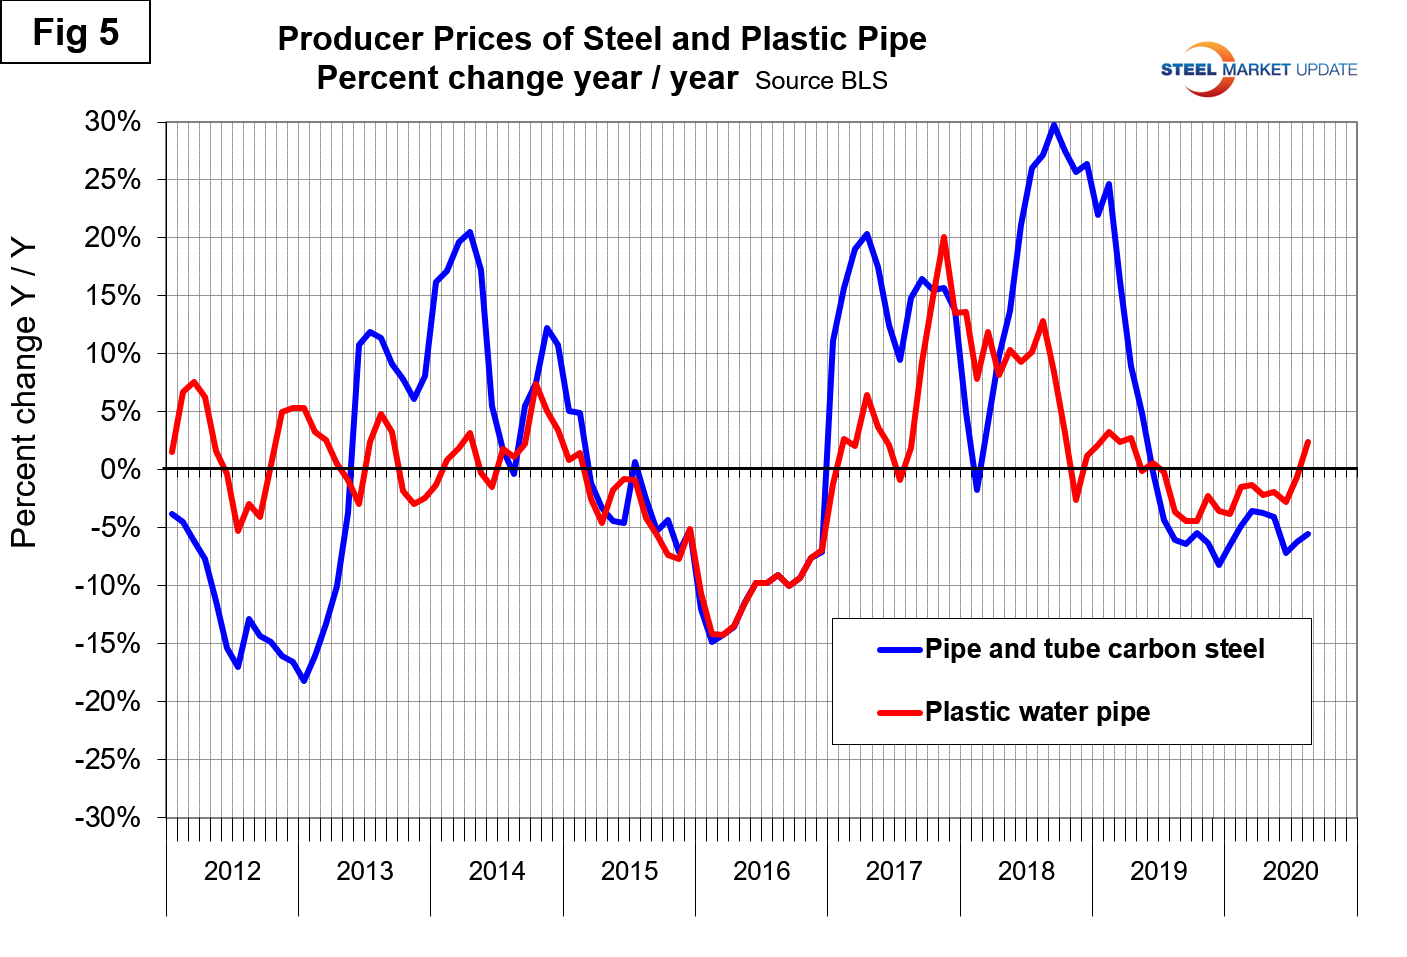
Figure 6 compares the changes in the price of truck and rail transportation. The escalation of truck transportation prices exceeded those of rail almost every month from January 2015 through April 2019 when the lines crossed. Trucking was affected more by the pandemic through May this year, yet in July the rates of decline of truck and rail were the same with both seeing a slight uptick in August.
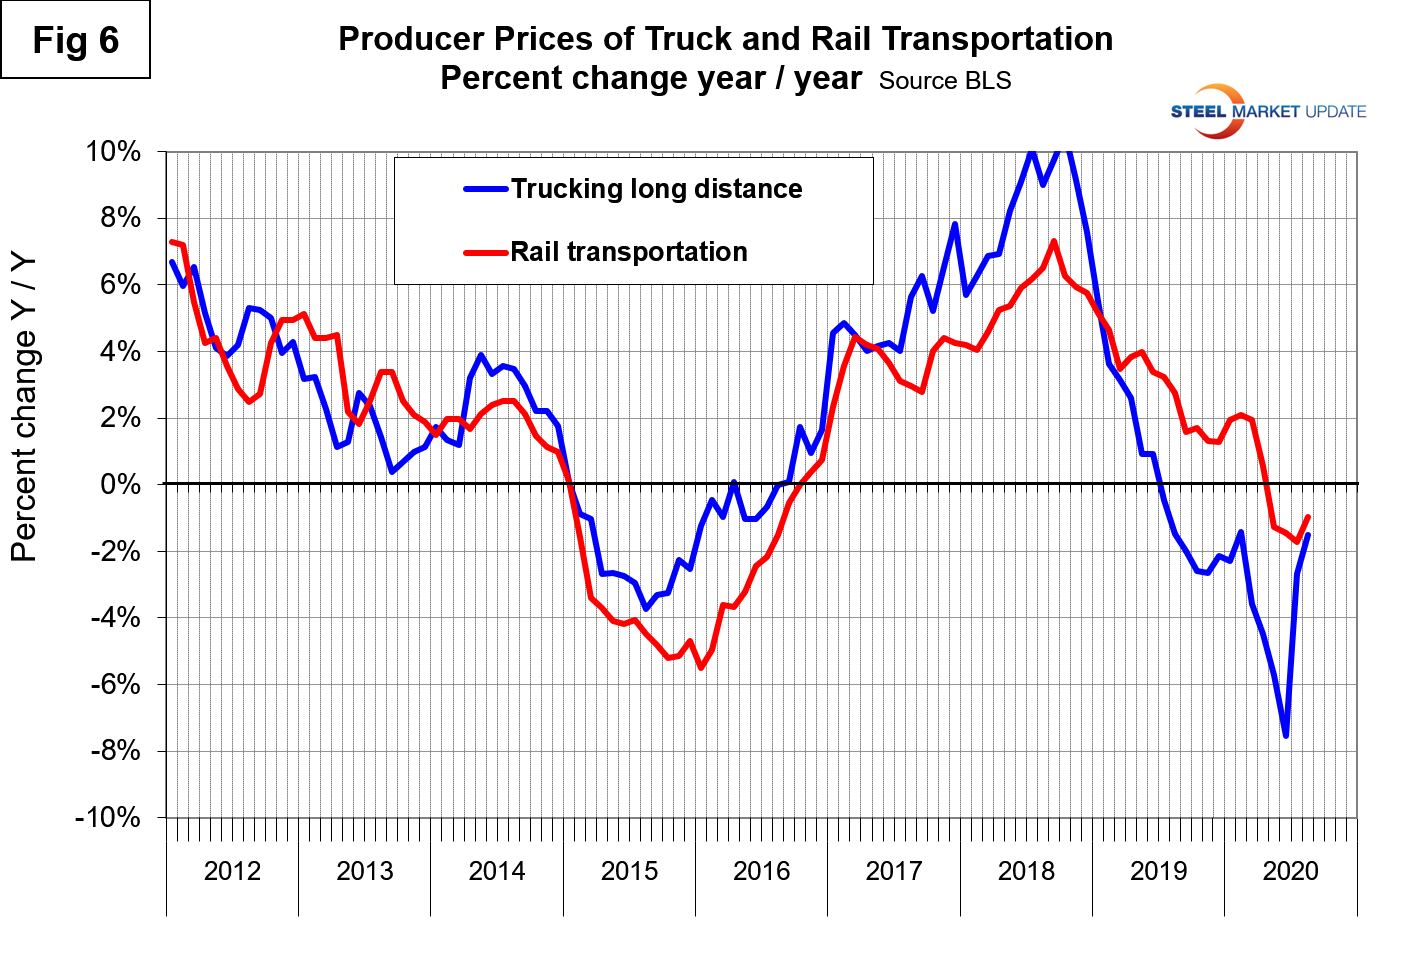
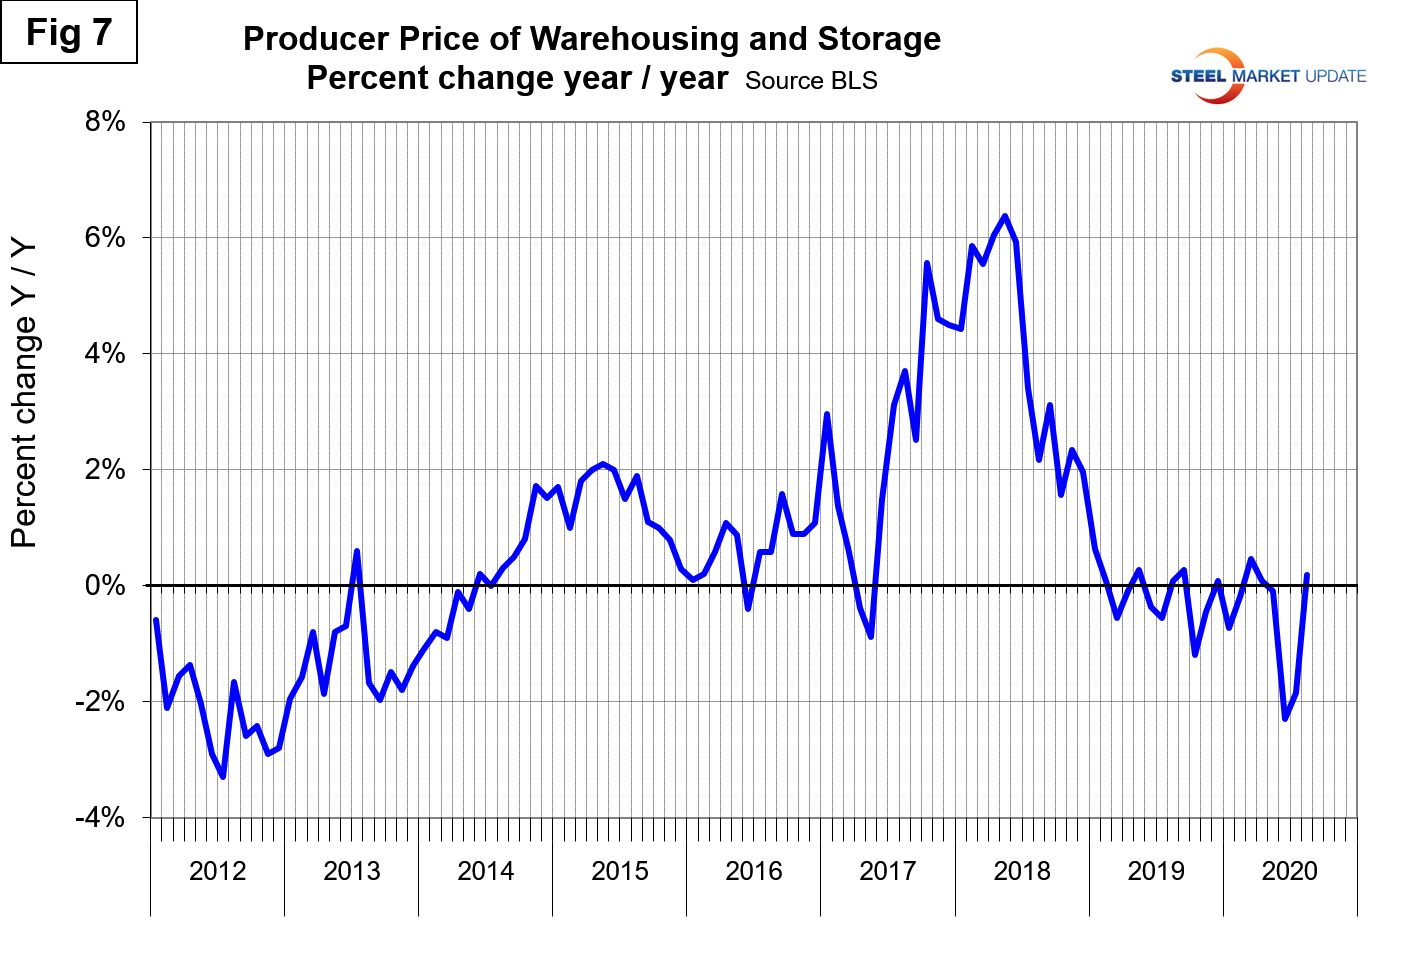
Figure 7 shows that the rate of change of the price of warehousing and storage declined steadily from April 2018 through March 2019. Pricing held relatively stable though March of this year before being negatively affected by the pandemic. August saw a rebound of 2 percent month on month.