Premium

September 24, 2020
Global Scrap Trade Declined by 24.5 Percent in Q2 2020
Written by Peter Wright
Steel Market Update is pleased to share this Premium content with Executive subscribers. For information on upgrading to a Premium-level subscription, email Info@SteelMarketUpdate.com.
Steel Market Update performs this quarterly analysis using data from the Iron and Steel Statistics Bureau (ISSB) in the UK. We believe that to improve our understanding of the gyrations of the domestic scrap market, we should be aware of where the U.S. stands as a global player. Some nations are slow to report, which results in our analysis being two months in arrears, but we believe it gives a valuable perspective of global trends. All tonnages in this report are metric.
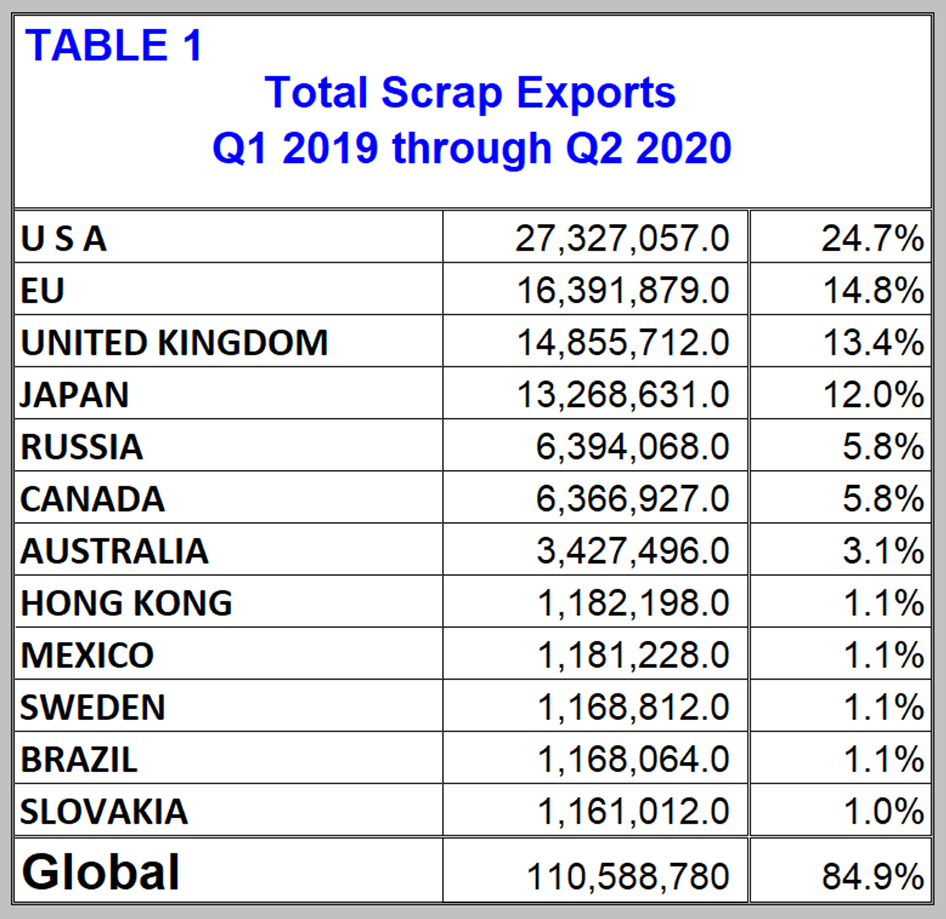
Summary: As is historically the case, the U.S. was the highest volume exporter and Turkey the highest volume importer through Q2 2020, and these tonnages are usually almost exactly the same. In the period Q1 2019 through Q2 2020, the U.S. exported 27.3 million tonnes and Turkey imported 27.8 million tonnes. These were 23.3 percent and 27.4 percent of the global total, respectively. Total global scrap trade declined by 24.5 percent in Q2 as the pandemic took hold. Table 1 shows the total volume of exports for the top 11 trading nations plus the EU as a block in the six quarters Q1 2019 through Q2 2020. This group accounts for 84.9 percent of total global trade. In this analysis of global scrap trade, we have excluded movements within the EU from the global total.
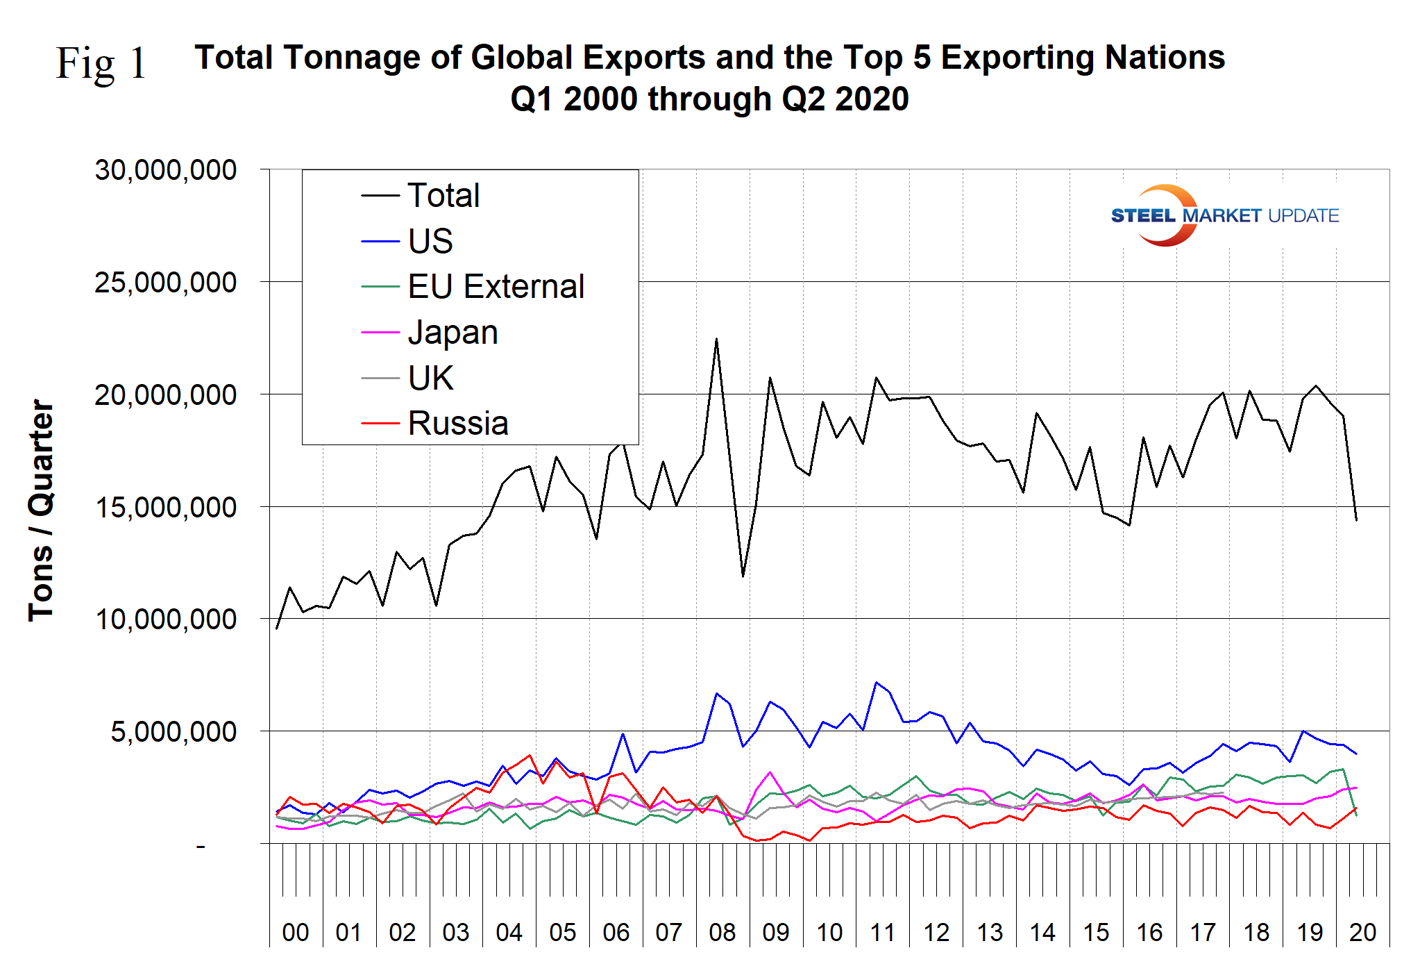
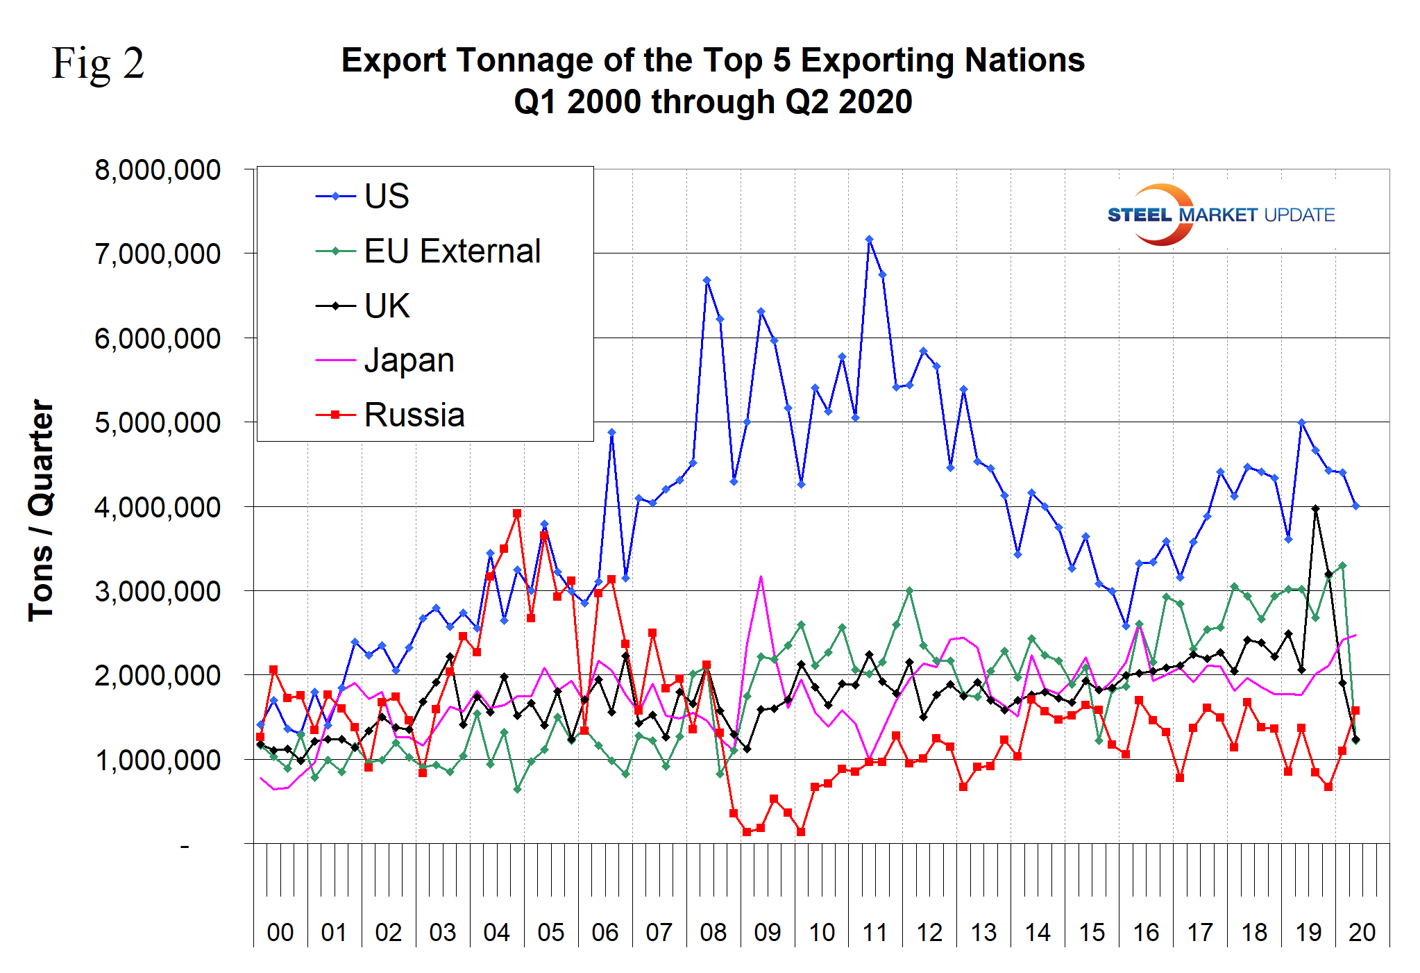
Figures 1 and 2 show the total tonnage of global trade since Q1 2000 and the export volume of the top five suppliers. These five are the U.S., the EU, the UK, Japan and Russia; since 2002 they have accounted for over two-thirds of the total. Figure 2 is the same as Figure 1 with the total removed. Total global trade in ferrous scrap declined by 24.5 percent in Q2 compared to Q1. The U.S. export tonnage was down by 9.1 percent, but the U.S. share increased from 23.1 percent to 27.8 percent. The surprise in Q2 was that the tonnage shipped out of the EU fell by 62.9 percent and the EU share fell from 17.3 percent to 8.5 percent.
The global market share of the top five exporters is shown in Figure 3. The EU and the UK moved from equal second place in Q4 2019 to equal fifth place in Q2 2020. Japan and Russia picked up the difference. After declining for the seven years 2009 through 2015, the U.S. share has increased since Q1 2016. The U.S. has been the highest volume exporter every quarter since Q4 2005.
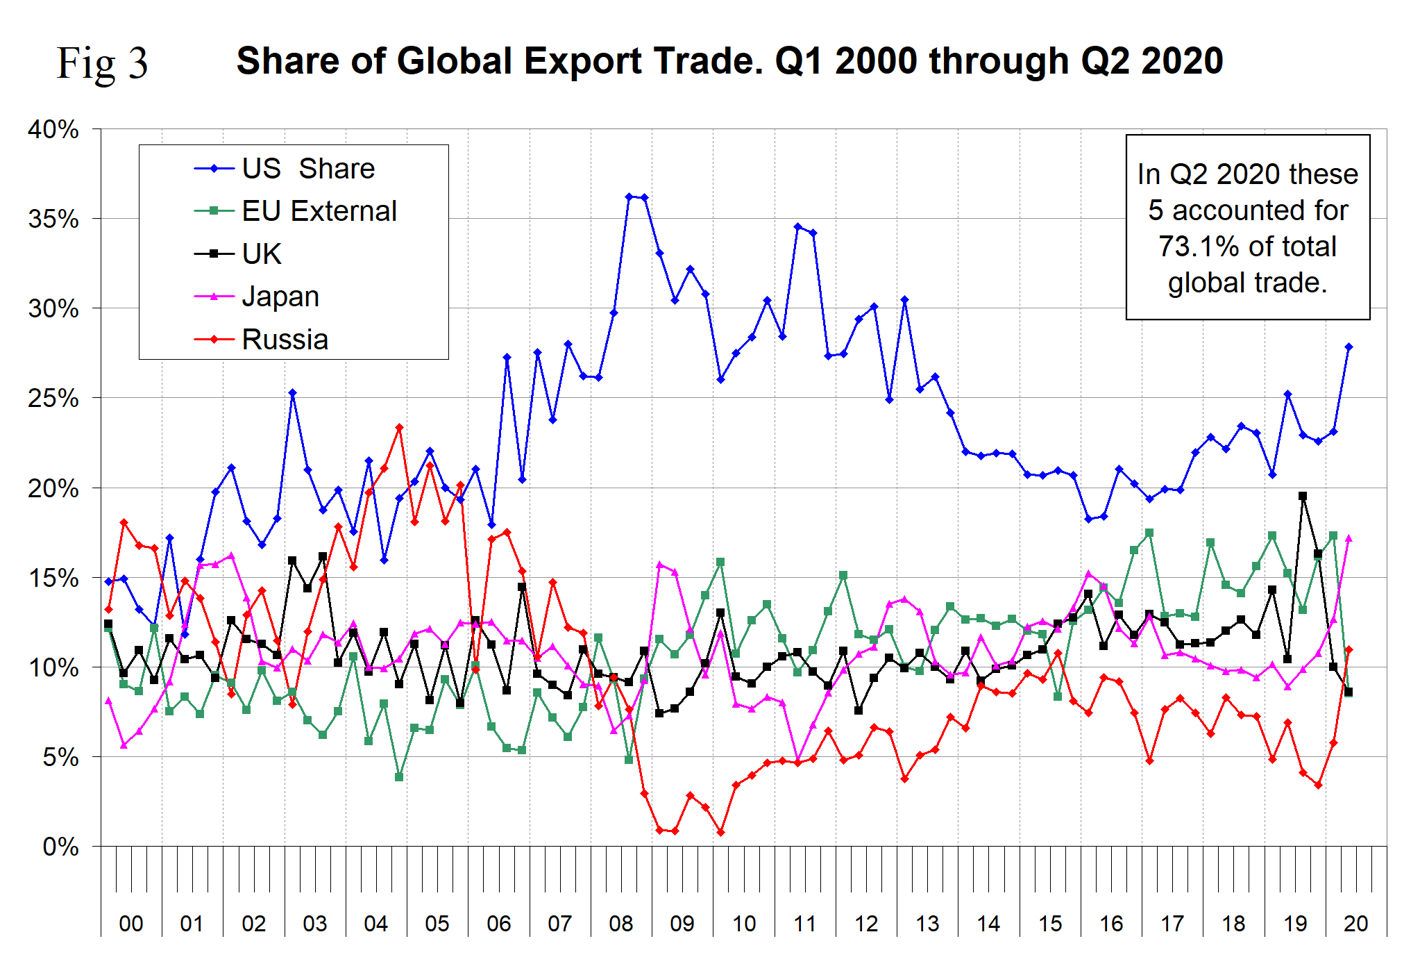
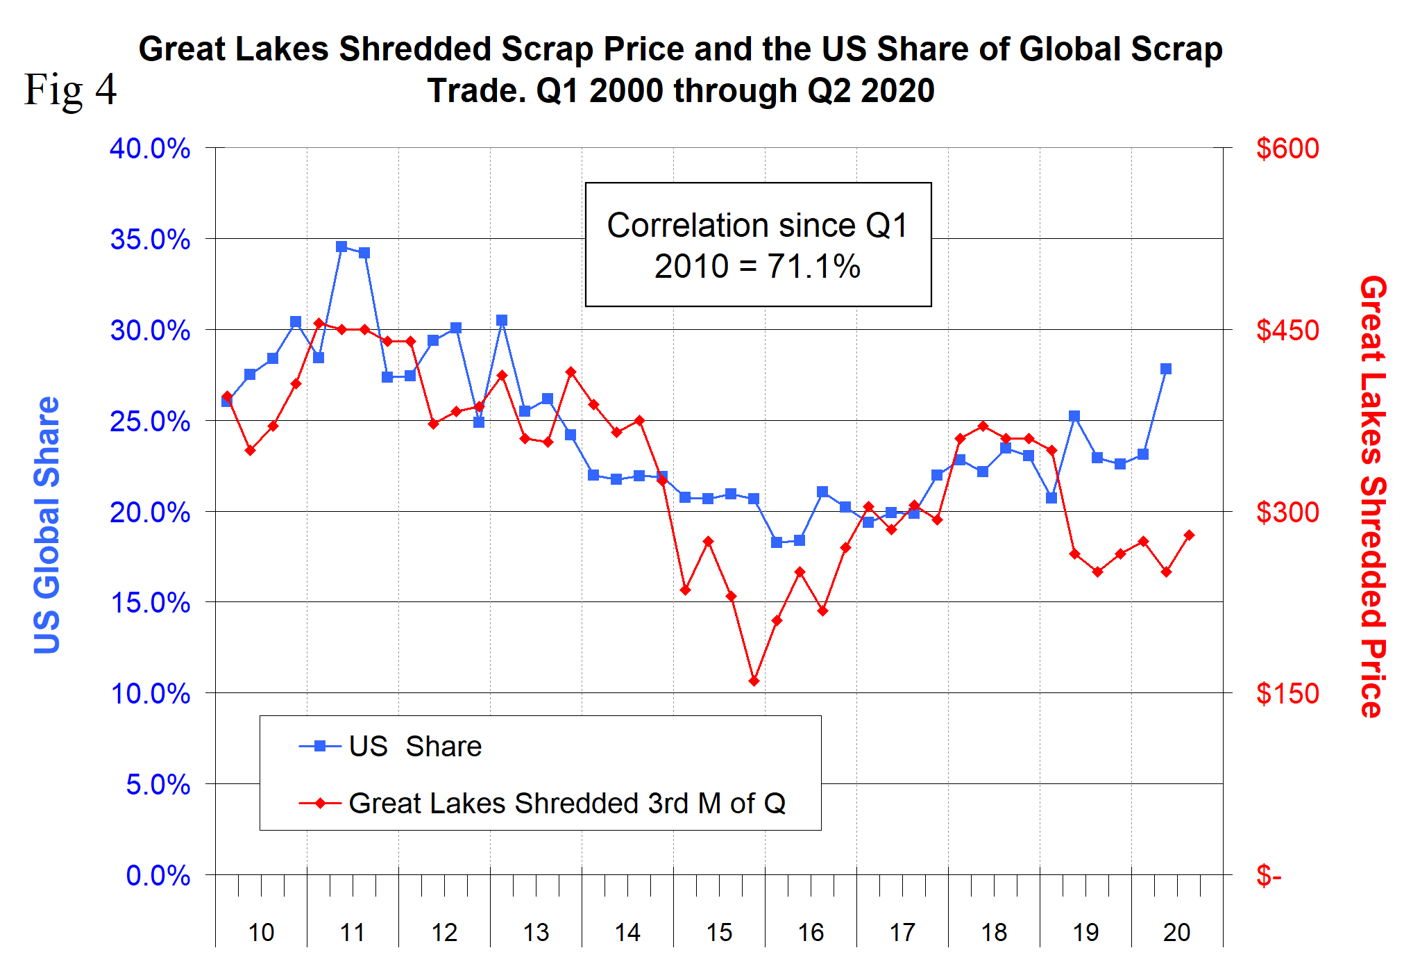
Figure 4 shows the correlation of 71.1 percent since 2010 between the U.S. share of global scrap trade and the domestic scrap price. This relationship has decoupled since Q1 2019.
There used to be a negative correlation between the Broad Index value of the U.S. dollar and the U.S. share of global trade as shown in Figure 5. When the dollar strengthens, U.S. scrap on the global market becomes more expensive and the U.S. share should decline. Prior to Q4 2014 this was the case and there was a negative 71 percent correlation between the U.S. dollar and U.S global share. Since then the two have decoupled.
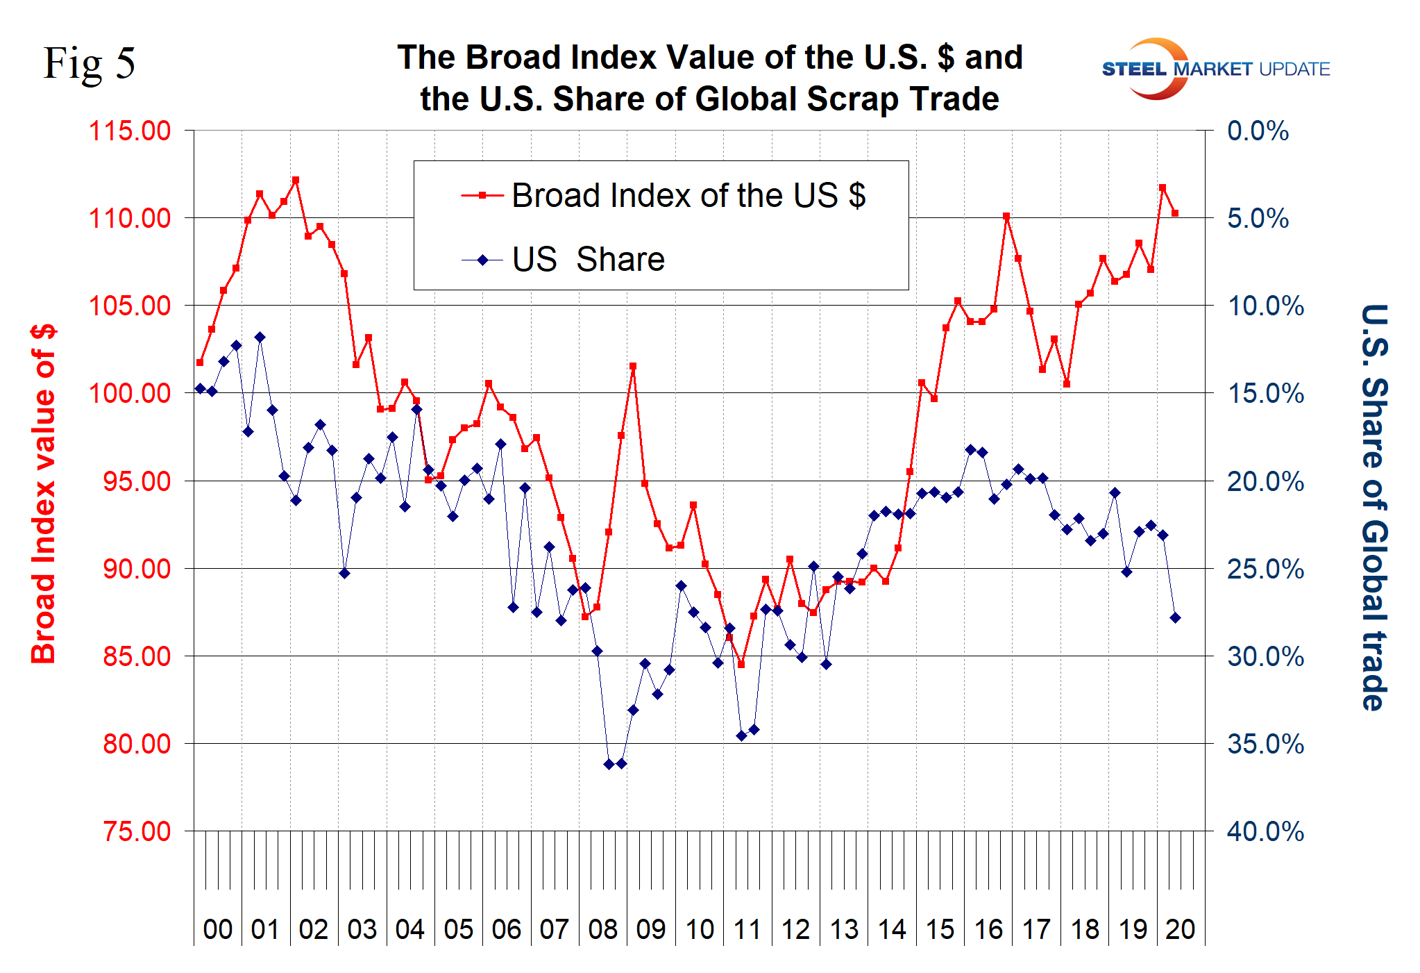
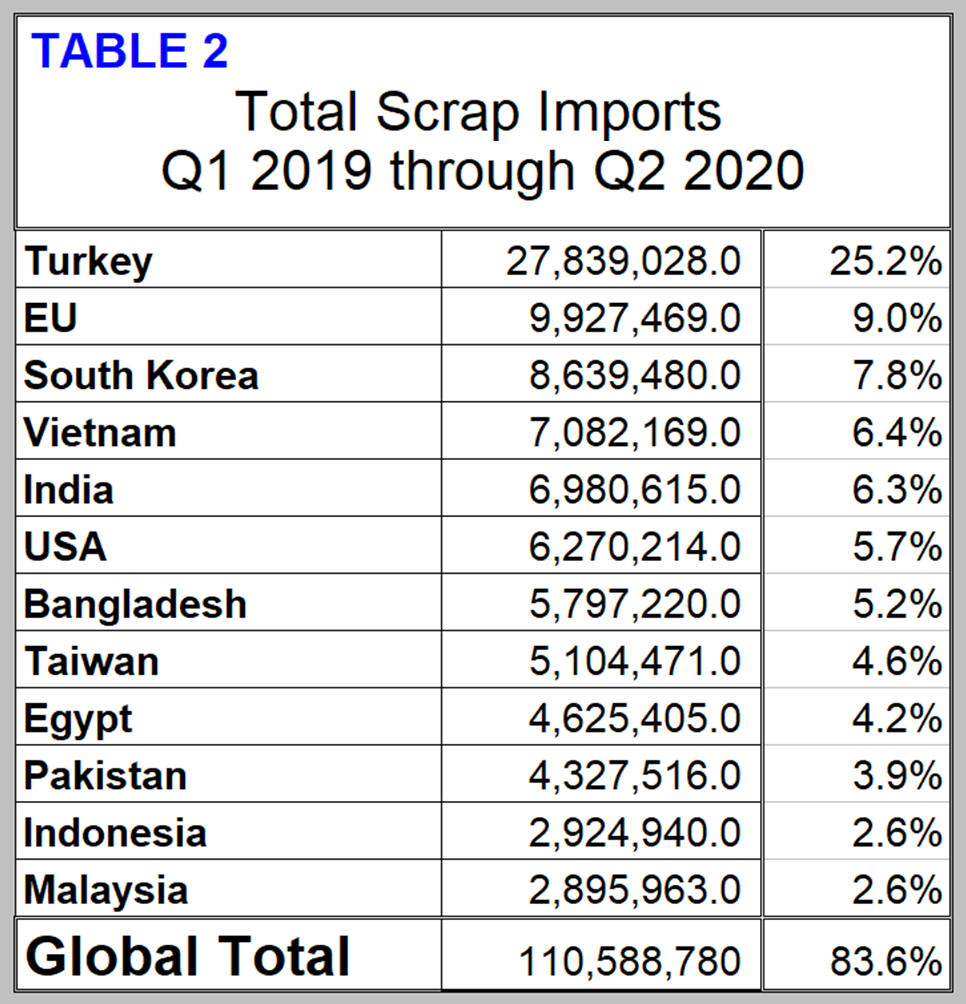
Table 2 summarizes the highest 11 volume importing nations plus the EU as a block. This group accounts for 83.6 percent of total global trade.
The tonnage received by the four major importing nations is shown in Figure 6. Turkey is by far the largest global scrap buyer and in most quarters since Q1 2010 has been in the range of 4-5 million metric tons per quarter. The growth of Vietnam is clearly shown since Q4 2006 to the point that in Q2 2020, Vietnamese imports accounted for 7.8 percent of total global scrap trade.
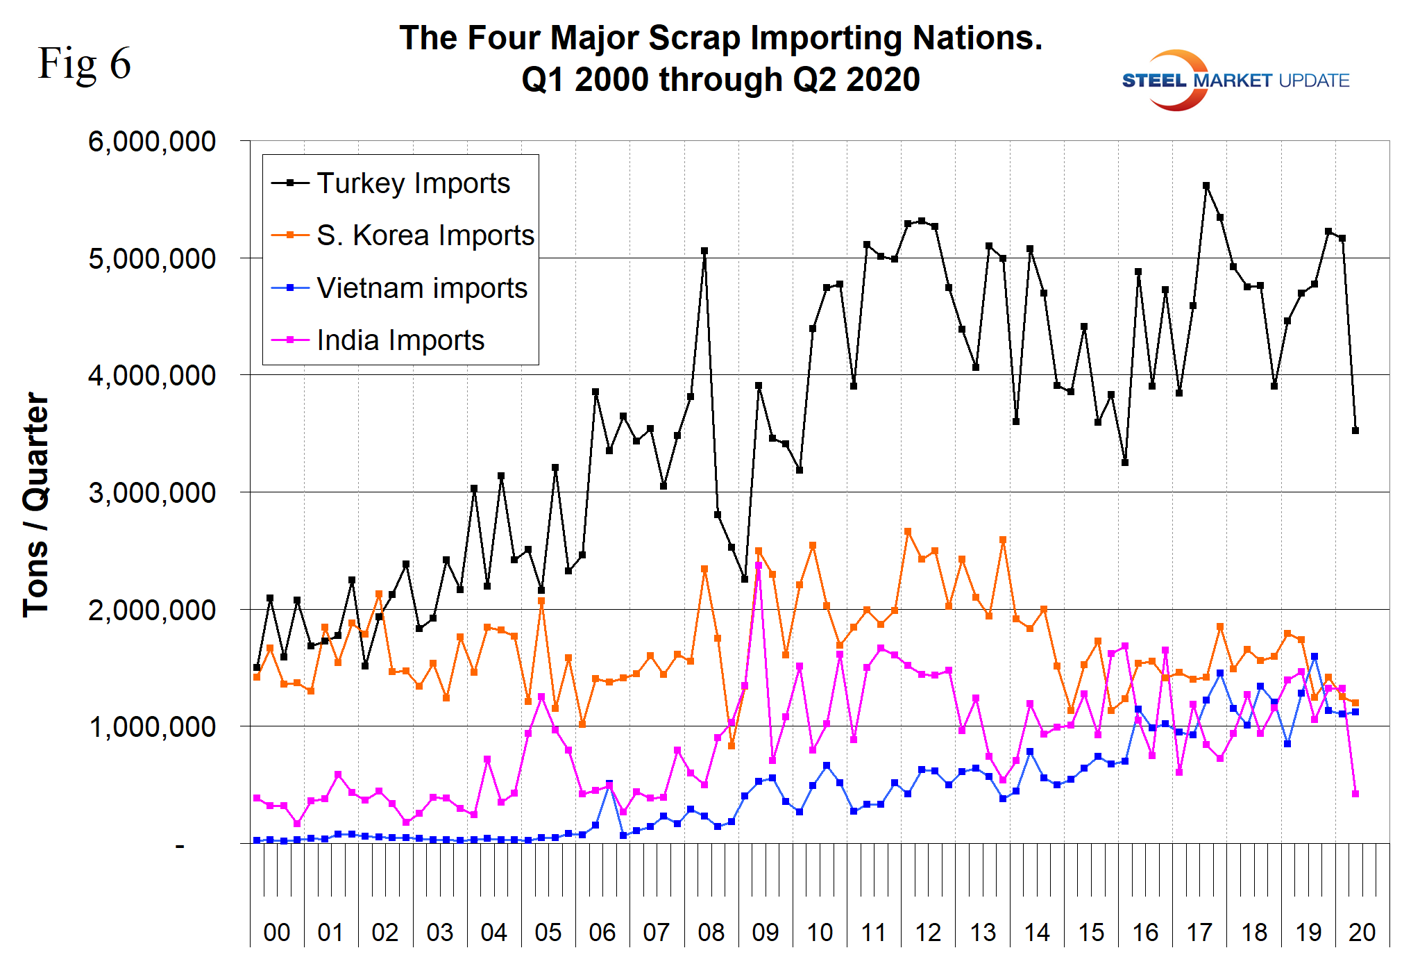
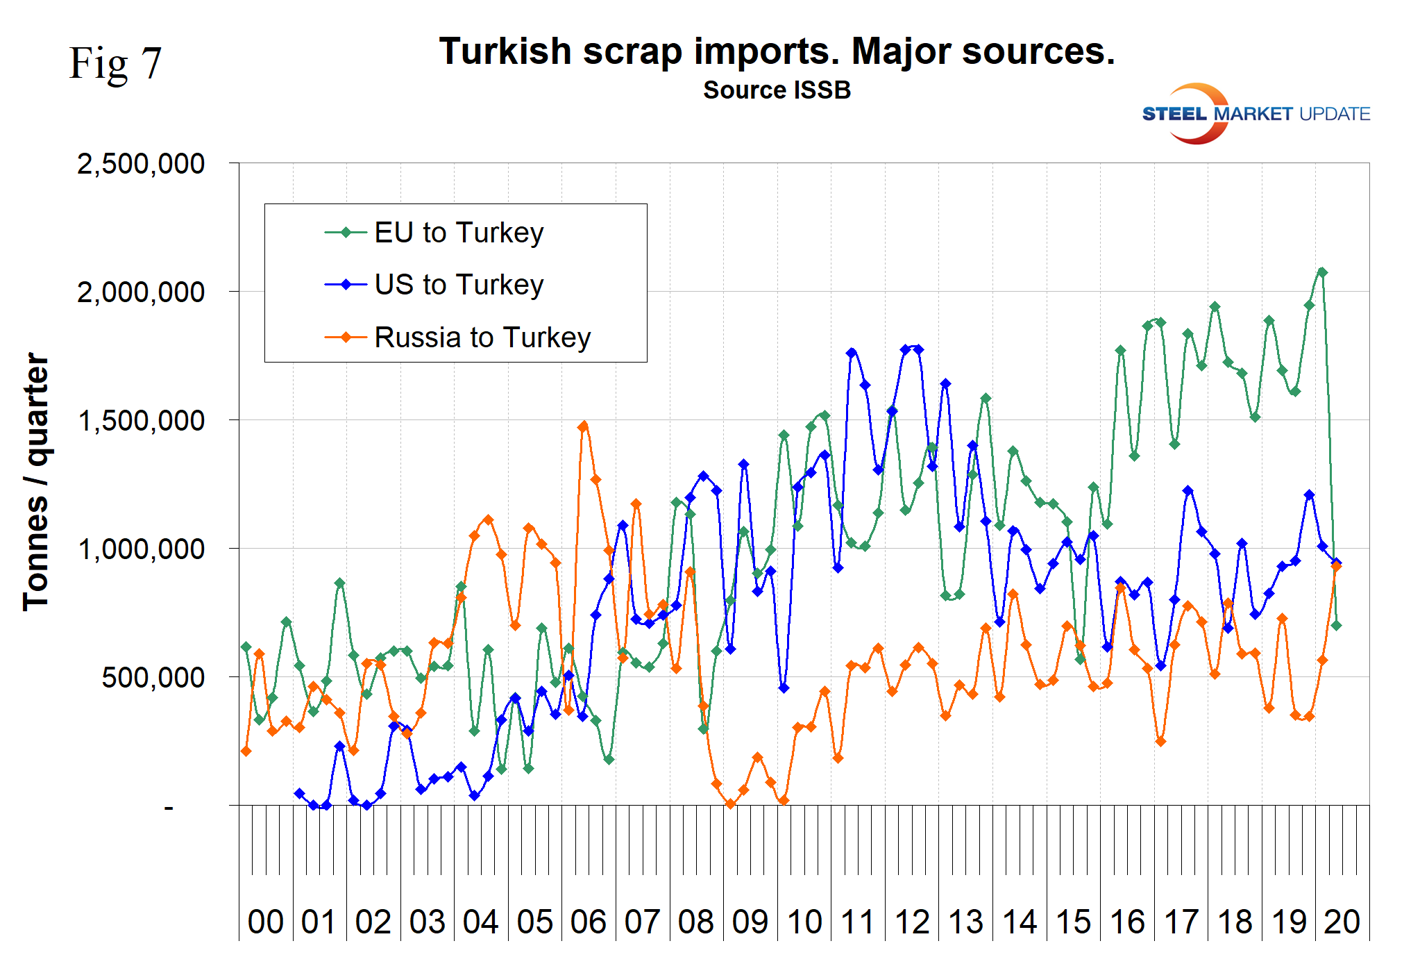
Figure 7 quantifies the volume of the three major scrap suppliers to Turkey since the year 2000. The EU’s shipments to Turkey declined by 66.2 percent in Q2 2020. The U.S. tonnage to Turkey declined by 6.6 percent, but the volume out of Russia increased by 64.6 percent.