

Market Data

November 9, 2020
Consumer Confidence: Mixed Bag in October
Written by David Schollaert
After declining drastically earlier in the year due to the onset of COVID-19, U.S. consumer confidence has improved, but still has a way to go. Following increases in August and September, the composite value of consumer confidence, as reported by The Conference Board, slipped slightly in October to 100.9, down from 101.8 the month prior.
The three-month moving average (3MMA) rose to 96.2, due in part to the increase in September, but remains a far cry from the 130.4 seen in February. This indicator is quite volatile; therefore, the moving average is used to reduce monthly variability.
“Consumer confidence declined slightly in October, following a sharp improvement in September,” said Lynn Franco, Senior Director of Economic Indicators at The Conference Board. “Consumers’ assessment of current conditions improved while expectations declined, driven primarily by a softening in the short-term outlook for jobs. There is little to suggest that consumers foresee the economy gaining momentum in the final months of 2020, especially with COVID-19 cases on the rise and unemployment still high.”
The composite index is made up of two sub-indexes: the consumer’s view of the present situation and his or her expectations for the future. The 3MMA of the consumer’s view of the present situation dropped from 171.2 in February to a low of 76.0, but has since recovered to 96.4 in October. Expectations were less dramatically affected by the pandemic and declined from 103.2 in February to 96.0 in October, also on a 3MMA basis. Figure 1 shows the trend lines of both subcomponents. The view of the present situation has collapsed below trend, but expectations remain slightly above. Expectations have been declining since November 2018 (Figure 1).
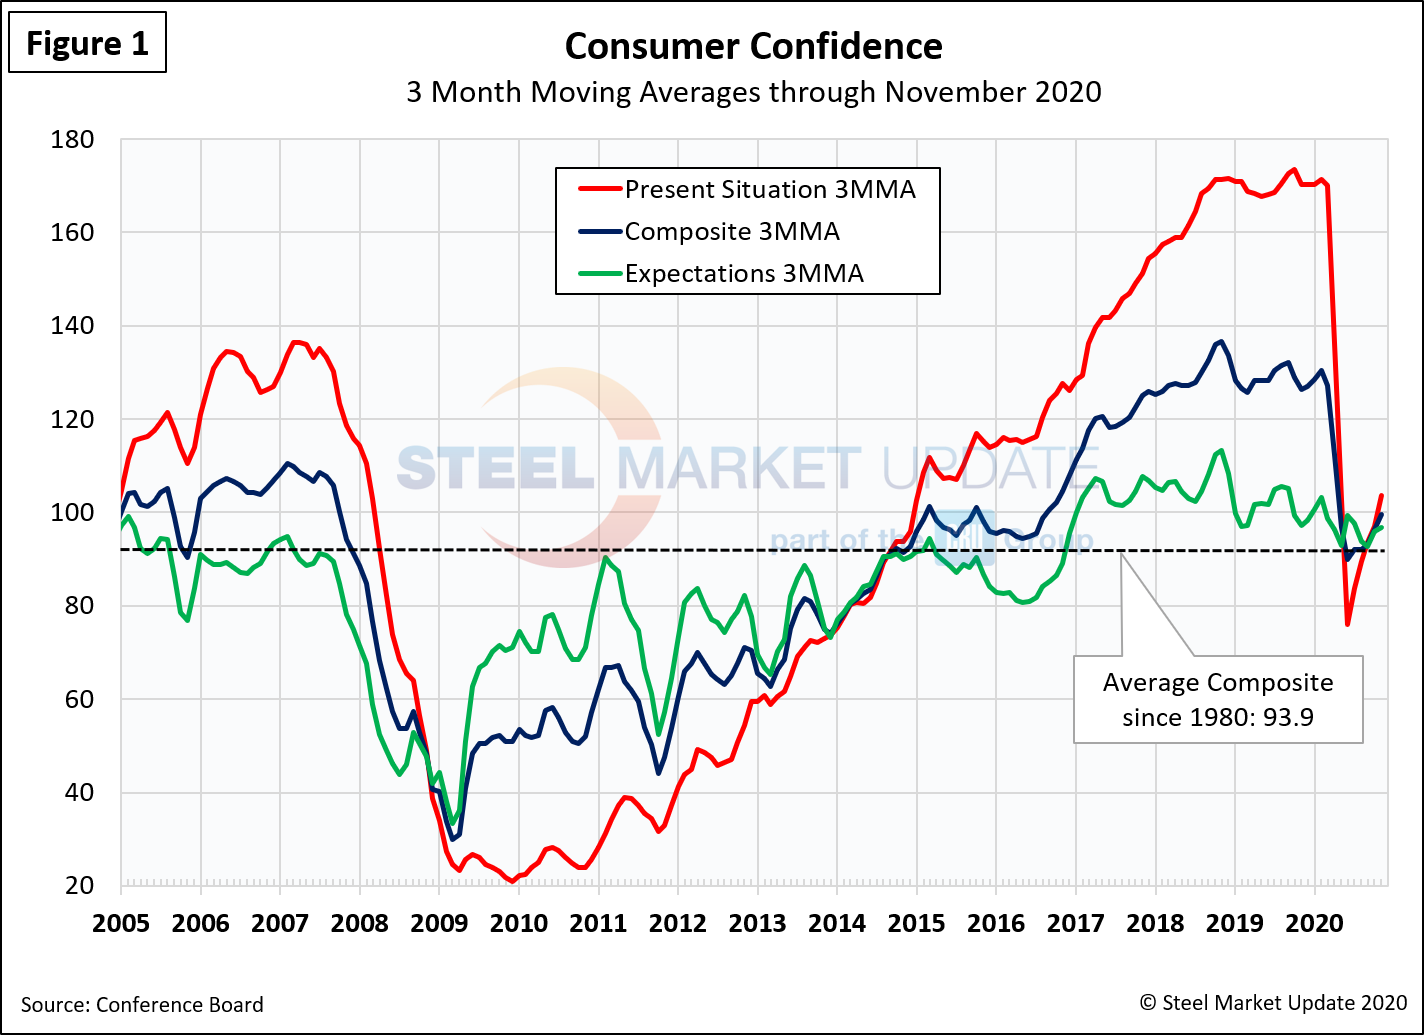
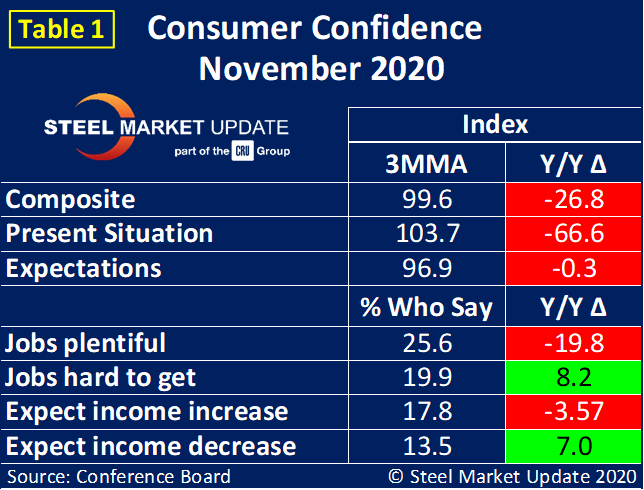
On a 3MMA basis comparing October 2020 with October 2019, the present situation was down by 76.9 points and expectations were down by 3.3 point points (Table 1). The consumer confidence report also includes both employment data and some purchase plans and these are summarized in Table 1. The color codes show improvement or deterioration of the individual components.
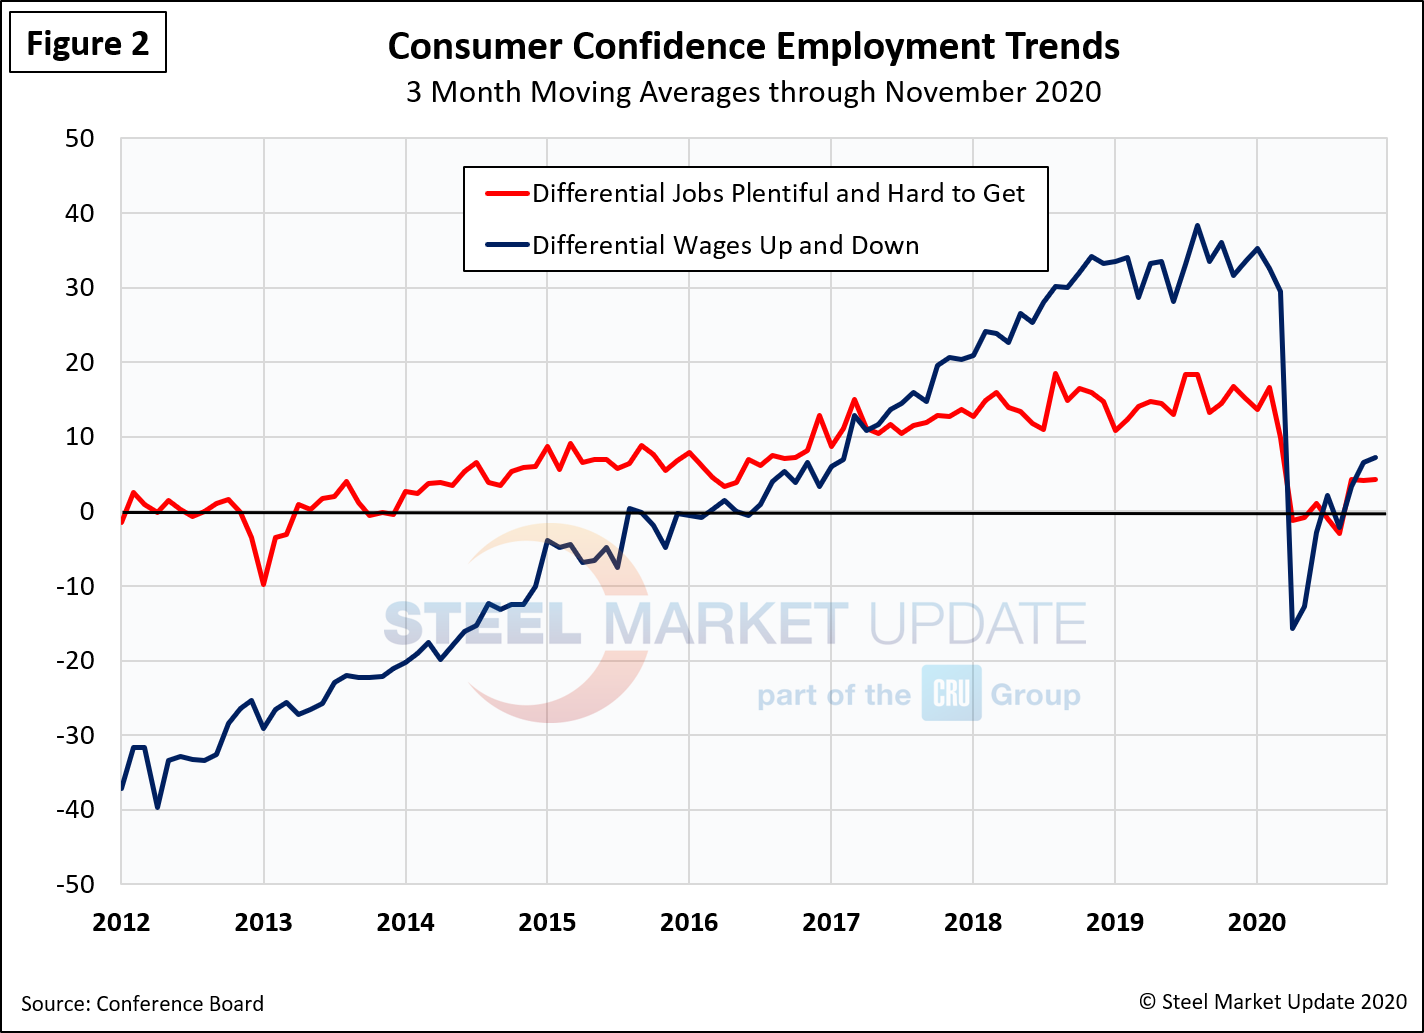
In October last year, the differential between those finding jobs plentiful and those having difficulty was positive 36.1, but that fell to negative 15.7 in April and improved to positive 6.6 in October (Figure 2). Expectations for future wage change were similarly affected. In October last year, the differential was positive 14.5 and in October of this year was positive 4.2.
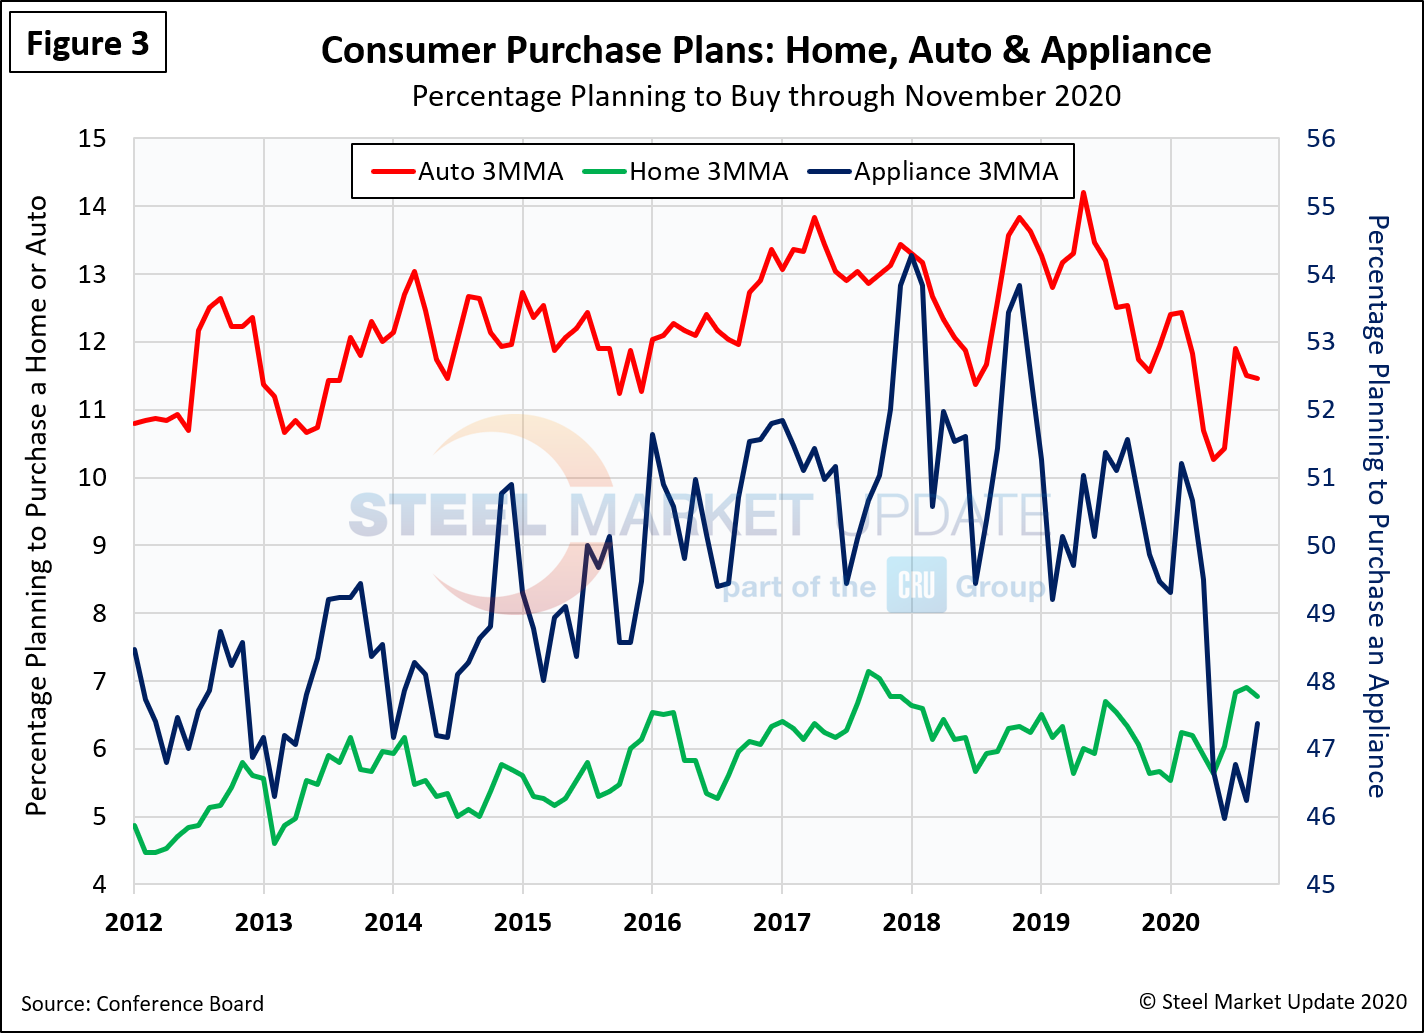
The trend across spending plans for consumer goods as measured by automobiles and appliances has seen a similar outcome–some positive improvements over the past two consecutive months, but behind pre-pandemic levels (Figure 3). This a continued indication that buyers are still largely taking a cautious approach in regard to spending on consumer goods.
SMU Comment: Consumer confidence has improved some over the past couple of months, but still pales in comparison with year-ago levels due to ongoing concern over the COVID pandemic. Improved consumer confidence, albeit tempered, has aided the recovery in steel demand, which is dependent on the growth of GDP and consumers’ willingness to spend. Consumer confidence should be treated as a leading indicator in steel industry corporate planning.
About The Conference Board: The Conference Board is a global, independent business membership and research association working in the public interest. The monthly Consumer Confidence Survey®, based on a probability-design random sample, is conducted for The Conference Board by Nielsen. The index is based on 1985 = 100. The composite value of consumer confidence combines the view of the present situation and of expectations for the next six months.


