

Market Data

December 9, 2020
Global Steel Production Through October
Written by Peter Wright
Data from the World Steel Association through October shows how much global crude steel production has recovered from the worst of the pandemic earlier in the year.
Figure 1 shows annualized monthly global steel production on a three-month moving average (3MMA) basis and capacity utilization since January 2000 based on capacity data from the OECD. Capacity utilization in October on a 3MMA basis was 80.9 percent. On a tons-per-day basis, production in October was 5.222 million metric tons. This was the third highest month ever following the record in June 2019 and September 2020. June 2019’s all-time high was 5.318 million metric tons.
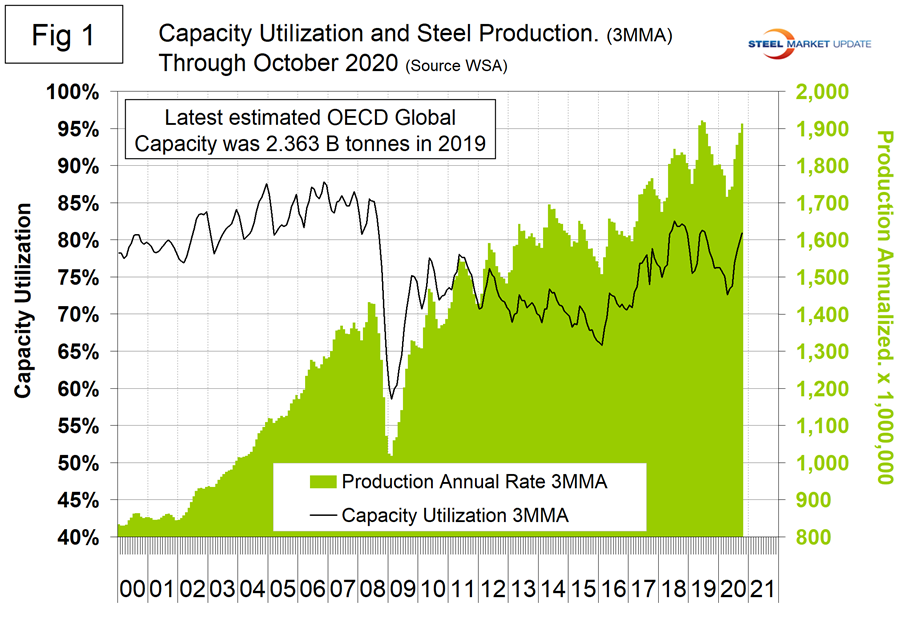
Figure 2 shows the year-over-year growth rate of the 3MMA of global production since January 2013. Growth in three months through October on a year-over-year basis was positive 4.5 percent, up each month from negative 9.2 percent in June.
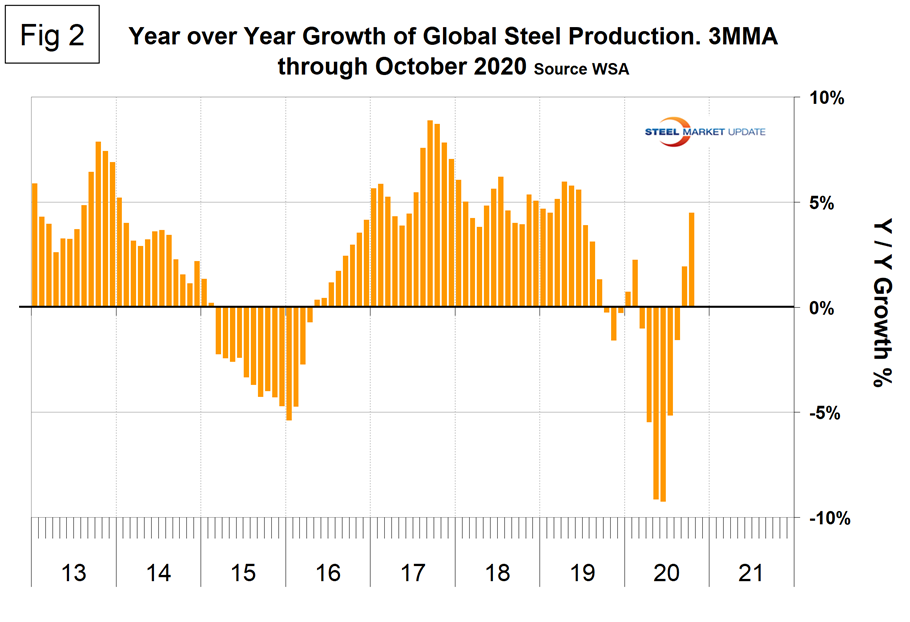
Table 1 shows global production broken down into regions, the production of the top 10 nations in the single month of October, and their share of the global total. It also shows the latest three months and 12 months of production through October with year-over-year growth rates for each period. Regions are shown in white font and individual nations in beige. The world overall had positive growth of 4.5 percent in three months and negative 1.4 percent in 12 months through October. When the three-month growth rate is higher than the 12-month growth rate, as it was in October, we interpret this to be a sign of positive momentum. On the same basis in October, China grew by 11.2 percent and 6.0 percent, therefore also had positive momentum. Table 1 shows that North America was down by 15.3 percent in the three months through October. Within North America, production was down by 16.6 percent in the U.S., down by 24.4 percent in Canada and down by 2.0 percent in Mexico (Canada and Mexico are not shown in Table 1 and the North American total includes Cuba, El Salvador and Guatemala).
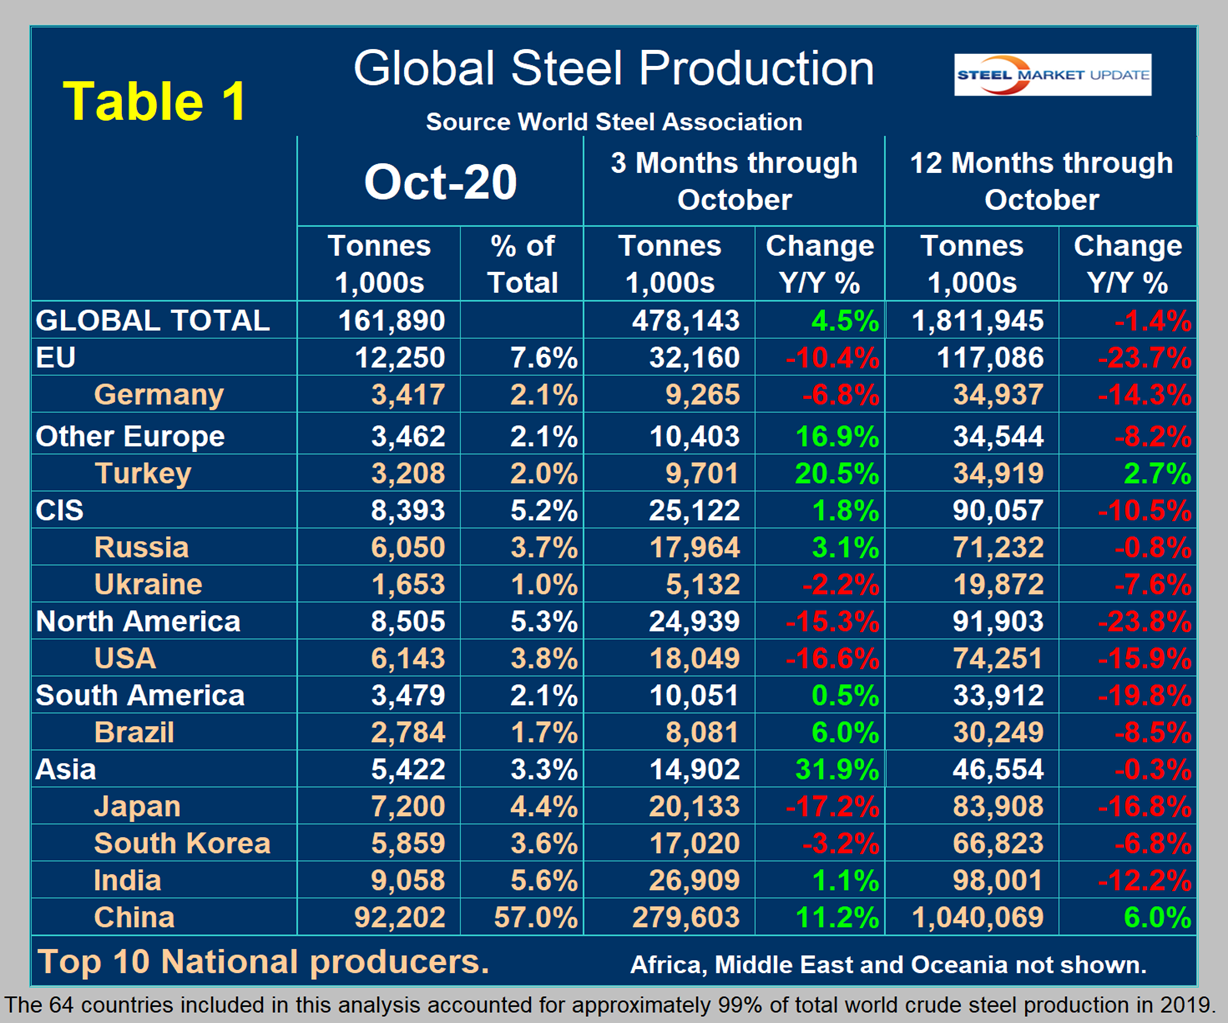
In the 12 months through October, 102.2 million metric tons were produced in North America of which 74.3 million tons were produced in the U.S., 11.0 million tons in Canada and 16.5 million tons in Mexico. Based on the latest data from the OECD, U.S. capacity in 2019 was 109.7 million metric tons and capacity utilization in that year was 80.0 percent.
Figure 3 shows China’s production since 2005. In the single month of August, China’s steel production hit an all-time high of 94.8 million tons. Production declined in October to 92.2 million tons. China’s capacity is now 1.152 billion metric tons, a reduction from 1.215 billion tons in January 2015. October capacity utilization was 92.2 percent, which as a result of the capacity reduction and production increases was up from 67.3 percent in January 2015.
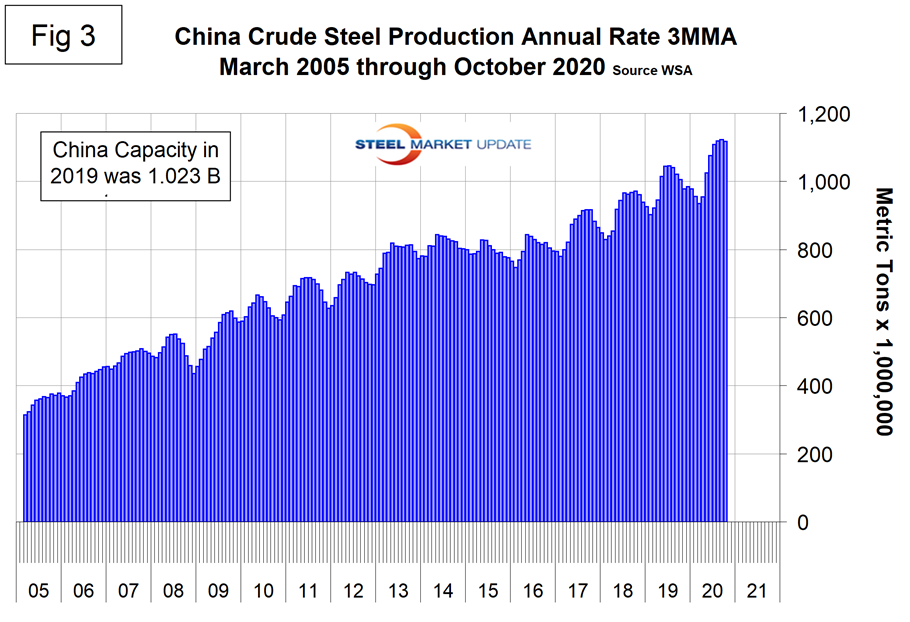
Figure 4 shows the growth of China’s steel production since March 2013 and Figure 5 shows the growth of global steel excluding China, both on a 3MMA basis. In August through October, the rest of the world’s production expanded by 0.2 percent as China grew by 11.2 percent year over year. This was a turnaround for the rest of the world, which contracted by 4.7 percent in three months through September. Turkey and Brazil were the main drivers of this increase as other nations contracted more slowly.
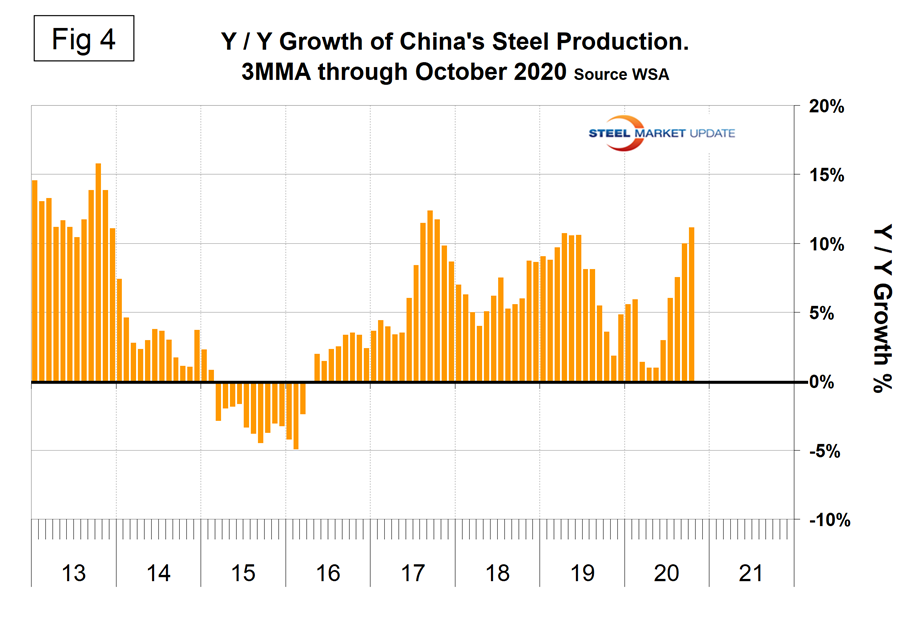
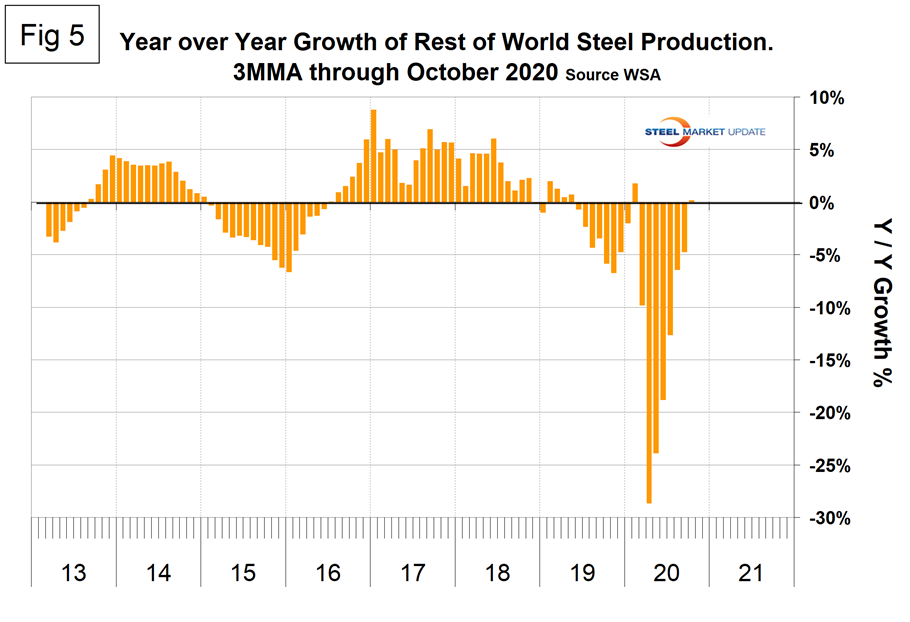
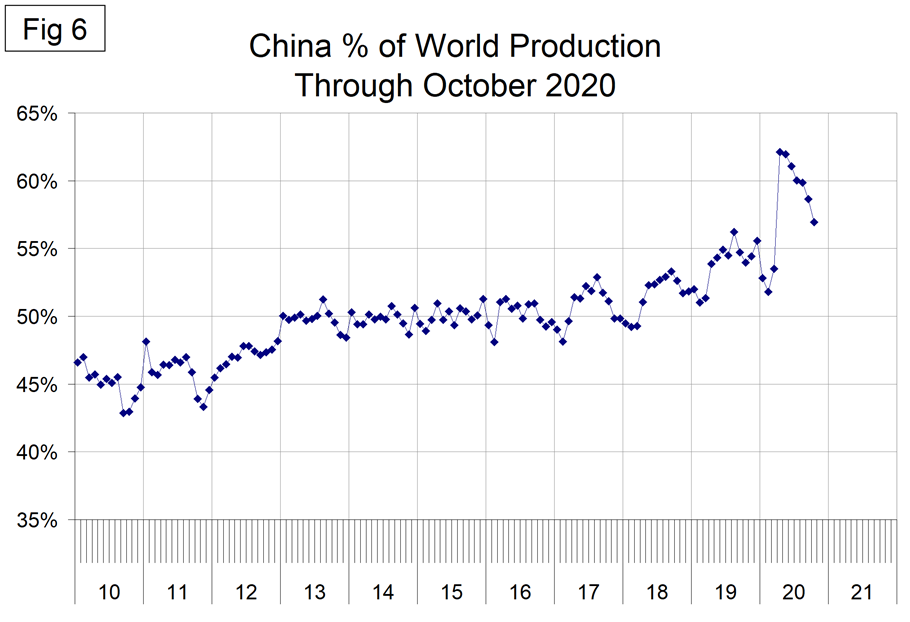
Figure 6 shows China’s share of global steel production, which in the single month of October was 57.0 percent.
Notes: WSA released their short range forecast on June 4, 2020. They anticipate that global production will be down by 6.4 percent in 2020, but up by 3.8 percent in 2021. On the same basis, North America will be down by 20.0 percent and up by 6.2 percent. WSA represents approximately 85 percent of the world’s steel production, including over 160 steel producers, national and regional steel industry associations, and steel research institutes. The OECD has taken over responsibility for tracking global steel capacity, and their latest update was for 2019, released in June 2020.


