

Market Data

February 23, 2021
Shipments and Supply of Steel Products through December
Written by David Schollaert
Mill shipments and supply of sheet products rose by nearly 6.5% month on month in December, a positive close to 2020. Plagued earlier on by COVID, sheet shipments stalled in last year’s second quarter. After reaching bottom in June, they have climbed steadily since.
This analysis is based on steel mill shipment data from the American Iron and Steel Institute (AISI) and import-export data from the U.S. Department of Commerce (DOC). The analysis summarizes total steel supply by product from 2008 through December 2020 and year-on-year changes. The supply data is a proxy for market demand, which does not take into consideration inventory changes in the supply chain. Our analysis compares domestic mill shipments with total supply to the market. It quantifies market direction by product and enables a side-by-side comparison of the degree to which imports have absorbed demand.
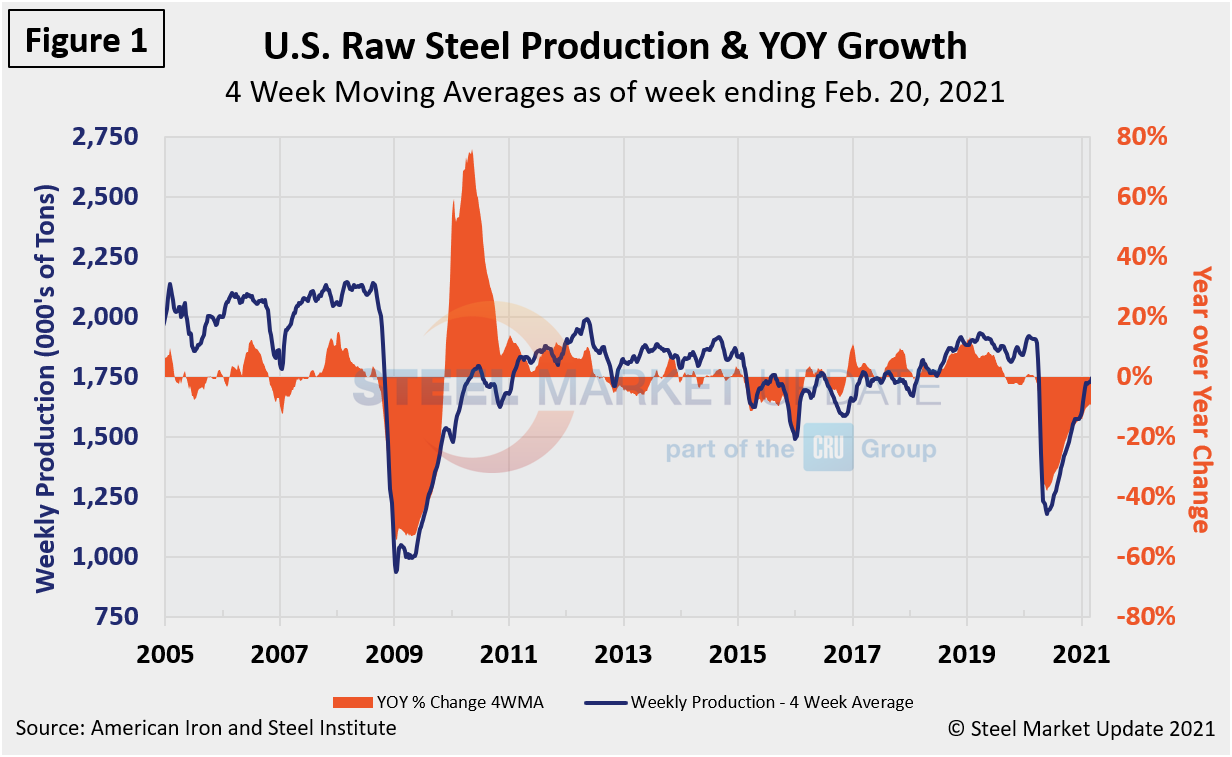
Despite the added lift in shipments and supply of steel products in December, the market remains in a corrective mode following the pandemic freefall seen in the second quarter of 2020. Presently, shipments and supply of steel products are down by 15.0% year on year; however, growing demand, overall tight supplies, and historically high HRC prices continue to prop up market sentiment and the near-term outlook. HRC prices are currently at $1,210 per ton, according to SMU’s latest check of the market. While the domestic steel sector remains resilient, the three-month moving averages (3MMAs) for shipments and supply of steel products are still well below pre-pandemic levels. Although the only comparison to the sudden decline in raw steel production that began this past February is the rate of decline experienced in late 2008 (Figure 1), that’s where the similarities end. The rebound in 2020 has been faster compared to the extended rate of recovery that followed the former financial crisis. The year-over-year decline in 2020 maxed out at negative 37.3% in the week ending May 16 and has since improved to negative 8.2% in the week ending Feb. 20. These are four-week moving averages and are based on weekly data from the AISI.
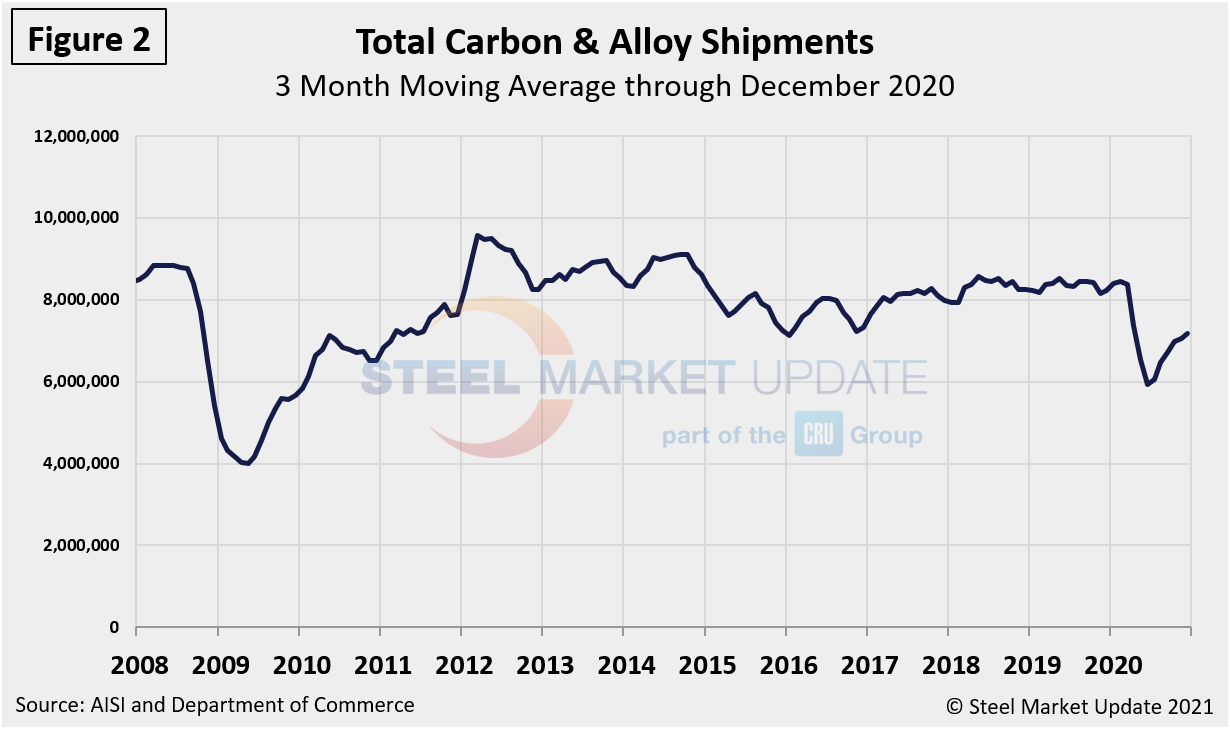
This shipments and supply report is based on monthly shipments by product as reported by the AISI, plus import and export data from the Commerce Department. Figure 2 shows the monthly shipment data for all rolled steel products. The trajectories of the rebounds since Q2 2020 are comparable in Figures 1 and 2. Measured as a three-month moving average of the monthly data, December’s total was 7,176,712 tons compared to 7,061,388 tons in November, a 1.6% increase month on month. While the rebound remains on an upward trajectory, monthly shipments are still down 12.7% from year-ago totals of 8,220,141 tons.
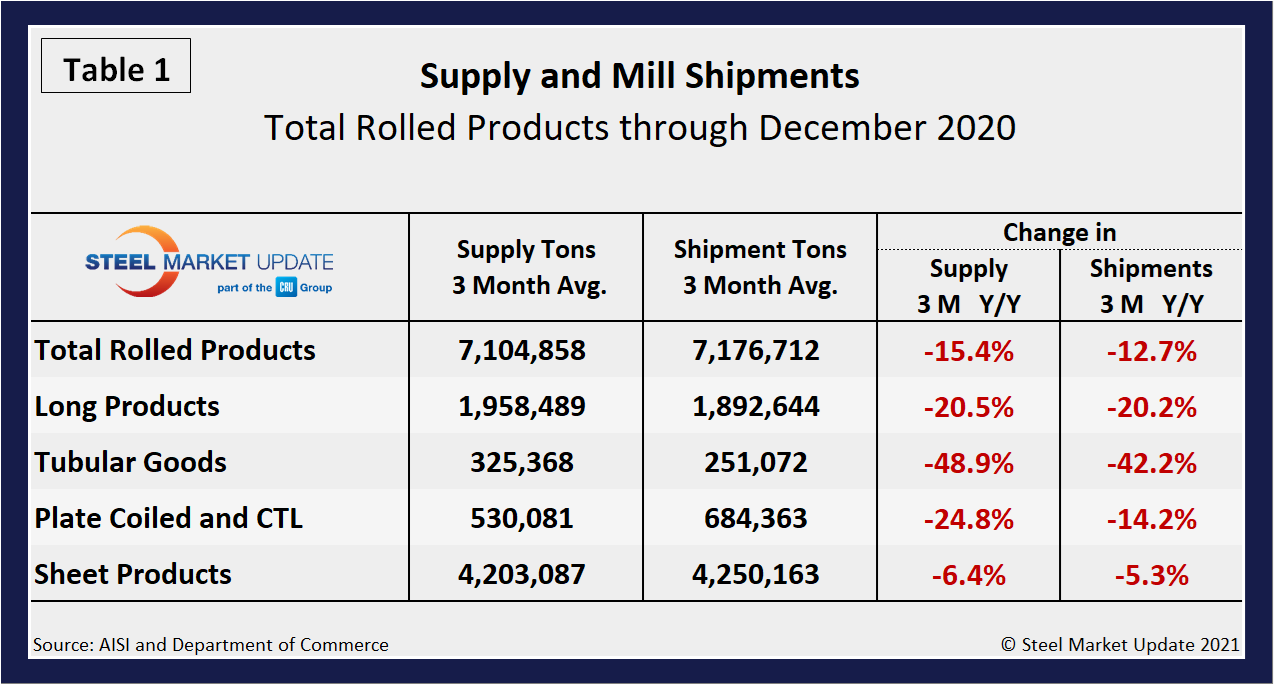
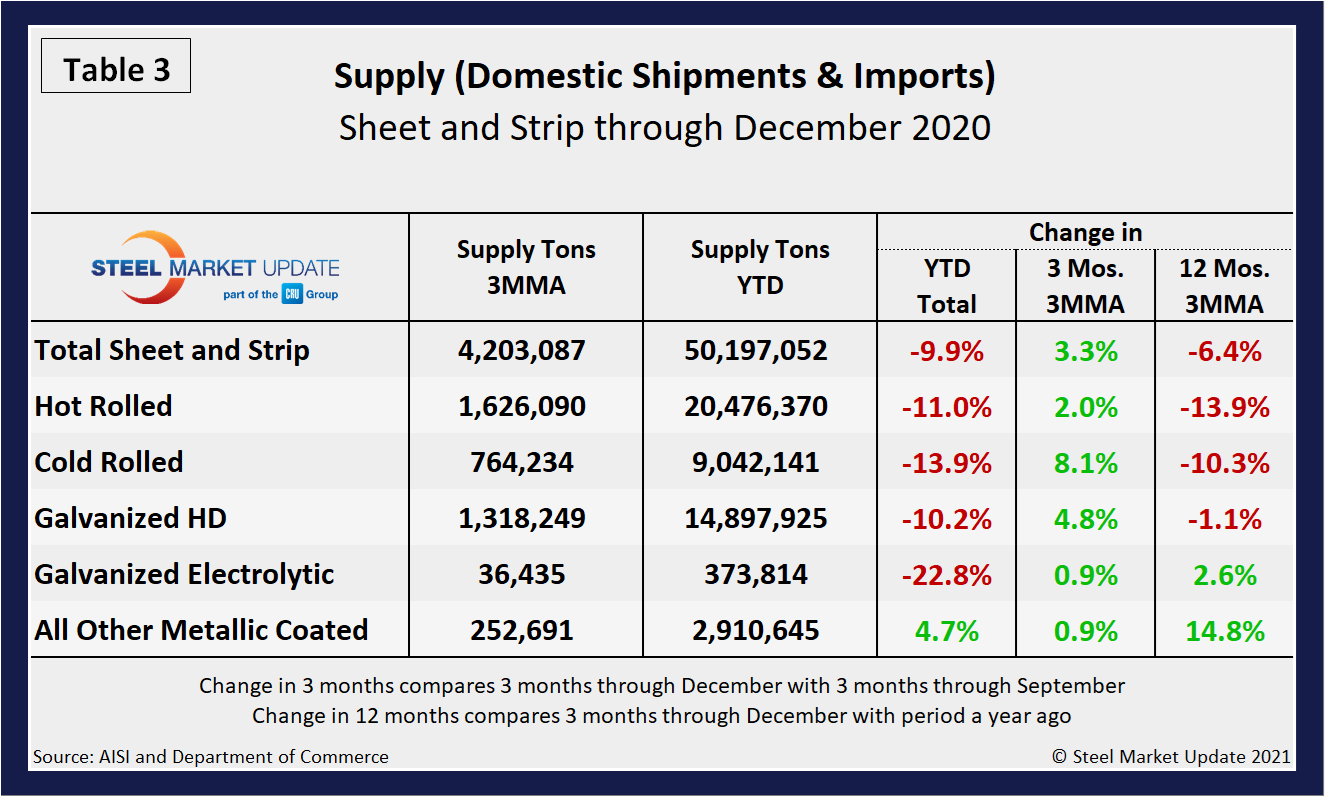
Shipment and supply details for all product groups are noted in Table 1, followed by individual sheet products in Table 2, and domestic supply (shipments and imports) in Table 3. Total supply (proxy for market demand) as a 3MMA was down by 15.4% year over year in December 2020, but up from negative 17.5% reported the month prior and negative 28.1% in June when the market reached bottom. Apparent supply is defined as domestic mill shipments to domestic locations plus imports. Mill shipments improved to a negative 12.7% in December, compared to a negative 13.4% in November and a negative 29.1% in June. Additionally, although imports still took a noticeable market share in the three months through December year-over-year; they have waned since late Q2. There is still a major variance between products. Even though a decline across all products was seen, tubular products continue to be the most affected at a negative 48.9% and negative 42.2% for supply and shipments, respectively.
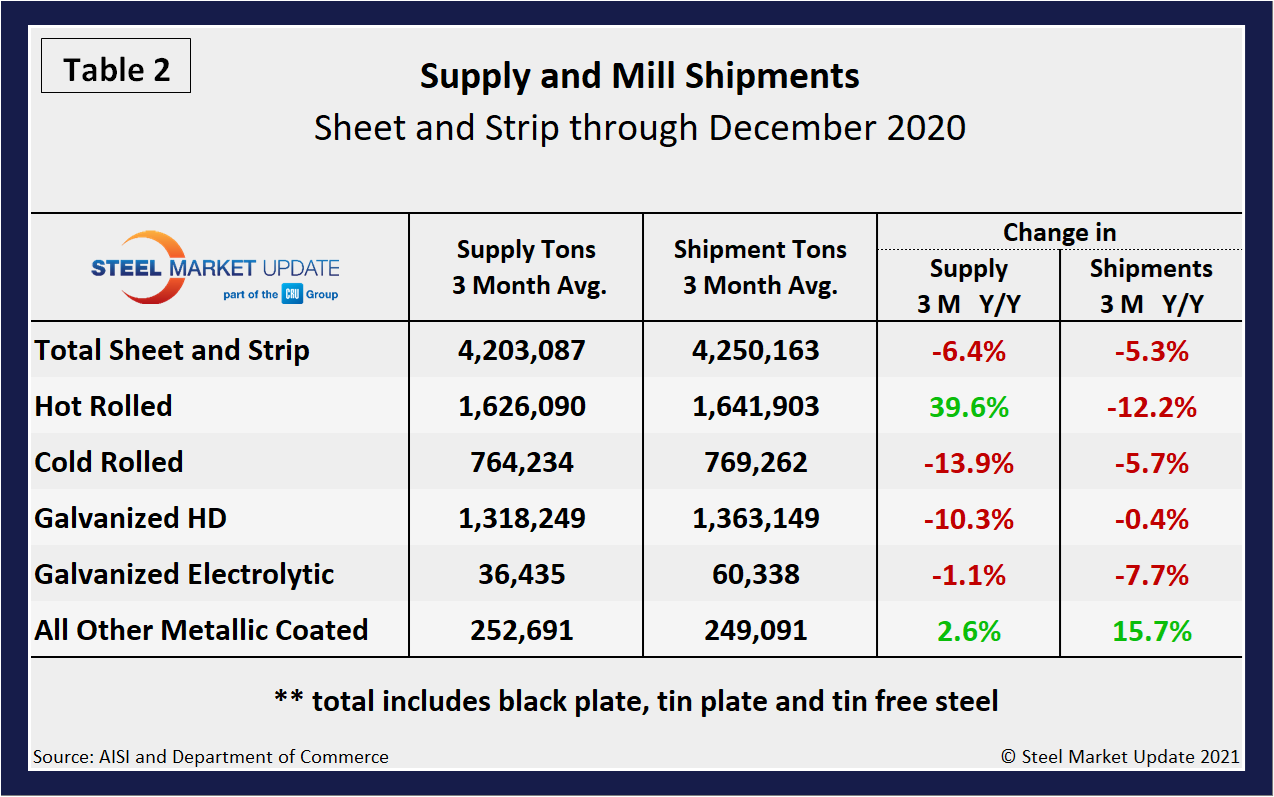
Overall sheet product shipments are down (Table 2), however, hot rolled has really taken off over the past couple of months, reaching 39.6% growth. In the three months through November 2020, the average monthly supply of sheet and strip was 4.203 million tons, down from 4.491 million tons the year prior. Note that year-over-year comparisons have seasonality removed. Total sheet and strip product shipments were down by 9.9% year to date (Table 3) compared to 2019, but up slightly by 0.4% month on month (not shown in Table 3). Sheet products were down year to date, except for other metallic coated, which was up 4.7% compare to December 2019. As a 3MMA, however, it’s important to note that all products have continued to turn, in some cases, markedly. Despite the near collapse in Q2, data continues to support the improving market sentiment.
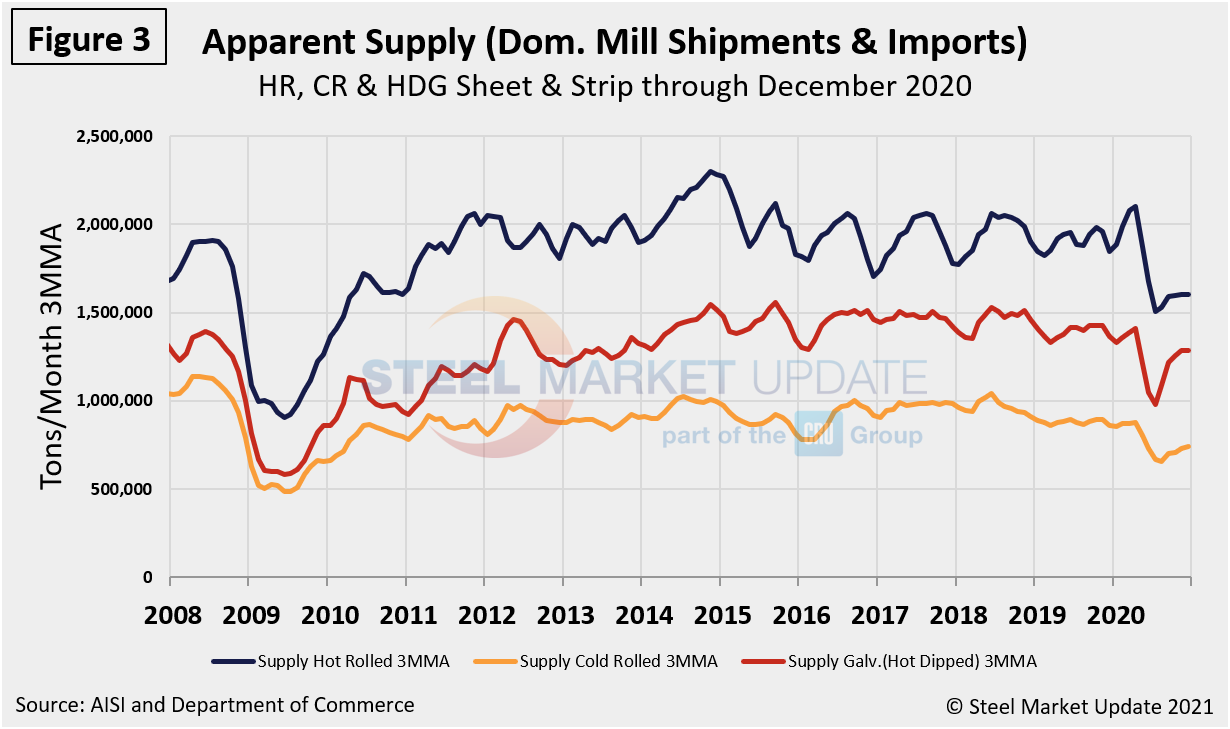
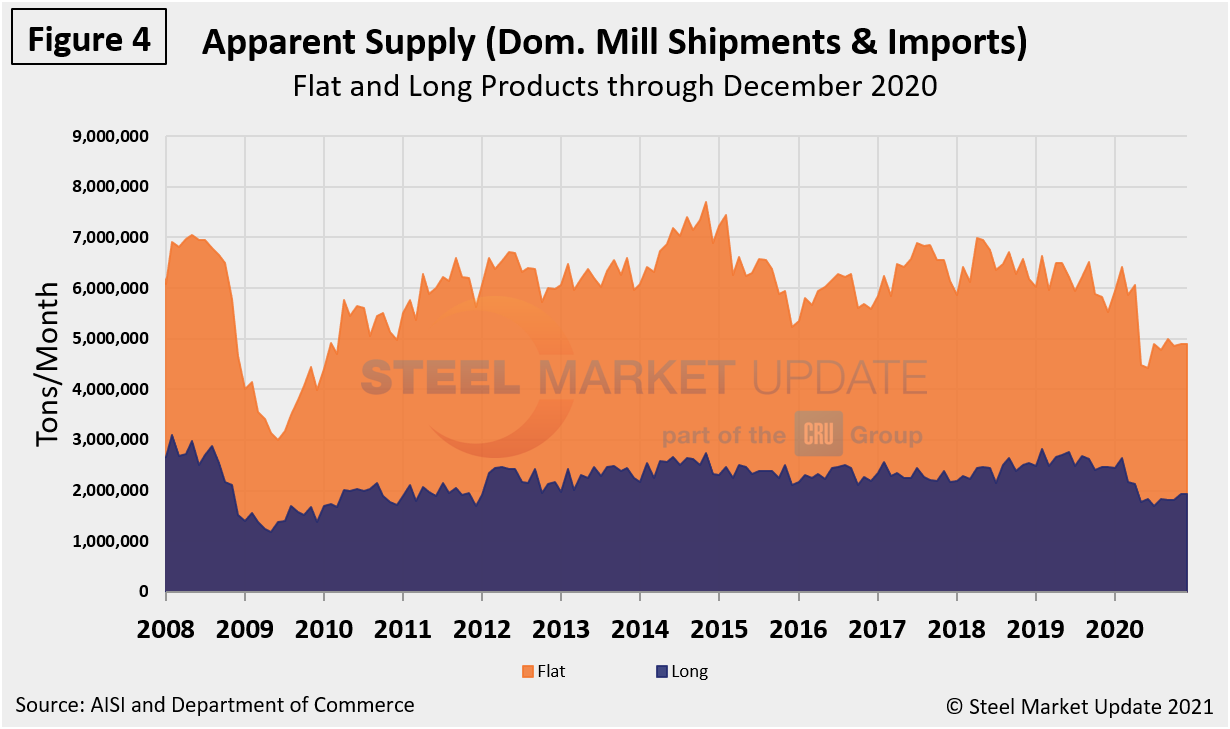
The long-term supply picture for HRC, CRC and HDG since August 2008 as three-month moving averages in Figure 3 and Figure 4 show the long-term comparison between flat and long products. All three sheet products have experienced some improvement since mid-2020, but hot-dipped galvanized has seen a 34.8% jump since reaching bottom this past June. In Figure 4, note that these are monthly numbers (not 3MMAs), and clearly show the trend difference between longs and flat products including plate.
By David Schollaert, David@SteelMarketUpdate.com


