

Market Data

February 24, 2021
February Consumer Confidence Data: Watchful But Hopeful
Written by David Schollaert
The latest consumer confidence data from The Conference Board indicates that consumers remain cautiously optimistic about the economy. February consumer confidence data showed gains across most inputs; however, the survey results were gathered prior to the Texas power crisis resulting from the recent winter storm and could paint a partial picture of current sentiment. Nevertheless, there are some encouraging trends that should reflect prevailing business conditions and potential developments for the upcoming months.
“After three months of consecutive declines in the Present Situation Index, consumers’ assessment of current conditions improved in February,” said Lynn Franco, Senior Director of Economic Indicators at The Conference Board. “This course reversal suggests economic growth has not slowed further. While the Expectations Index fell marginally in February, consumers remain cautiously optimistic, on the whole, about the outlook for the coming months. Notably, vacation intentions—particularly, plans to travel outside the U.S. and via air—saw an uptick this month, and are poised to improve further as vaccination efforts expand.”
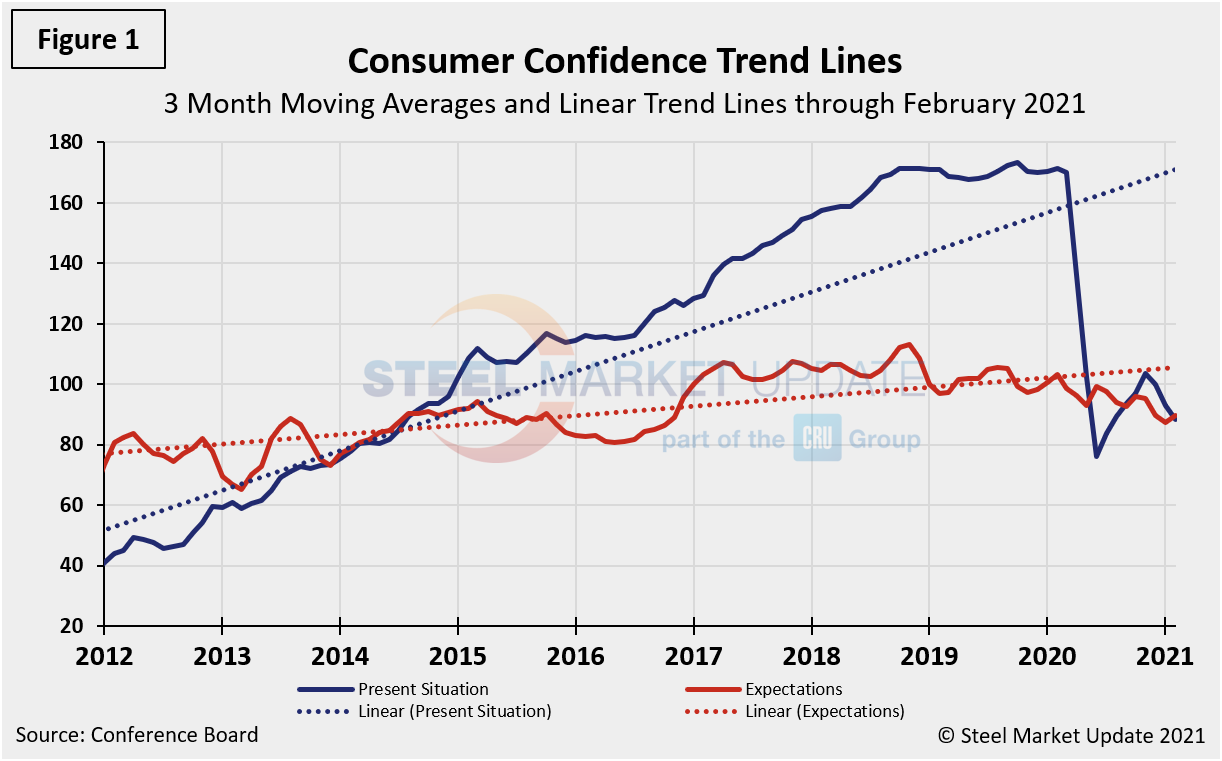
The Conference Board’s composite index rose in February to 91.3 from 88.9 in January. Calculated as a three-month moving average (3MMA) to smooth out the volatility, the index edged down slightly to 89.1 in February, compared to 89.6 in January, both well below the pre-pandemic high of 130.4 year on year.
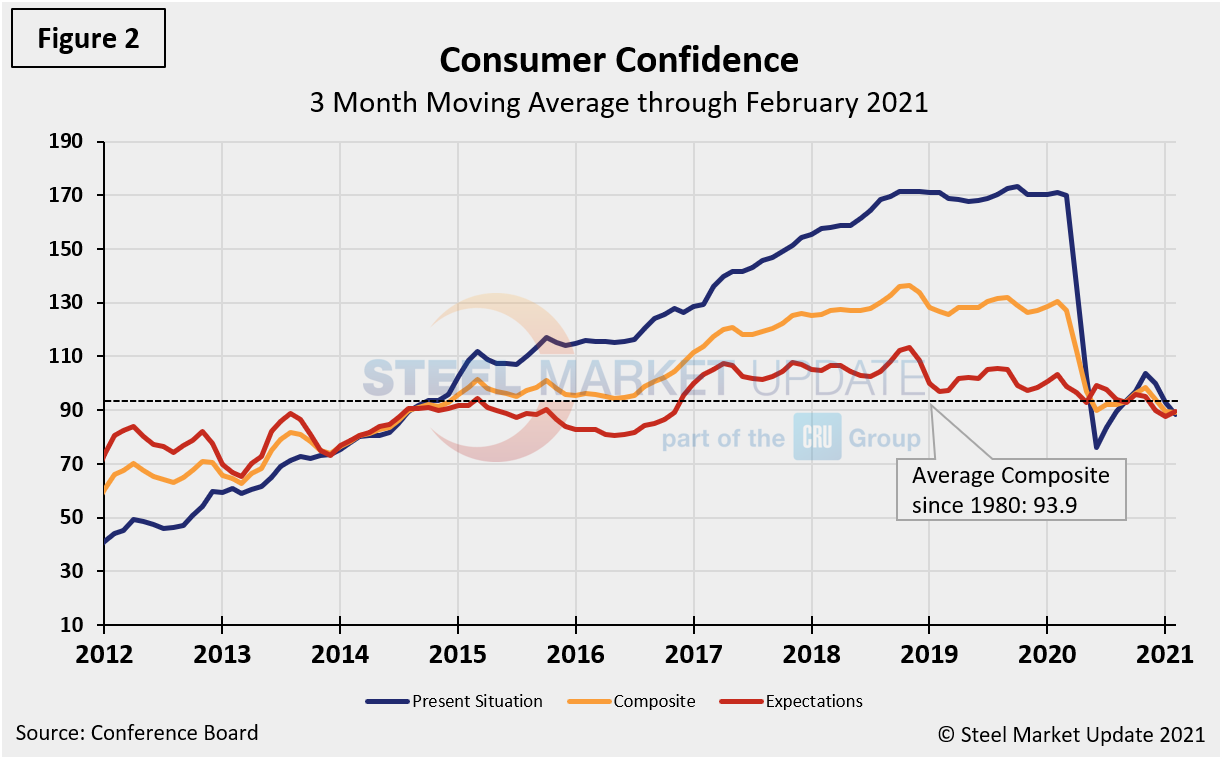
The composite index is made up of two sub-indexes: the consumer’s view of the present situation and his or her expectations for the future. Figure 1 notes the 3MMA linear trend lines from January 2012 through January 2021. Recent dips indicate that consumers are hopeful yet still uncertain as the future remains cloudy. It may also indicate many are encouraged that the disparity of 2020 could be viewed as an isolated “event” with the market returning to pre-pandemic growth over the long haul. The trend lines of all three subcomponents of the index: the present situation, the composite and future expectations are displayed in Figure 2. All three had edged above the average composite line in October 2020, but have all been on a three-month downturn since.
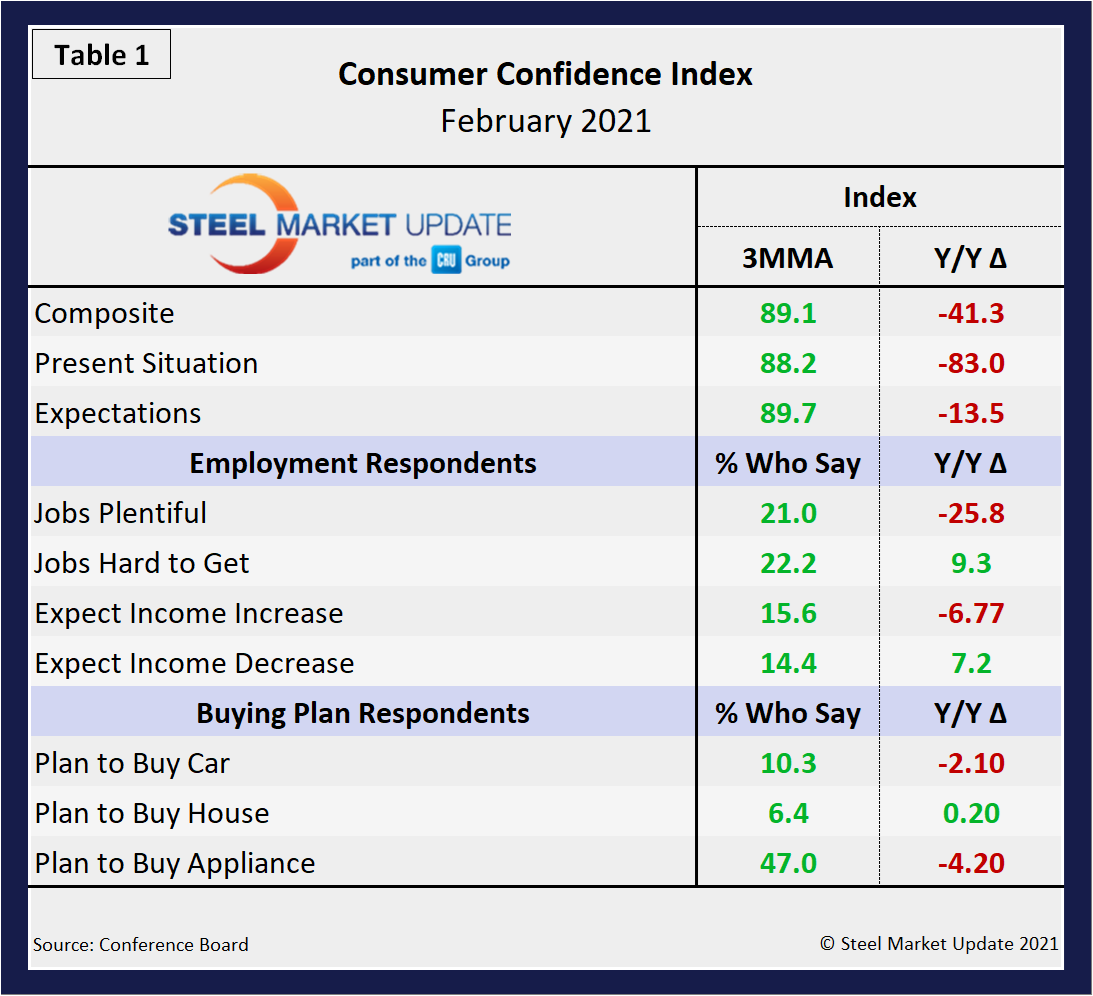
On a 3MMA basis comparing February 2021 with February 2020, the present situation was down by 83.0 points and expectations were down by 13.5 points (Table 1). The consumer confidence report also includes both employment data and some purchase plans and these are summarized in Table 1. The color codes show improvement or deterioration of the individual components. Although the 3MMA remains positive, they are all on a downward move. Year-over-year results are noticeably down across most factors plagued by COVID-related shutdowns and mitigation efforts.
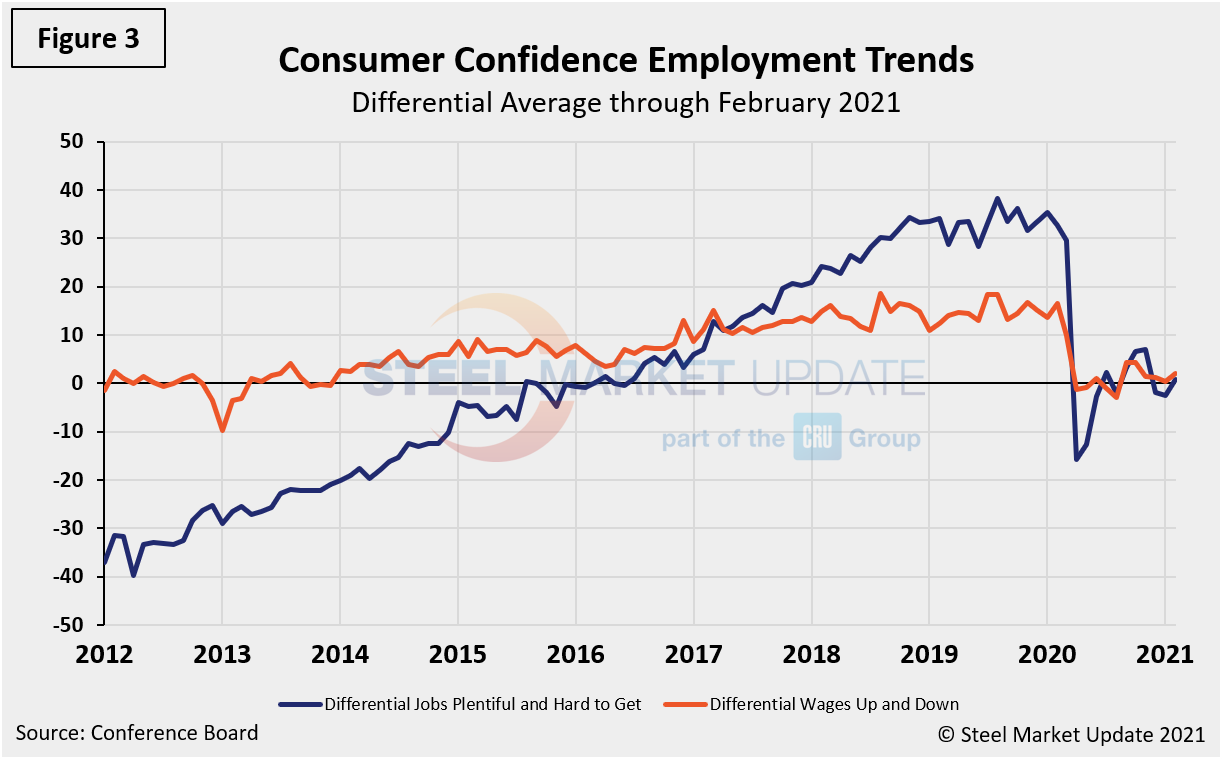
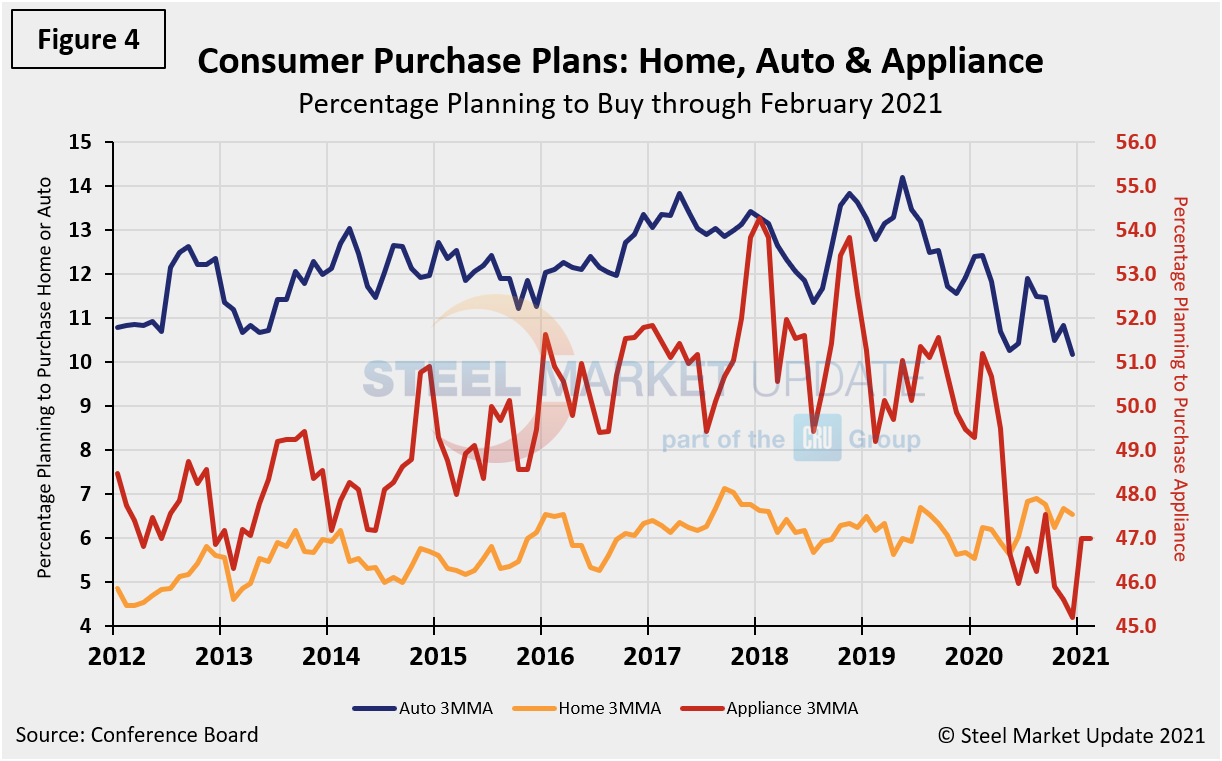
The differential between those finding jobs plentiful and those having difficulty (Figure 3) swung 51 points from a positive 35.3 in January 2020 to a negative 15.7 in just three months because of the pandemic. As the economy improved and the marketplace rebounded, the differential rose to a positive 6.9 by November 2020, but has since experienced some turbulence during the winter months and slipped to 0.7 in February. Expectations for future wage changes were similarly affected, but not nearly as much. In February 2020, the differential was positive 16.6, but currently sits at a positive 2.0, for a drop of 14.6 points year on year. The trend across spending plans for consumer goods as measured by automobiles, homes and appliances has seen a similar outcome in Figure 4. Following notable decreases at the height of the pandemic in Q2 2020, some positive improvements were seen over the summer months, followed by repeated fluctuations to date in February 2021, as buyers remain largely cautious when it comes to spending.
About The Conference Board: The Conference Board is a global, independent business membership and research association working in the public interest. The monthly Consumer Confidence Survey®, based on a probability-design random sample, is conducted for The Conference Board by Nielsen. The index is based on 1985 = 100. The composite value of consumer confidence combines the view of the present situation and of expectations for the next six months.
By David Schollaert, David@SteelMarketUpdate.com


