

Market Data

March 15, 2021
SMU Analysis: Key Market Indicators Looking Up
Written by David Schollaert
Steel Market Update’s monthly analysis of Key Market Indicators–a host of data on the economy, raw materials, manufacturing, construction, and steel sheet and long products–shows that the marketplace continues to improve, albeit cautiously. At the onset of COVID-19 a year ago, the impact of the pandemic on the economy was delayed, with only 3 of 38 indicators reflecting the dire situation the United States was facing. At the worst of the pandemic a few months later, 18 of 38 indicators had shifted negative. In the data released through March 15 this year, only 8 of the 38 indicators are negative, highlighting the ongoing rebound.
SMU’s Present Situation and Trends analysis in the table below offers a snapshot of current sentiment and the near-term expected trajectory of the economy. All results are the latest available as of March 15, 2021. Readers should regard the color codes in the “Present Situation” column as a visual summary of the current market condition. The “Trend” columns are also color coded to give a quick visual appreciation of the market’s direction. All data included in this table was released within the past month. The month or specific date to which the data refers is shown in the second column from the far right. Click on the below table to expand it.
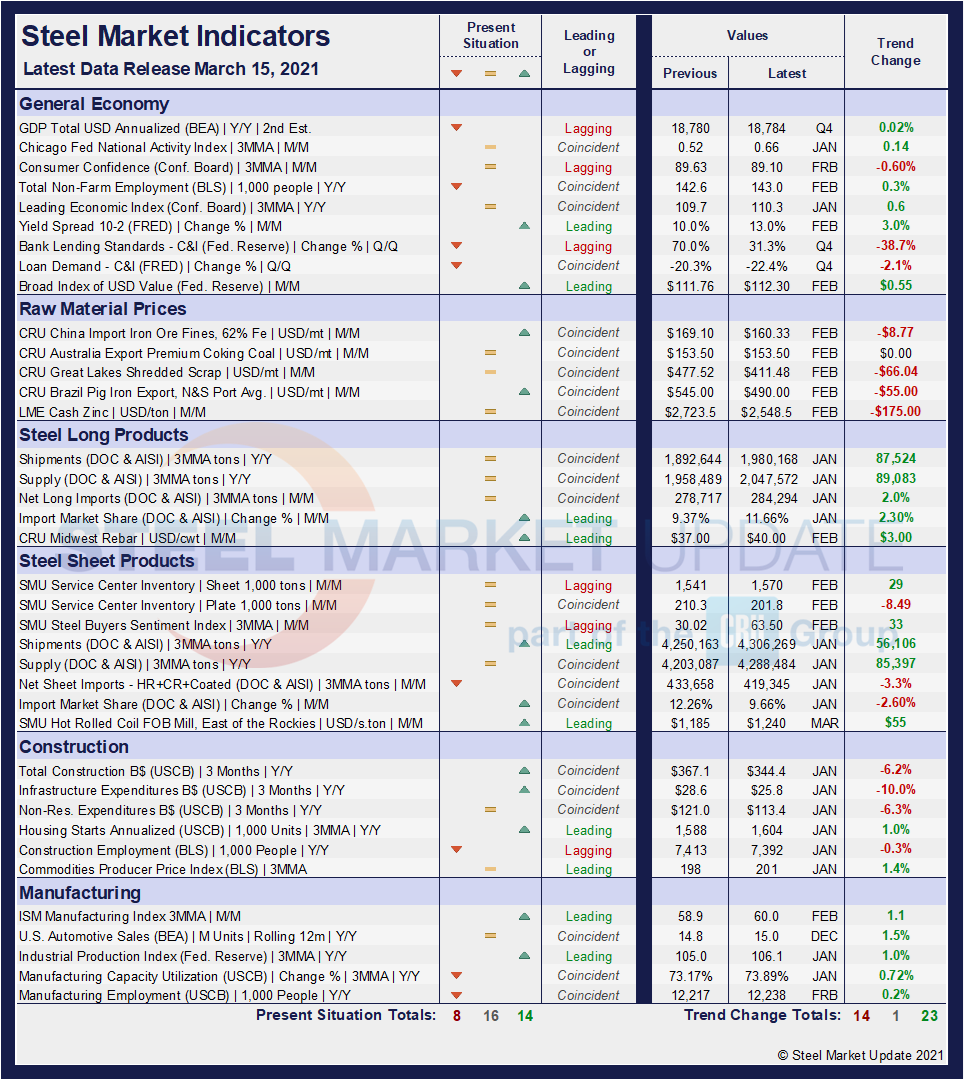
Present Situation
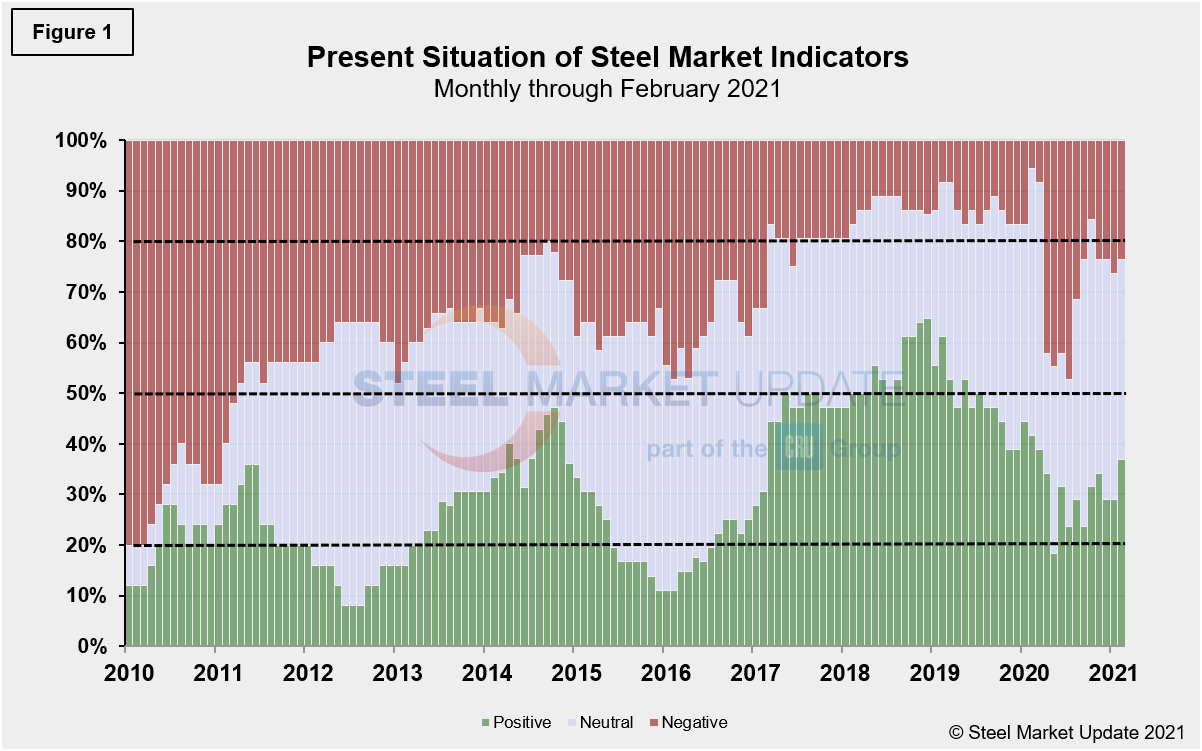
SMU’s present situation indicators highlight the differences between the fallout from the 2008-2009 economic recession and the health pandemic that has plagued the global marketplace, and in specific the U.S., over the past year. In 2010, as the market was working itself out of the recession doldrums, the present situation was 80.0% negative and only 12.0% positive. At its worst during the COVID pandemic, negative sentiment reached a low of 47.4%, while 23.7% remained positive. In that comparison, the Great Recession was far worse for the economy than the current pandemic. The marketplace has continued to respond to re-opening efforts and mass vaccinations, as our most recent assessment indicates a 36.8% positive situation; however, nearly 40.0% remain neutral as they keep a watchful eye on the economic progress.
We currently view 14 of the 38 indicators as positive, 15 as neutral and 9 as negative. Our monthly assessment of the present situation since January 2010 on a percentage basis is shown in Figure 1. Although early on in the pandemic a shift in our indicators from positive to negative was clearly seen, of late the shift has been toward the neutral category. We believe this highlights the hopeful but wait-and-see attitude in the marketplace.
Trends
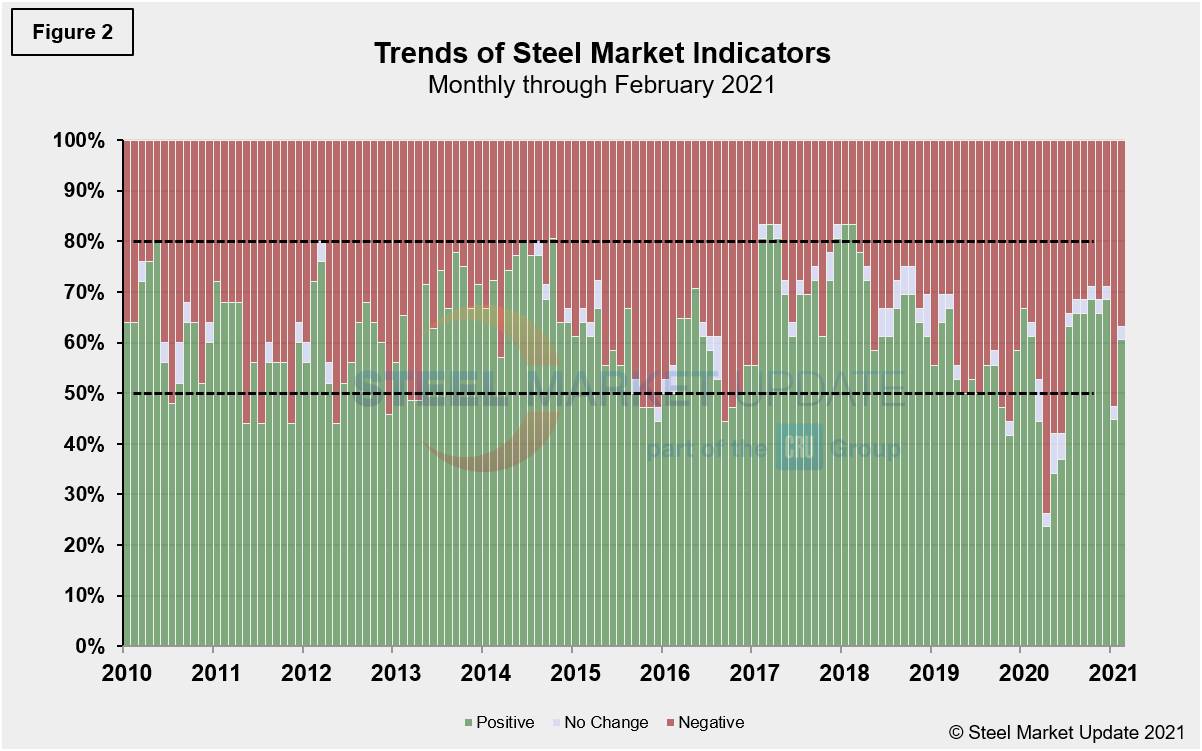
Most values in the trends columns are three-month moving averages (3MMA) to smooth erratic monthly data. Trend changes in the individual sectors since the beginning of March data are described below, with some general comments. (Please note that in many cases this is not February or March data, but data that was released in February or March for previous months.) In the four months March 2020 through June 2020, there was a clear decrease in the steel market indicator trends. At its worst in April, the negative trend reached 73.7%, but steadily improved to 28.9% through December. The trend did overreact, as did the market in January 2021, to a widespread surge in COVID cases throughout the year-end holidays. It corrected itself in February, however, and is expected to gain positive momentum in the near-term. Figure 2 shows the recent movement of the trends as well as the post-recession situation at the far left of the chart for comparison.
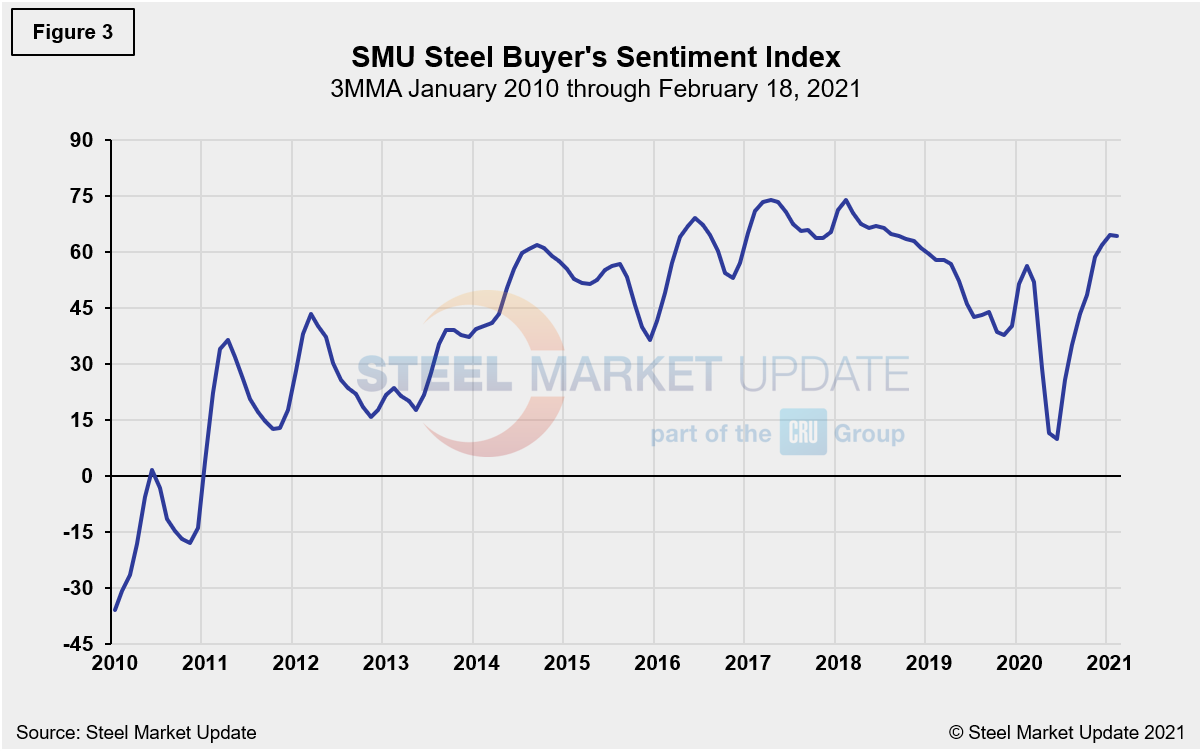
The SMU Steel Buyers Sentiment Index is a measure of the current attitude of North American buyers and sellers of flat rolled products regarding their company’s opportunity for success in today’s market. The single value of the index fell from +58 in early March 2020 to -8 less than a month later. It has since rebounded to a healthy +69 as of March 4, not far from historic highs. A reading above the neutral point of zero indicates that buyers have a positive attitude about their prospects. Rising demand and historically high steel prices should keep the Steel Buyer’s Sentiment Index at a highly optimistic level for the foreseeable future. Figure 3 shows the 3MMA of the index since 2010.
By David Schollaert, David@SteelMarketUpdate.com


