

Prices

March 30, 2021
Steel Imports Moving Up through March
Written by Brett Linton
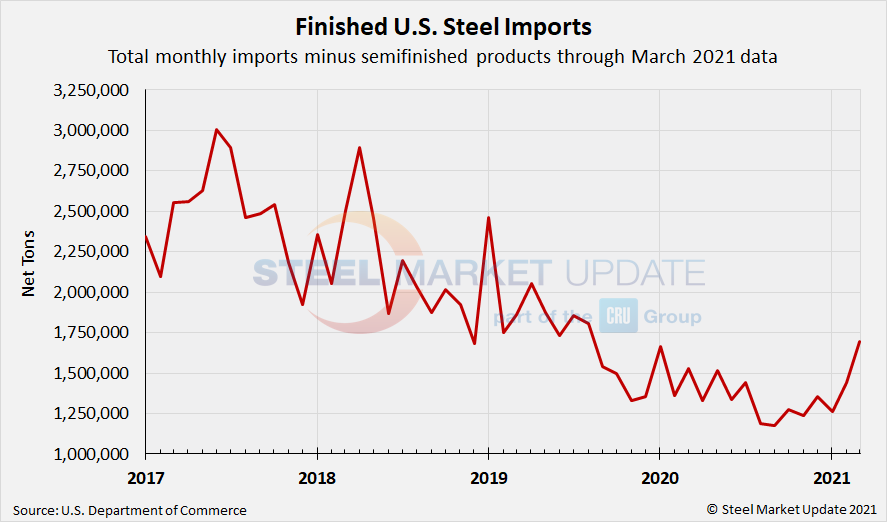
Finished steel imports jumped by 14% from January to February, according to preliminary Census figures, as buyers placed more foreign orders in search of relief from short supplies and high prices in the U.S. February imports totaled an estimated 1.89 million tons, which is actually 22% lower than January overall. But January’s total was inflated by the usual bump in semifinished imports in the first month of the quarter as buyers seek to maximize quarterly quota limits.
March import licenses are currently at 2.38 million tons as of data through March 30, up 26% from February, but down 2% from January. Recall that the average monthly import level for 2020 was 1.84 million tons, down from 2.32 million tons in 2019 and 2.81 million tons in 2018. Preliminary March finished steel imports are at 1.69 million tons, up 18% over February and up 34% over January. March finished-steel imports could potentially reach a 19-month high.
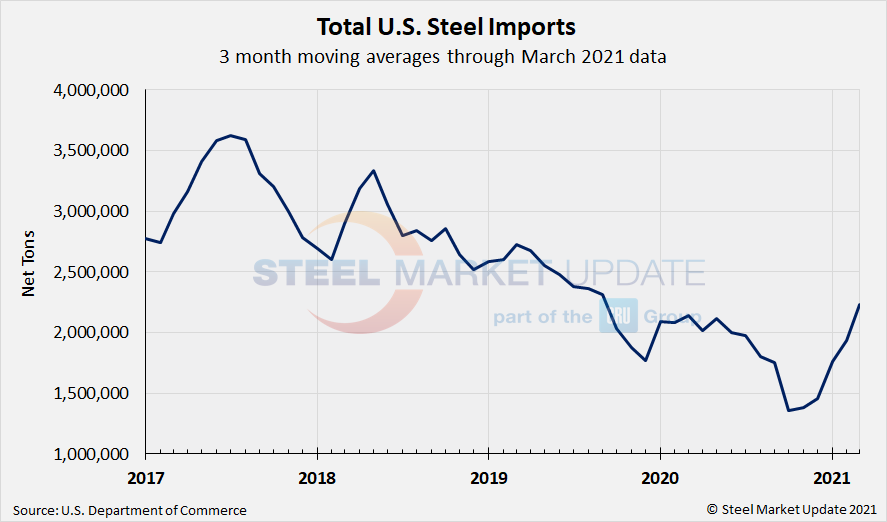
Due to large month-to-month swings in semifinished imports, the chart below shows total monthly imports on a three-month moving average (3MMA) basis in an attempt to more accurately display the U.S. steel import trend. The 3MMA through March license data is 2.23 million tons, up from 1.94 million tons in February and up from 1.76 million tons in January. The March 3MMA is the higest seen since September 2019.
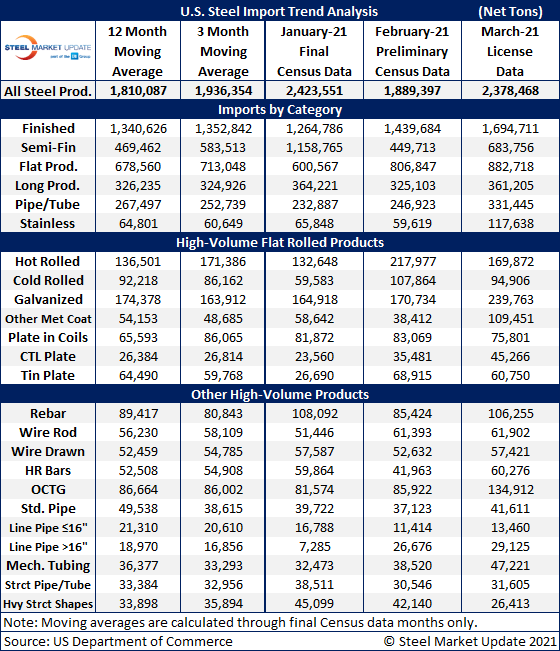
The below table now includes other high-volume products in addition to our normal focus on flat rolled products; we now show a brief history on products such as rebar, tin plate, wire rod, structural pipe and tube, and other long products. We also provide data on categorized imports, divided into semifinished, finished, flat rolled, longs, pipe and tube, and stainless products.
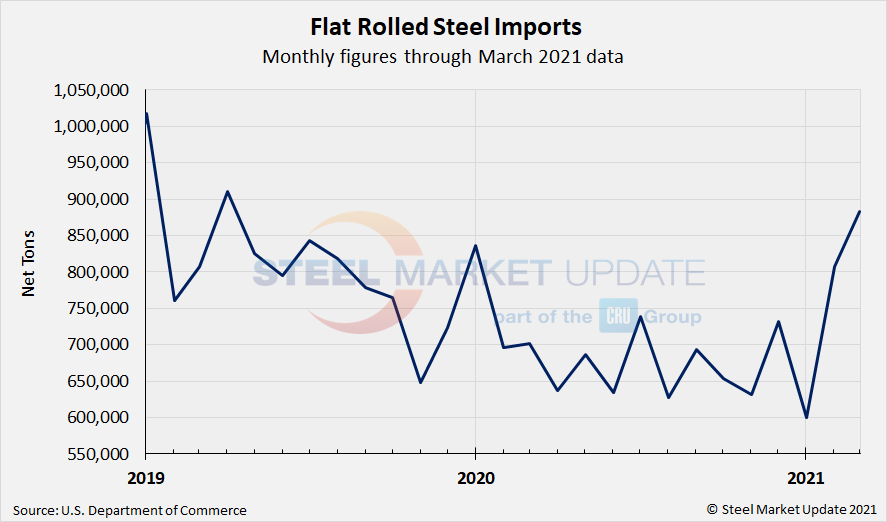
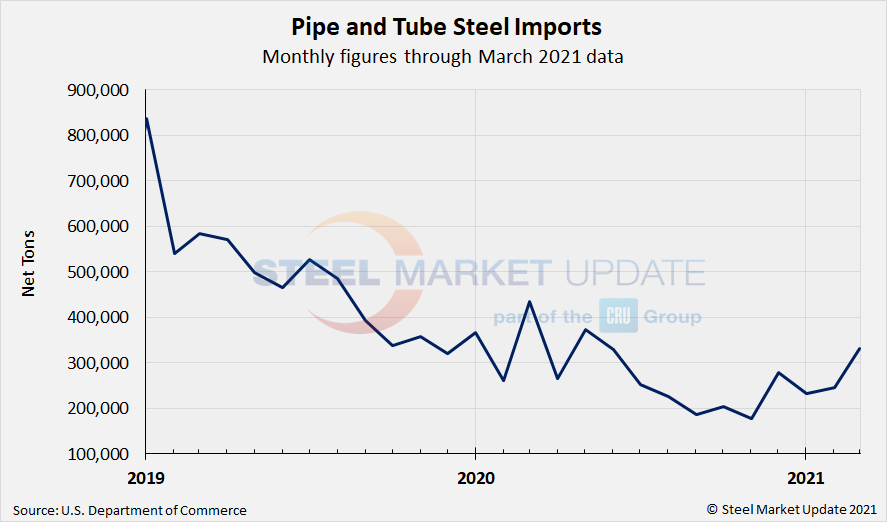
The two charts below show monthly imports grouped by product category: flat rolled imports and pipe and tube imports. Both product groups showed gains in February and March, with flat rolled imports rebounding from January’s multi-year low and approaching levels last seen nearly two years. March data suggests a 34% spike in pipe and tube products over February, up 42% from the January low and back in line with pre-pandemic levels.
By Brett Linton, Brett@SteelMarketUpdate.com


