

Market Data

April 1, 2021
Consumer Confidence: March Data Springs Forward
Written by David Schollaert
U.S. consumer confidence took a major leap forward in March, according to the latest data from The Conference Board. “Consumer confidence increased to its highest level since the onset of the pandemic in March 2020,” said Lynn Franco, Senior Director of Economic Indicators at The Conference Board. “Consumers’ assessment of current conditions and their short-term outlook improved significantly, an indication that economic growth is likely to strengthen further in the coming months. Consumers’ renewed optimism boosted their purchasing intentions for homes, autos and several big-ticket items. However, concerns of inflation in the short-term rose, most likely due to rising prices at the pump, and may temper spending intentions in the months ahead.”
Following a modest increase in February, the The Conference Board’s consumer confidence index surged in March to 109.7, up from 90.4 in February. The increase is the highest reading in a year. The present situation index, which is based on consumers’ assessment of current business and labor market conditions, and the expectations index, which is based on consumers’ short-term outlook for income, business and the labor market, also saw significant increases. The present situation index climbed from 89.6 to 110.0 month on month, while the expectations Index improved from 90.9 the prior month to 109.6 in March.
The surge comes as market conditions continue to improve and the pandemic’s days could be numbered. General market fatigue is giving way to hope from increased vaccine availability, another round of stimulus checks, and $2 trillion in proposed infrastructure spending. The notable month-on-month jump in data suggest that consumers are expectant that conditions may improve faster than anticipated.
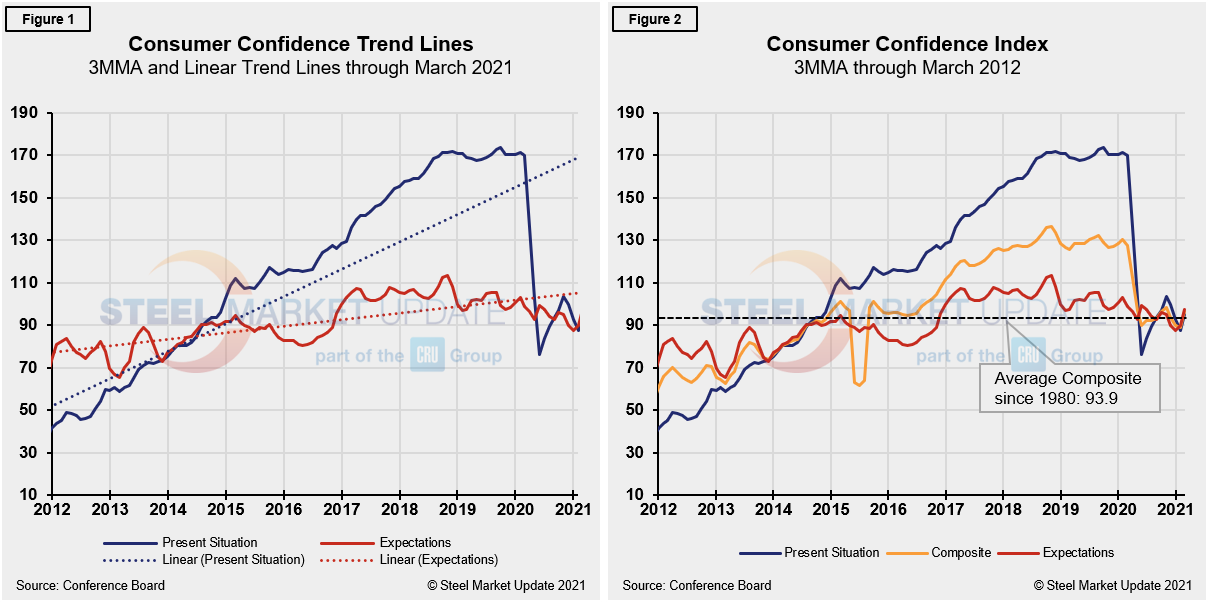
Calculated as a three-month moving average (3MMA) to smooth out the volatility, The Conference Board’s composite index rose in February to 96.3 compared to 88.8 in January. Still well below the pre-pandemic high of 130.4 last February and 127.3 year over year. The composite index is made up of two sub-indexes: the consumer’s view of the present situation and his or her expectations for the future. Figure 1 below notes the 3MMA linear trend lines from January 2012 through March 2021, while Figure 2 shows the trend lines of all three subcomponents of the index: present situation, composite and future expectations. All three had edged above the average composite line in October 2020 before falling consecutively through February. March’s rally pulled all three indexes above the composite line once again.
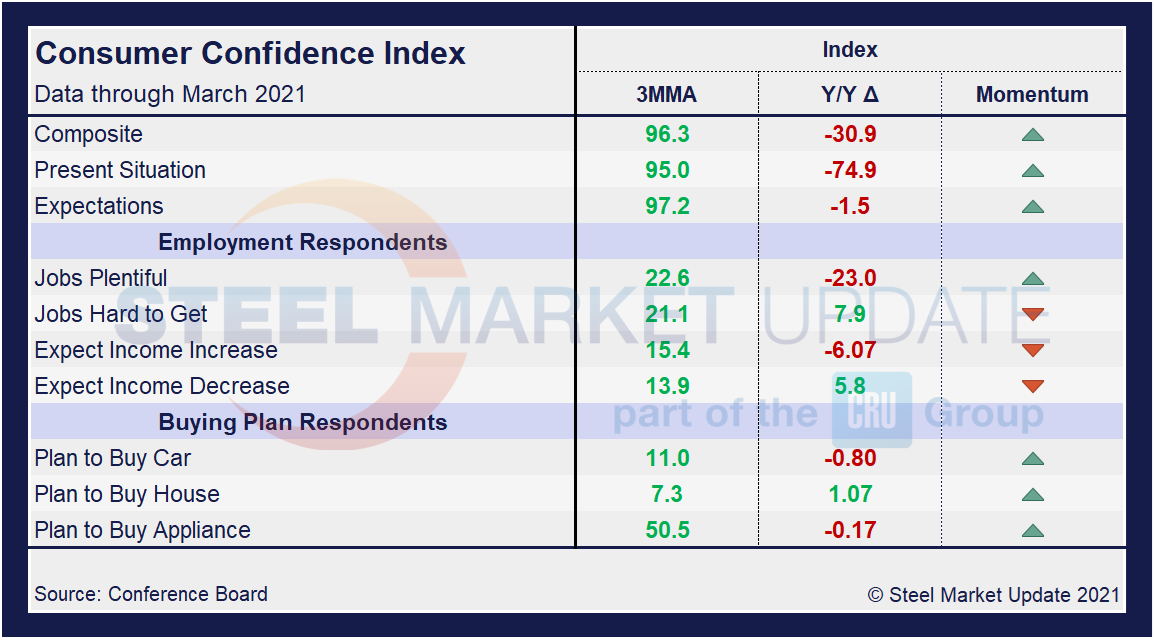
On a 3MMA basis comparing March 2021 with March 2020 in the table below, the present situation is down by 74.9 points, but expectations are down by only 1.5 points. The consumer confidence report also includes both employment data and some purchase plans and these are likewise summarized in the table below. The color codes show improvement or deterioration of the individual components. More importantly, almost all components are moving in the right direction in the momentum tracker. The composite, present situation and expectations are trending up, as are buying plans for autos, house, and appliances. The labor market landscape has also shifted as well, with respondents showing optimism that jobs are becoming more plentiful. Although income decreases and jobs being hard to get fell, an encouraging sign, expectations for incoming increases are still trending down.
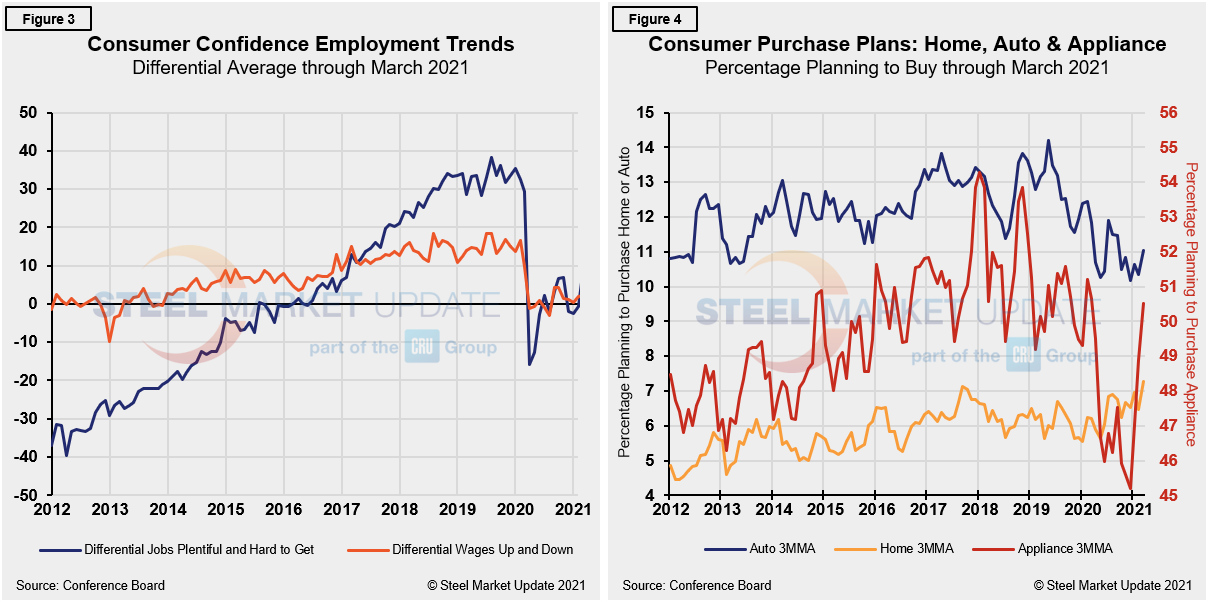
In January 2020, the differential between those finding jobs plentiful and those having difficulty was positive 35.3 (Figure 3). Yet, a full-blown pandemic caused a 51-point swing to a negative 15.7 in April. In the half year that followed, as the economy improved, the differential rebounded to a positive 6.9 by November 2020 before slipping to a negative 3.2 in January. Since then, however, the differential has risen to a positive 7.8 in March. Expectations for future wage changes were similarly affected, but not nearly as much. In January 2020, the differential was positive 13.6, falling to negative 3.0 in August, but rebounding to a positive 2.2 by March.
The trend across spending plans for consumer goods as measured by automobiles, homes and appliances has seen a similar outcome. Following prominent declines at the height of the pandemic in the second quarter of 2020, some positive improvements were seen over the summer months, followed by repeated fluctuations through March 2021 (Figure 4). Spending for both automobiles and appliances has risen consecutively over the past four months. Home buying has fluctuated over the same period, but saw a 2.4-point jump month on month.
SMU Comment: The jump in consumer sentiment in March, the highest mark since the onset of the pandemic, is a notable milestone. Rising consumer confidence, improved business and labor market conditions, and upgraded expectations couldn’t come at a better time. Consumers are sensing that the marketplace is turning a corner just as the winter months end. The growth potential in Q2 will be closely monitored.
About The Conference Board: The Conference Board is a global, independent business membership and research association working in the public interest. The monthly Consumer Confidence Survey®, based on a probability-design random sample, is conducted for The Conference Board by Nielsen. The index is based on 1985 = 100. The composite value of consumer confidence combines the view of the present situation and of expectations for the next six months.
By David Schollaert, David@SteelMarketUpdate.com


