

Market Data

April 8, 2021
Producer Prices Maintain Consistent Growth in March
Written by David Schollaert
Producer prices continue to rebound from the losses suffered during the early days of the COVID-19 pandemic last year. Since the decreases in March and April of 2020, the composite Producer Price Index (PPI) of all commodities from the Bureau of Labor Statistics (BLS) has seen consistent month-on-month increases. March’s index registered a 3.7% increase versus the prior month, and a 12.0% increase year on year, seasonally adjusted.
The PPI data, which covers more than 10,000 goods and services, is helpful in comparing the direction of price changes in the short and medium term. In specific, this analysis is intended to provide subscribers with a view of the competitive position of sheet steel, aluminum, plastic and wood. It also includes some downstream products and a comparison of truck and rail transportation.
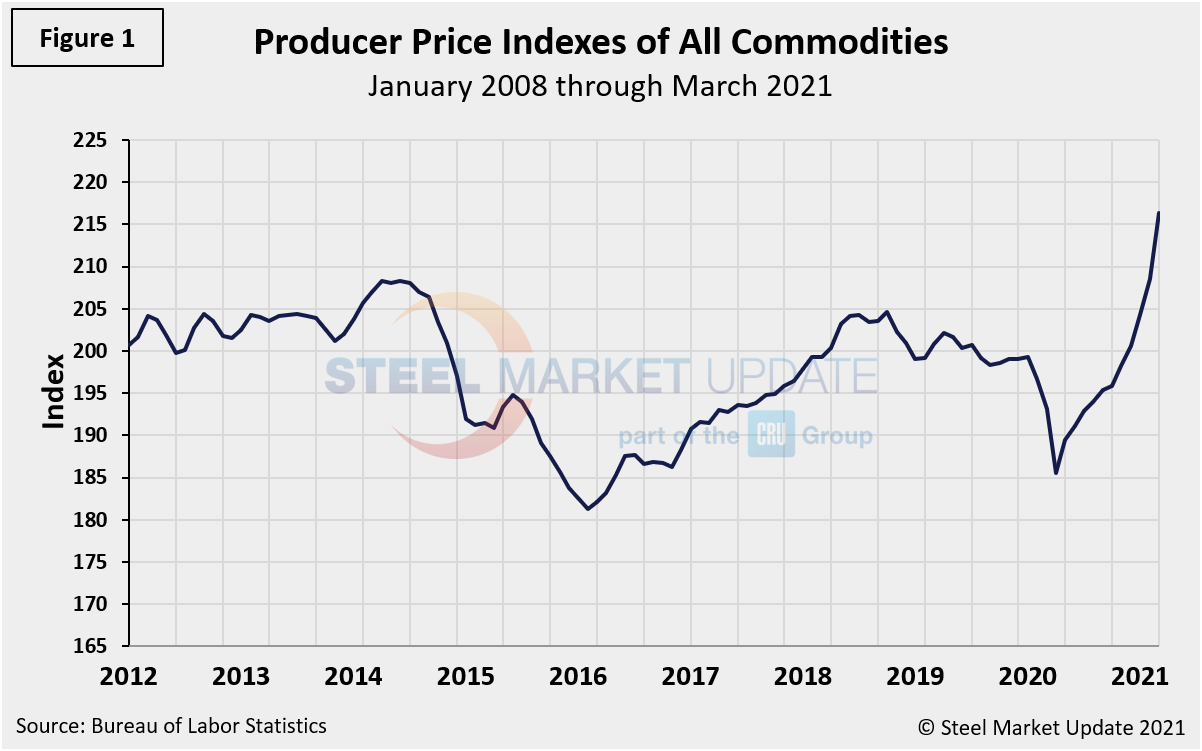
The composite PPI for all commodities (Figure 1) tumbled by more than 4.0% from February through April 2020 as the marketplace paused to limit the spread of COVID-19. The turnaround has been historic for both the economy and the steel sector. Hot rolled coil prices reached a new record of $1,500 per ton FOB mill, east of the Rockies, according to SMU’s check of the market May 3, and further increases are expected in the near-term. On an unadjusted basis, the final demand index moved up 4.2% for the 12 months ended in March, the largest advance since rising 4.5% for the 12 months ended September 2011, according to the BLS. The PPI is presently at 216.3 in March, up from 208.5 the month prior.
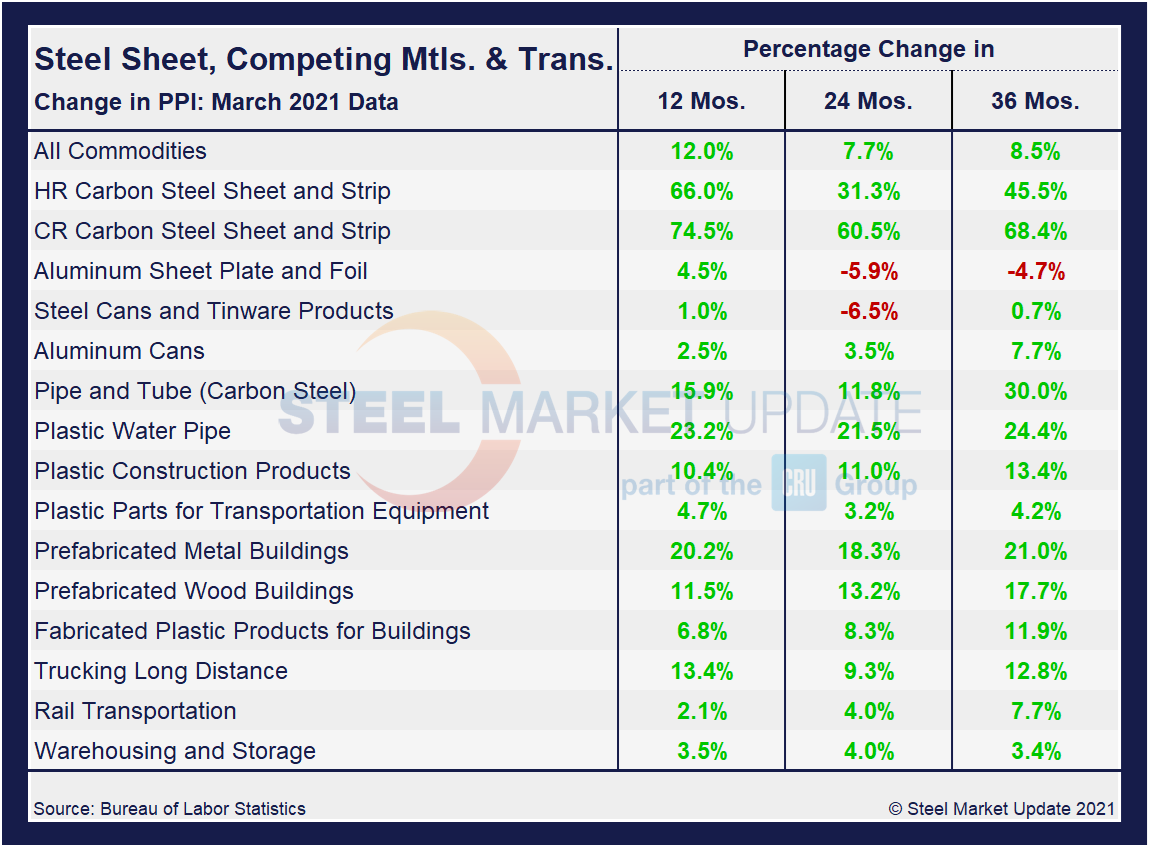
A summary of each segment on a year over one-, two- and three-year basis is shown in the table below. The gain/loss pattern is shown by the color codes; rising prices are considered positive. The positive swing on a 12-month basis would be expected, especially after the initial pandemic-driven slowdown and subsequent rebound. The fact that the table is predominantly green at the 24-month and 36-month level is a testament to the historic recovery and growth trajectory for the overall economy. Through March, all 16 sectors are now on the rise at the 12-month level, with HR and CR carbon steel sheet and strip showing major increases of 66.0% and 74.5%, respectively.
The table includes direct comparisons where possible between steel and competing products, while also including plastic products, transportation, warehousing and storage to further highlight current market conditions. Even though there may not be a direct or specific comparison of steel, these PPI numbers clearly match the trend seen across the steel market and rising demand. The marketplace has been resilient, with current expectations pointing towards additional growth for the foreseeable future.
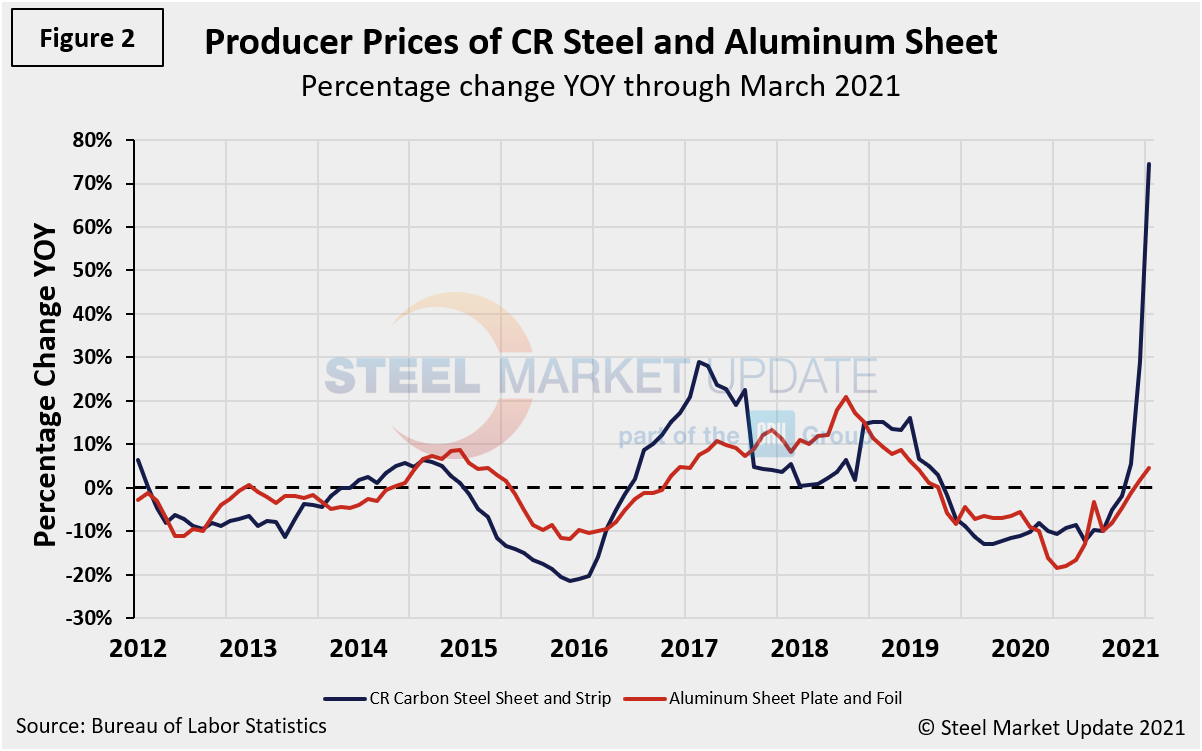
Both steel and aluminum products (Figure 2) have now surpassed pre-pandemic PPI figures and show no signs of slowing down. Comparing the price changes of cold rolled steel sheet and flat rolled aluminum, the lines have crossed and then reversed only a handfull of times over the past five years. Both have rebounded from last year’s losses, however, prices for cold rolled steel sheet soared through March, leaving flat rolled aluminum well behind. Cold rolled steel reached positive territory in December for the first time since May 2019 and has since jumped by 66.0% through February. Flat rolled aluminum, by comparison, reached a positive 4.5% in March.
Although aluminum is still well behind steel in terms of growth, it has improved month on month since October when it was at a negative 10.0%. In contrast, steel tinware and aluminum cans have remained largely stable over the past 12 months, with aluminum cans rising 2.5% month on month in March, while steel tinware was up by 1.0% when compared to February.
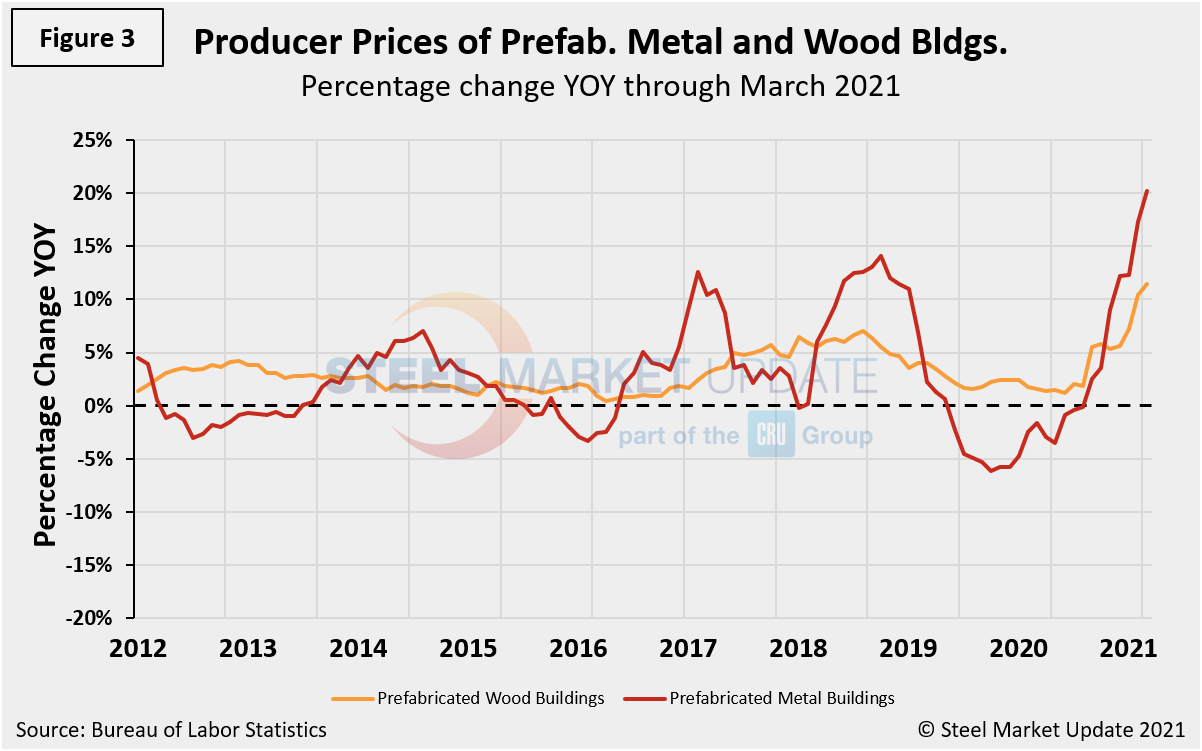
Prices of prefabricated metal buildings and prefabricated wood buildings have both seen big increases (Figure 3) since the beginning of 2021. Prefabricated steel building prices fell to a negative 3.1% last June, but have since rallied to a positive 20.2% through March and increased 4.0% month on month. Prefabricated wood buildings have seen growth of 11.5% year over year, up from 1.2% the month prior. The price of steel buildings has escalated by more than 20.6% since August.
The prices of steel and plastic pipe have both experienced big swings due to COVID-19. Steel pipe prices dropped to a negative 8.0% through last September, but rallied to a positive 15.9% through March. By comparison, plastic pipe has rallied by more than 21.4% since September, reaching a positive 23.2% in March.
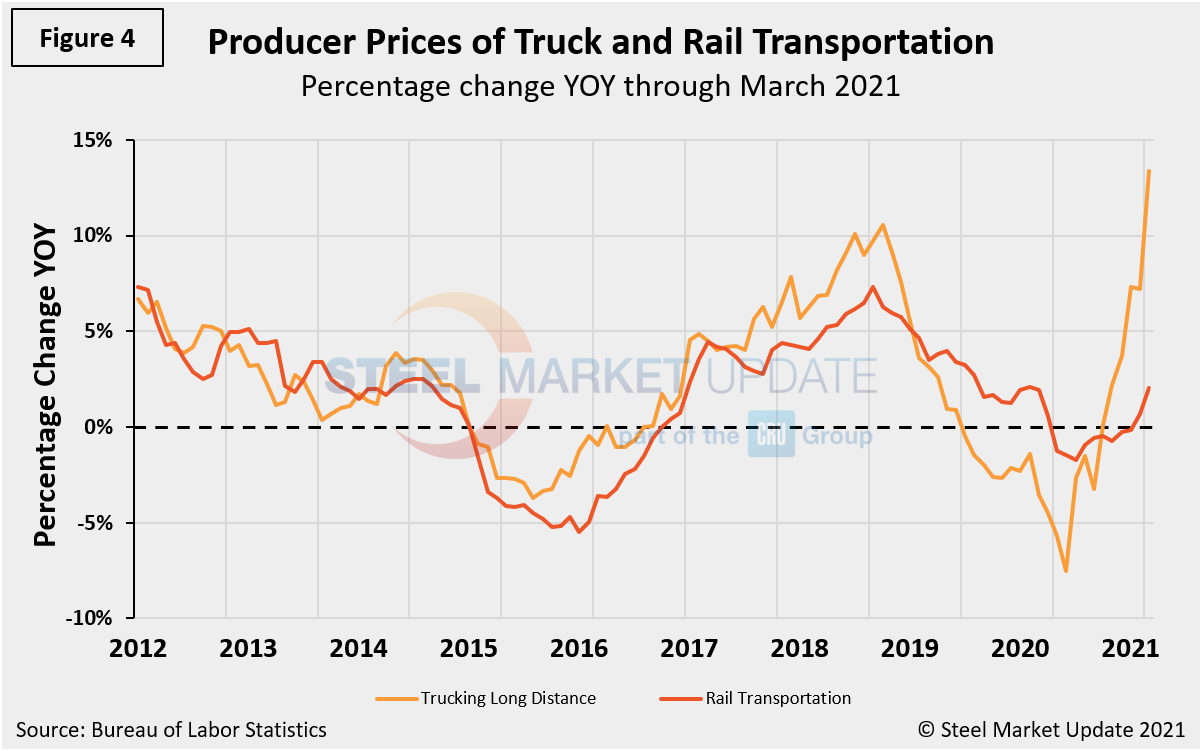
The escalation of truck transportation prices has exceeded those of rail (Figure 4) since they both bottomed out this past June. Rail dipped to a negative 1.5% last June and has since slowly corrected to a positive 2.1% through March. Long distance trucking, on the other hand, has rebounded to positive 13.4% through March after falling to negative 7.5% in June 2020. The increased freight pricing has been a compounding factor to steel buyers already wrestling with historically high finished steel prices. Long distance trucking rates rose 3.1% month on month, the most significant increase in more than a decade.
Warehousing and storage prices also have rallied. After initially falling to a negative 2.3% at the onset of the global pandemic, they have since rebounded to a positive 3.5% through March, the highest mark since December 2018.
The official description of this program from the BLS reads as follows: “The Producer Price Index (PPI) is a family of indexes that measure the average change over time in the prices received by domestic producers of goods and services. PPIs measure price change from the perspective of the seller. This contrasts with other measures, such as the Consumer Price Index (CPI). CPIs measure price changes from the purchaser’s perspective. Sellers’ and purchasers’ prices can differ due to government subsidies, sales and excise taxes, and distribution costs. More than 10,000 PPIs for individual products and groups of products are released each month. PPIs are available for the products of virtually every industry in the mining and manufacturing sectors of the U.S. economy. New PPIs are gradually being introduced for the products of industries in the construction, trade, finance, and services sectors of the economy. More than 100,000 price quotations per month are organized into three sets of PPIs: (1) stage-of-processing indexes, (2) commodity indexes, and (3) indexes for the net output of industries and their products. The stage-of-processing structure organizes products by class of buyer and degree of fabrication. The commodity structure organizes products by similarity of end use or material composition. The entire output of various industries is sampled to derive price indexes for the net output of industries and their products.
By David Schollaert, David@SteelMarketUpdate.com


