

Market Data

May 17, 2021
SMU Key Market Indicators: Bumpy Recovery Still Under Way
Written by David Schollaert
Steel Market Update’s latest analysis of monthly Key Market Indicators shows that the Present Situation markers have improved when compared to the month prior, while the Trend change saw a marginal contraction during the same period. Overall, the marketplace continues to recover from the pandemic as key metrics show further improvement.
SMU’s Key Market Indicators include a host of data on the economy, raw materials, manufacturing, construction, and steel sheet and long products, offering a snapshot of current sentiment and the near-term expected trajectory of the economy.
As a continued point of reference, at the onset of COVID-19 nearly 14 months ago the impact of the pandemic on the economy was delayed, as only 3 of 38 Present Situation indicators reflected the dire situation the United States was facing. At no point did more than 18 of 38 indicators shift negative. In the data released through May 17 this year, only 6 of the 38 indicators are negative, an improvement from the month prior when 8 of the 38 indicators were negative. The trend continues to point towards an economy and marketplace on the road to health.
SMU’s Present Situation and Trends analyses in the table below are based on the latest available data as of May 17, 2021. Readers should regard the color codes in the “Present Situation” column as a visual summary of the current market condition. The “Trend” columns are also color coded to give a quick visual appreciation of the market’s direction. All data included in this table was released within the past month. The month or specific date to which the data refers is shown in the second column from the far right. Click on the below table to expand it.
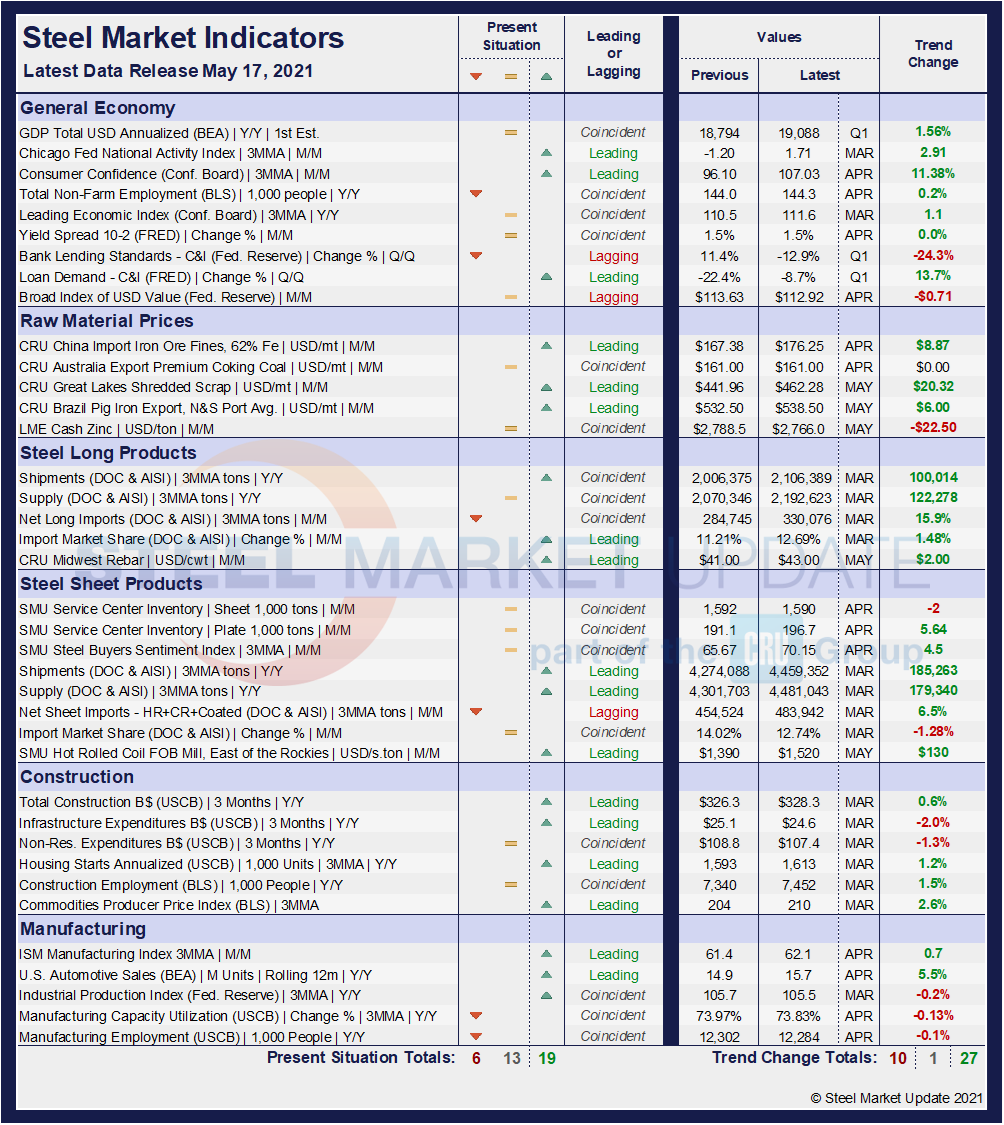
Present Situation
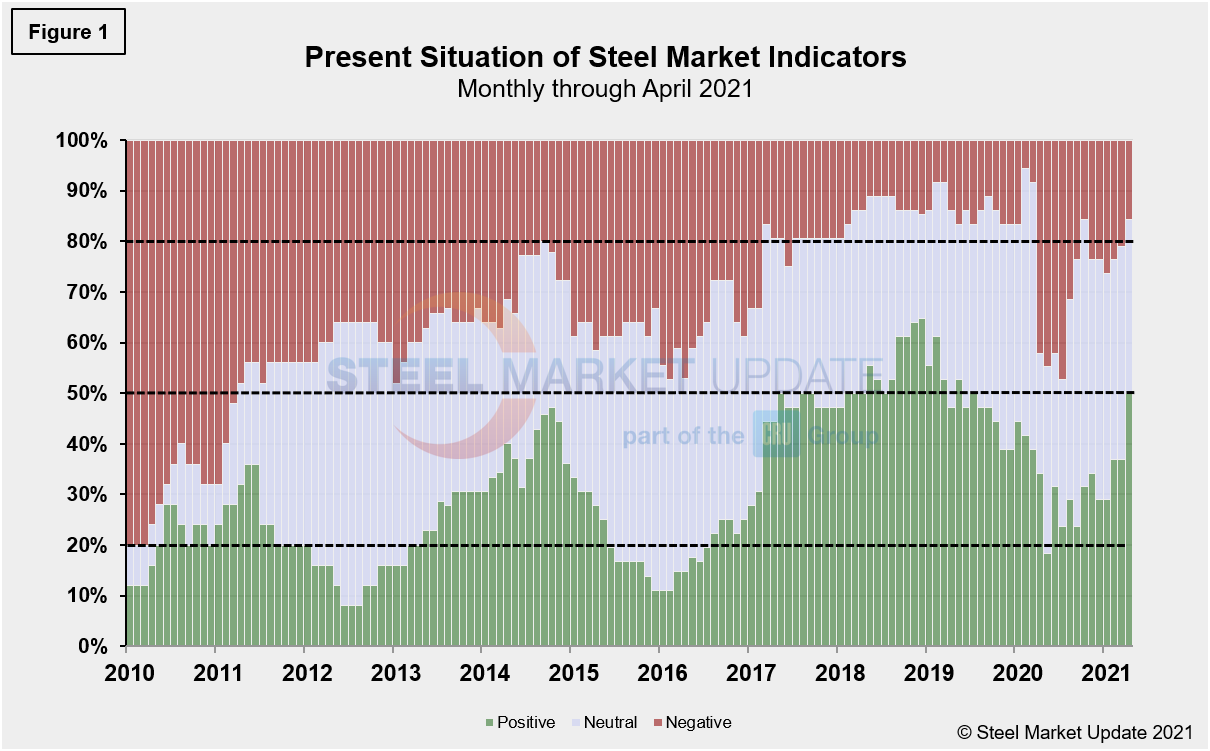
SMU’s Present Situation indicators below show that the fallout from the pandemic was sharp but relatively brief, while the road to recovery has been drawn out. This is not a surprise given the nature of the health crisis and its variables. The economy has seen a few starts and stops along the way, such as a less-than-stellar jobs report in April and an unemployment rate still hovering around 6.1%. Considering unemployment hit a record high of 14.7% a year ago, the market has made considerable progress. And when compared to the impact of the 2008-2009 economic recession, the financial and commercial harm suffered this past year has been far less. In 2010, as the market was working itself out of the recession doldrums, the present situation index was 80.0% negative and only 12.0% positive. At its worst during the COVID pandemic, negative sentiment reached a low of 47.4%, while 23.7% remained positive. In that comparison, the U.S. economy has shaken off the blows far better than during the Great Recession.
We currently view 19 of the 38 indicators as positive, 13 as neutral and just 6 as negative. These results show a positive shift when compared to last month’s data, when 14 were positive, 16 neutral and 8 negative. With both the neutral and negative totals improving, and the positive view increasing by 5 points, it is the largest improvement month on month since May 2020. The marketplace has continued to respond to reopening efforts and mass vaccinations, as our most recent assessment indicates a 50.0% positive situation and 34.2% neutral. Although 15.8% are still negative, 84.2% of our indicators are neutral/positive, pointing towards a generally bullish sentiment regarding domestic economic progress.
Our monthly assessment of the present situation since January 2010 on a percentage basis is shown in Figure 1. Early on in the pandemic, a shift in our indicators from positive to negative was clearly seen. The neutral category then gained ground in late 2020, reflecting a cautiously optimistic transition in the marketplace. Another move now seems under way as the positive view of SMU’s Present Situation (the green bar on the right below) has exceeded pre-pandemic levels.
Trends
Unlike the Present Situation, SMU’s Trends indicators saw a slight move in the neutral or negative scale. This divergence is not surprising due to the underwhelming workforce gains in April, as 9.8 million Americans currently remain unemployed. Additionally, the increase in gas prices—the average national price is up by more than 33.0% since December—and the precipitous 22% drop in vaccination rates in late April, are a few factors that may point towards a slight shift in SMU’s Trends indicators.
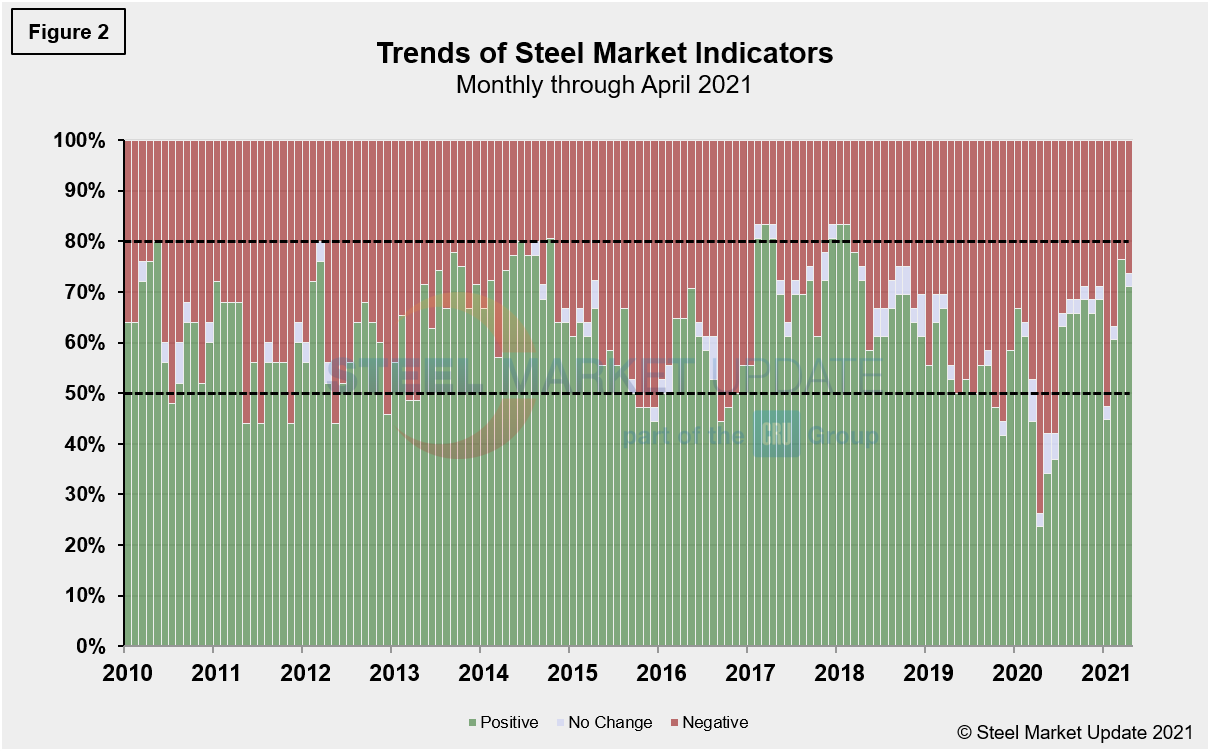
Most values in the Trends columns are three-month moving averages (3MMA) to smooth erratic monthly data. Trend changes in the individual sectors since the beginning of April data are described below, with some general comments. (Please note that in many cases this is not May or April data, but data that was released in April and/or May for previous months). Compared to month-ago data, the negative trend rose to 26.3% at present, compared to 23.7% last month. Additionally, the neutral trend rose from zero to 2.6% during the same period, while the positive trend lost ground from 76.3% to 71.1%. These results may just be a slight correction from April’s 15.8% increase—the highest positive mark since March of 2018—or may simply be a further indication that the road to recovery is not always smooth.
Despite the slight adjustment, Trends should continue to move in a positive direction over the long haul as vaccination efforts have been steady over the past week—156.2 million Americans have received at least one coronavirus vaccine dose, covering 47.1% of the total population, according to the CDC—leading to lesser restrictions and the prospect of further market and economic improvements. Below, Figure 2 shows the recent movement of the trends as well as the post Great Recession situation at the far left of the chart for comparison.
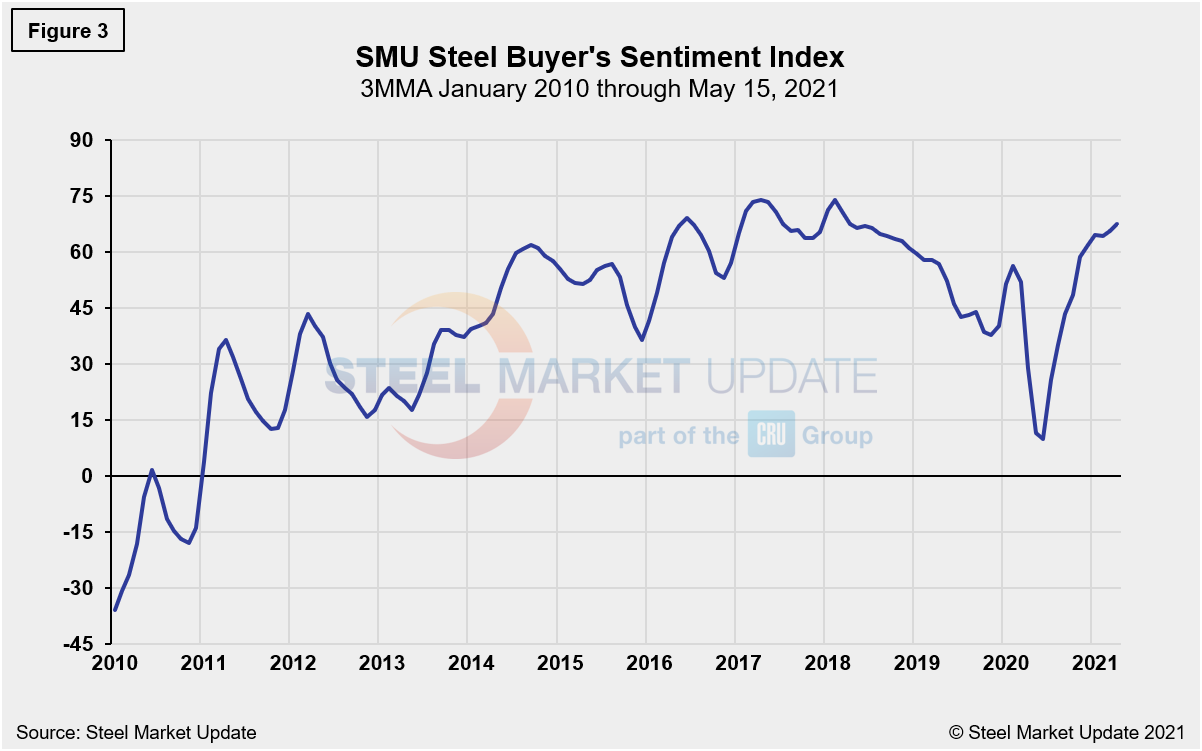
The SMU Steel Buyers Sentiment Index is a measure of the current attitude of North American steel buyers regarding their company’s chances for success in today’s market. The single value of the current sentiment index fell from +58 in early March 2020 to -8 less than a month later. It has since rebounded to a healthy +72 as of May 17, and nearing historic highs. Figure 3 shows the 3MMA of the index since 2010. A reading above the neutral point of zero indicates that buyers have a positive attitude about their prospects. Rising demand and historically high steel prices should keep the Steel Buyer’s Sentiment Index at a highly optimistic level for the foreseeable future.
By David Schollaert, David@SteelMarketUpdate.com


