

Market Data
May 26, 2021
Consumer Confidence Data Sees Little Change in May
Written by David Schollaert
U.S. consumer confidence saw little change in May following repeated gains since the beginning of 2021, according to the latest data from The Conference Board. The May index edged down marginally by 0.3 points month on month, following increases of more than 30 points from February through April.
“After rebounding sharply in recent months, U.S. consumer confidence was essentially unchanged in May,” said Lynn Franco, Senior Director of Economic Indicators at The Conference Board. “Consumers’ assessment of present-day conditions improved, suggesting economic growth remains robust in Q2. However, consumers’ short-term optimism retreated, prompted by expectations of decelerating growth and softening labor market conditions in the months ahead. Consumers were also less upbeat this month about their income prospects—a reflection, perhaps, of both rising inflation expectations and a waning of further government support until expanded Child Tax Credit payments begin reaching parents in July. Overall, consumers remain optimistic, and confidence should remain resilient in the short term, as vaccination rates climb, COVID-19 cases decline further, and the economy fully reopens.”
Despite the marginal contraction month on month, The Conference Board’s consumer confidence index has grown for the past four consecutive months, with the overall trajectory still pointing up. The recovery was especially significant from February through April, when the consumer confidence index rose from 87.1 to 117.5. Although recent surges have been significant, mirroring the economic turnaround from the COVID-19 doldrums, the index is still behind pre-pandemic levels. Despite the sideways move in May, data suggest that consumers are still hopeful the marketplace will make a full recovery as we approach the summer months.
The present situation index, which is based on consumers’ assessment of current business and labor market conditions, saw a 12.4-point jump month on month, while the expectations index, which is based on consumers’ short-term outlook for income, business and the labor market, edged down by 8.8 points. The present situation index climbed from 131.9 to 144.3 month on month, while the expectations index dipped from 107.9 the prior month to 99.1 in May. The divergence between the two indices suggests that consumers are still not confident the current surge can be sustained.
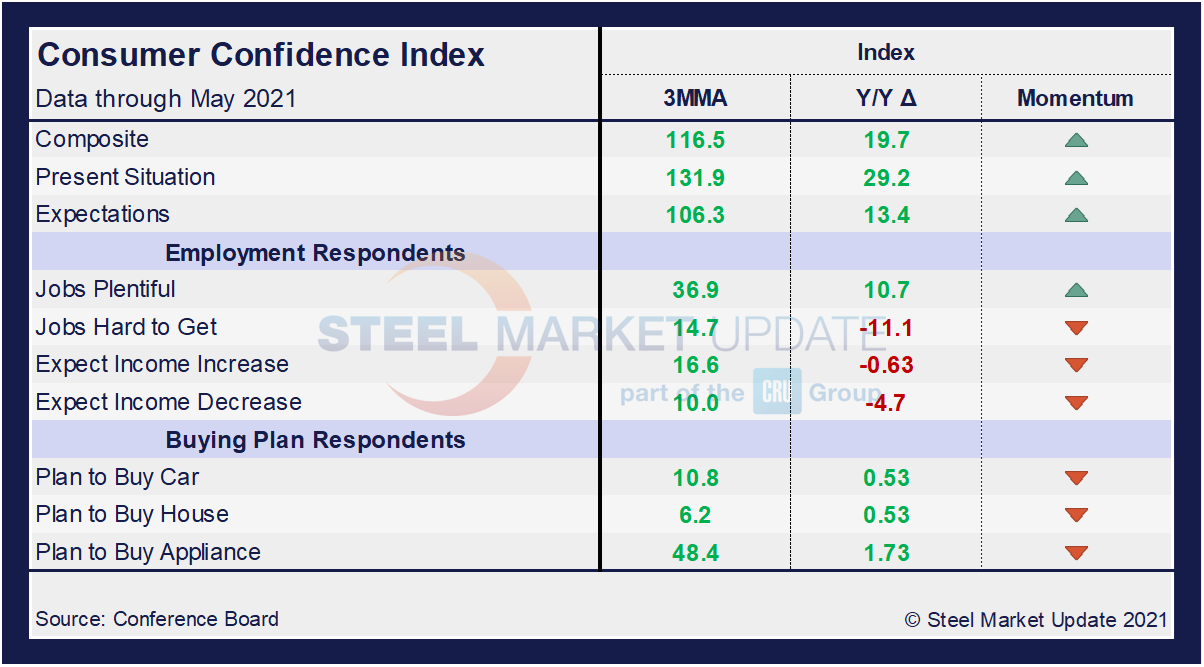
Calculated as a three-month moving average (3MMA) to smooth out the volatility, The Conference Board’s composite index rose in May to 116.6 compared to 109.2 in April–still well below the pre-pandemic high of 130.4 last February, but well above the 96.8 seen one year ago. The composite index is made up of two sub-indexes: the consumer’s view of the present situation and his or her expectations for the future. Figure 1 below notes the 3MMA linear trend lines from January 2012 through May 2021 versus the trend lines of all three subcomponents of the index: present situation, composite and future expectations. All three had edged above the average composite line in October 2020 before falling consecutively through February. March and April’s surge has pulled all three indexes above the composite line once again despite May’s small contraction.
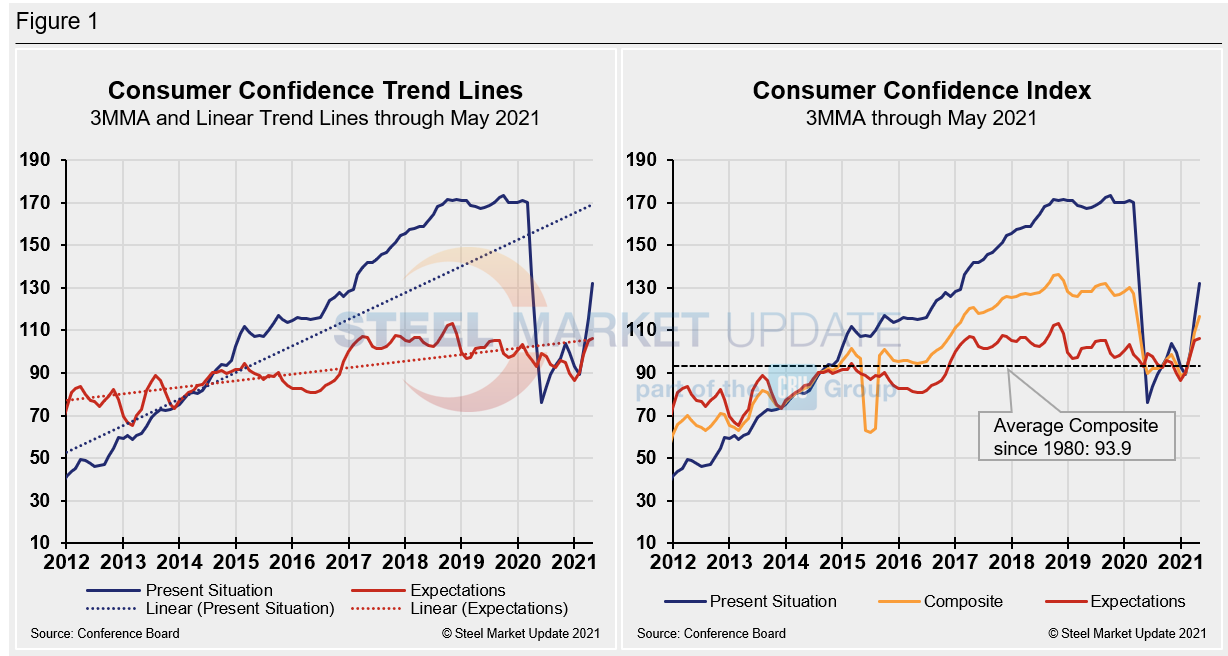
On a 3MMA basis comparing May 2021 with May 2020 in the table below, the present situation is up by 29.2 points, a vast improvement from just last month when the index was down 20.9 points. Expectations are now a positive 13.4 points, up from a positive 8.7 points the month prior. These increases are notable as our economy and marketplace recover from the COVID-19 blows. When comparing current 3MMA totals to the 2019 pre-pandemic year, however, the composite is still down 11.7 points while the present situation is down 35.7 points. Only expectations are showing a small increase of 4.3 points over that same period. This is further indication the recovery still has significant room to grow. The consumer confidence report also includes both employment data and some purchase plans and these are likewise summarized in the table below. The color codes show improvement or deterioration of the individual components.
The composite, present situation and expectations are not only trending up, but have made up much of the ground lost over the past 12 months that resulted from the fallout of the global pandemic. Buying plans for autos, homes and appliances are also up both on a 3MMA basis as well as when compared to year-ago levels; however, the momentum has turned as month-on-month buying plans have slowed. The labor market landscape has also shifted and represents a marketplace steadily moving towards health as job openings continue to rise. Respondents are not, however, as optimistic when it comes to the prospect of increased wages, as sentiment has tempered from the highs seen in March and April.
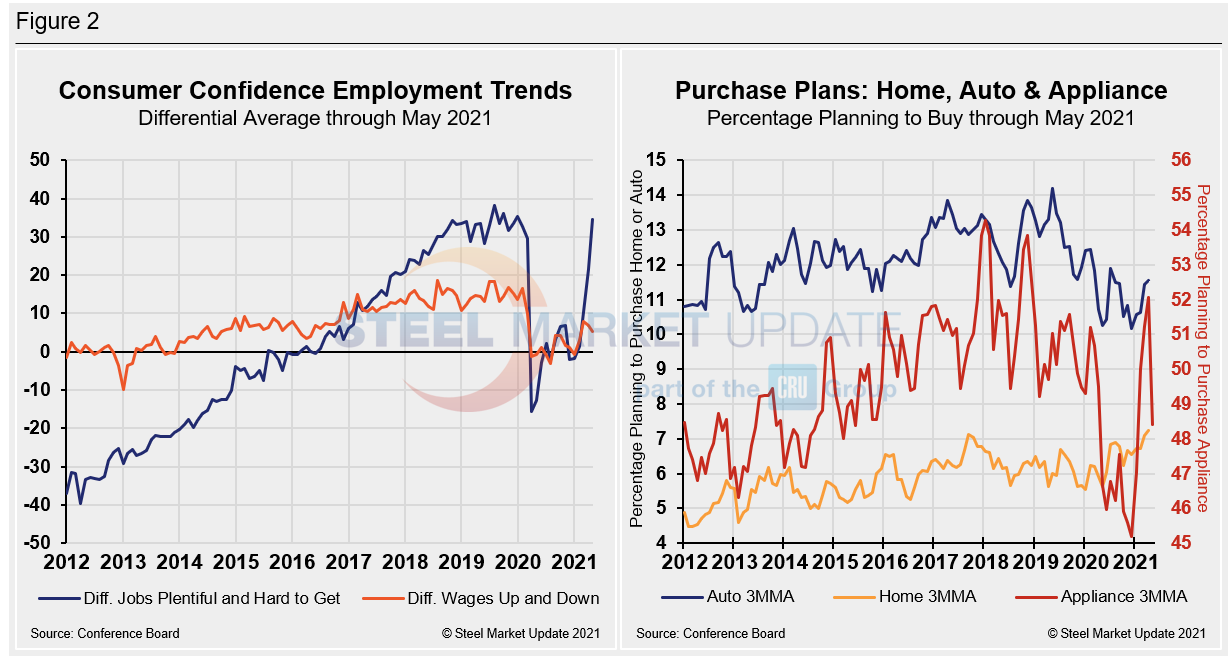
The differential between those finding jobs plentiful and those having difficulty has swung to a positive 34.6 in May, up from positive 21.6 in April and not far behind the most recent pre-pandemic high of a positive 35.3 in January 2020. At the height of the COVID-19 health crisis, the differential saw a 51-point swing to a negative 15.7 from January 2020 to April 2020. In the half year that followed, as the economy improved, the differential rebounded to a positive 6.9 by November 2020 before slipping back to a negative 3.2 in January. Since then, however, the differential seesaw has ceased as substantial growth has been seen in March through May. Expectations for future wage changes were similarly affected during the height of the pandemic, but not nearly as much. In January 2020, the differential was positive 13.6, falling to negative 3.0 at its lowest in August, but rebounding to a positive 7.9 in March 2021. Since, however, the differential has edged down month on month to positive 5.2 in May compared to positive 6.9 in April.
The spending plans for consumer goods as measured by automobiles, homes and appliances had been trending up and following the growth in consumer confidence. As buyers had grown increasingly assured of the market’s return to health and repeated economic impact payments by the U.S. government, home, auto, and appliance buying rose continually through March. Home buying plans reached the 7.5-point mark, while spending for automobiles reached the 12.2-point mark in the same period. All three indices have now edged down consecutively over the past two months as spending has been more conservative of late. These dynamics are illustrated below in Figure 2.
SMU Comment: The dichotomy seen in the present situation index growth versus the contraction in expectations underscores the marginal slip in the overall consumer confidence composite in May. The ebb and flow of the current economic recovery should remain bumpy due to the complexities that surround a global health crisis. An improving job market resulting from decreased COVID-19-related restrictions could drive market growth and consumer confidence. Many will keep a watchful eye on the upcoming summer months.
About The Conference Board: The Conference Board is a global, independent business membership and research association working in the public interest. The monthly Consumer Confidence Survey®, based on a probability-design random sample, is conducted for The Conference Board by Nielsen. The index is based on 1985 = 100. The composite value of consumer confidence combines the view of the present situation and of expectations for the next six months.
By David Schollaert, David@SteelMarketUpdate.com


